Collaborative Culture Jobs in England

Culture of Collaboration
UK > England

The table below provides summary statistics for permanent job vacancies advertised in England requiring Collaborative Culture skills. It includes a benchmarking guide to the annual salaries offered in vacancies that cited Collaborative Culture over the 6 months leading up to 16 May 2025, comparing them to the same period in the previous two years.

6 months to
16 May 2025
Same period 2024 Same period 2023
Rank 159 248 271
Rank change year-on-year +89 +23 +25
Permanent jobs citing Collaborative Culture 1,023 1,001 1,173
As % of all permanent jobs advertised in England 2.08% 1.17% 1.32%
As % of the Processes & Methodologies category 2.21% 1.37% 1.38%
Number of salaries quoted 535 713 325
10th Percentile £30,625 £32,500 £33,750
25th Percentile £43,875 £42,500 £48,500
Median annual salary (50th Percentile) £61,000 £67,500 £65,000
Median % change year-on-year -9.63% +3.85% +8.33%
75th Percentile £87,500 £85,000 £82,500
90th Percentile £110,000 £107,500 £96,374
UK median annual salary £61,000 £65,000 £65,000
% change year-on-year -6.15% - +8.33%

All Process and Methodology Skills
England

Collaborative Culture falls under the Processes and Methodologies category. For comparison with the information above, the following table provides summary statistics for all permanent job vacancies requiring process or methodology skills in England.

Permanent vacancies with a requirement for process or methodology skills 46,314 73,328 84,833
As % of all permanent jobs advertised in England 94.13% 85.41% 95.62%
Number of salaries quoted 23,693 53,833 50,206
10th Percentile £30,000 £29,000 £34,324
25th Percentile £42,000 £40,000 £46,000
Median annual salary (50th Percentile) £57,500 £55,000 £62,500
Median % change year-on-year +4.55% -12.00% +4.17%
75th Percentile £76,000 £73,250 £82,500
90th Percentile £98,474 £93,750 £102,500
UK median annual salary £57,500 £55,000 £61,180
% change year-on-year +4.55% -10.10% +1.97%

Collaborative Culture
Job Vacancy Trend in England

Job postings citing Collaborative Culture as a proportion of all IT jobs advertised in England.
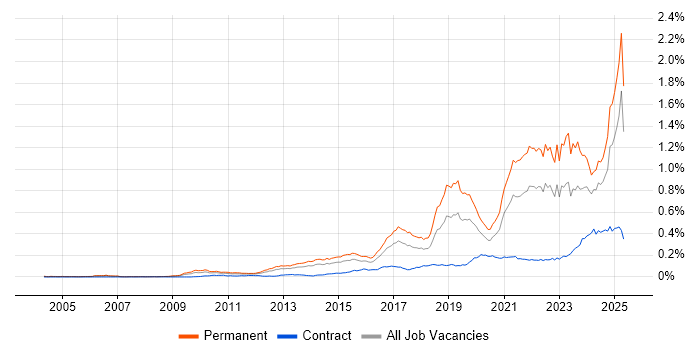
Job vacancy trend for Collaborative Culture in England

Collaborative Culture
Salary Trend in England

3-month moving average salary quoted in jobs citing Collaborative Culture in England.

Salary trend for Collaborative Culture in England

Collaborative Culture
Salary Histogram in England

Salary distribution for jobs citing Collaborative Culture in England over the 6 months to 16 May 2025.

Salary histogram for Collaborative Culture in England

Collaborative Culture
Job Locations in England

The table below looks at the demand and provides a guide to the median salaries quoted in IT jobs citing Collaborative Culture within the England region over the 6 months to 16 May 2025. The 'Rank Change' column provides an indication of the change in demand within each location based on the same 6 month period last year.

Location Rank Change
on Same Period
Last Year
Matching
Permanent
IT Job Ads
Median Salary
Past 6 Months
Median Salary
% Change
on Same Period
Last Year
Live
Jobs
London +93 387 £77,500 -3.13% 1,007
South East +165 226 £62,500 +8.70% 370
North of England -24 161 £57,560 -14.73% 239
East of England +70 109 £80,000 +100.00% 78
North West -34 101 £57,560 -11.45% 134
Midlands +37 75 £46,250 -22.92% 139
West Midlands +48 55 £46,000 -23.33% 74
Yorkshire +11 45 £52,500 -22.22% 72
South West +82 44 £45,000 -14.29% 108
East Midlands +12 18 £47,500 -5.00% 60
North East +45 15 £61,000 -9.63% 34
Collaborative Culture
UK

Collaborative Culture
Co-occurring Skills and Capabilities in England by Category

The follow tables expand on the table above by listing co-occurrences grouped by category. The same employment type, locality and period is covered with up to 20 co-occurrences shown in each of the following categories:

Application Platforms
1 23 (2.25%) SharePoint
2 17 (1.66%) Microsoft Exchange
3 15 (1.47%) Confluence
4 12 (1.17%) Apache Spark
5 11 (1.08%) IIS
6 10 (0.98%) CMS
7 5 (0.49%) Headless CMS
8 4 (0.39%) Apache Airflow
9 3 (0.29%) Jupyter
10 2 (0.20%) Skype for Business
10 2 (0.20%) Umbraco
10 2 (0.20%) WordPress
11 1 (0.098%) Apache
11 1 (0.098%) Exchange Server 2010
11 1 (0.098%) SAS
11 1 (0.098%) SharePoint Server
11 1 (0.098%) Strapi
Applications
1 15 (1.47%) Microsoft Excel
2 12 (1.17%) Microsoft Office
3 7 (0.68%) Chatbot
4 6 (0.59%) MS Visio
5 5 (0.49%) Microsoft Project
6 4 (0.39%) Adobe Creative Suite
7 3 (0.29%) Trello
8 2 (0.20%) Adobe Illustrator
8 2 (0.20%) Adobe XD
8 2 (0.20%) InDesign
8 2 (0.20%) Microsoft PowerPoint
8 2 (0.20%) Photoshop
9 1 (0.098%) InVision
9 1 (0.098%) Sketch
Business Applications
1 11 (1.08%) Dynamics CRM
2 4 (0.39%) Shopify
3 3 (0.29%) Maximo
3 3 (0.29%) Sage 50
4 2 (0.20%) Fidessa
4 2 (0.20%) Infor M3
4 2 (0.20%) Magento
5 1 (0.098%) Eikon
5 1 (0.098%) Elite 3E
5 1 (0.098%) Payment Gateway
5 1 (0.098%) SAP S/4HANA
5 1 (0.098%) Workday HCM
Cloud Services
1 161 (15.74%) Azure
2 150 (14.66%) AWS
3 68 (6.65%) SaaS
4 49 (4.79%) Microsoft 365
5 39 (3.81%) GCP
5 39 (3.81%) Serverless
6 37 (3.62%) Power Platform
7 27 (2.64%) GitHub
8 25 (2.44%) Azure DevOps
9 24 (2.35%) AWS Lambda
10 23 (2.25%) Entra ID
11 18 (1.76%) Amazon CloudWatch
12 15 (1.47%) Boomi
13 14 (1.37%) Amazon EventBridge
13 14 (1.37%) Amazon SQS
13 14 (1.37%) AWS CodeBuild
13 14 (1.37%) AWS CodeDeploy
13 14 (1.37%) AWS CodePipeline
13 14 (1.37%) AWS Step Functions
13 14 (1.37%) Cloud Computing
Communications & Networking
1 40 (3.91%) Firewall
2 18 (1.76%) VPN
3 16 (1.56%) DNS
4 15 (1.47%) Broadband
4 15 (1.47%) WAN
5 10 (0.98%) DHCP
5 10 (0.98%) Internet
6 9 (0.88%) SD-WAN
6 9 (0.88%) VoIP
7 7 (0.68%) Network Security
8 6 (0.59%) TCP/IP
8 6 (0.59%) VLAN
9 5 (0.49%) LAN
10 4 (0.39%) 5G
10 4 (0.39%) Bluetooth
10 4 (0.39%) Cisco ASA
10 4 (0.39%) Cisco Firepower
10 4 (0.39%) HTTPS
11 3 (0.29%) SAN
12 2 (0.20%) Wireless
Database & Business Intelligence
1 43 (4.20%) SQL Server
2 31 (3.03%) Tableau
3 30 (2.93%) Power BI
4 24 (2.35%) Big Data
4 24 (2.35%) MySQL
5 17 (1.66%) Data Warehouse
5 17 (1.66%) Metadata
6 15 (1.47%) Data Lake
7 14 (1.37%) NoSQL
8 10 (0.98%) Amazon RDS
8 10 (0.98%) PostgreSQL
9 9 (0.88%) GIS
10 7 (0.68%) Relational Database
11 6 (0.59%) Data Hub
11 6 (0.59%) SQL CLR
12 5 (0.49%) Elasticsearch
12 5 (0.49%) MariaDB
13 4 (0.39%) Hadoop
13 4 (0.39%) SQL Server Integration Services
14 3 (0.29%) MongoDB
Development Applications
1 47 (4.59%) JIRA
2 12 (1.17%) Git
3 11 (1.08%) GitLab
4 8 (0.78%) Jenkins
4 8 (0.78%) Postman
4 8 (0.78%) Selenium
5 7 (0.68%) Visual Studio
6 6 (0.59%) Appium
7 5 (0.49%) JMeter
8 4 (0.39%) CppUnit
8 4 (0.39%) Fiddler
8 4 (0.39%) LoadRunner
8 4 (0.39%) Rational DOORS
9 3 (0.29%) Cucumber
9 3 (0.29%) Subversion
10 2 (0.20%) Artifactory
10 2 (0.20%) Gradle
10 2 (0.20%) JUnit
10 2 (0.20%) Rational Rhapsody
10 2 (0.20%) TortoiseSVN
General
1 612 (59.82%) Social Skills
2 441 (43.11%) Finance
3 361 (35.29%) Marketing
4 302 (29.52%) Public Sector
5 137 (13.39%) Analytical Skills
6 90 (8.80%) Law
7 59 (5.77%) Inclusion and Diversity
8 49 (4.79%) Legal
9 36 (3.52%) Organisational Skills
10 32 (3.13%) Aerospace
10 32 (3.13%) Presentation Skills
11 30 (2.93%) Retail
12 22 (2.15%) Banking
13 21 (2.05%) Influencing Skills
14 13 (1.27%) Manufacturing
15 12 (1.17%) Electronics
16 11 (1.08%) Health Technology
17 10 (0.98%) Advertising
17 10 (0.98%) Back Office
17 10 (0.98%) Local Government
Job Titles
1 275 (26.88%) Business Manager
2 274 (26.78%) Development Manager
3 269 (26.30%) Business Development Manager
4 155 (15.15%) Lead
5 94 (9.19%) Senior
6 61 (5.96%) Developer
7 49 (4.79%) Analyst
8 36 (3.52%) Senior Manager
9 30 (2.93%) Team Leader
10 25 (2.44%) Architect
11 19 (1.86%) IT Manager
12 18 (1.76%) Associate Director
12 18 (1.76%) Infrastructure Engineer
12 18 (1.76%) Insight Analyst
12 18 (1.76%) Software Engineer
12 18 (1.76%) Technical Leader
13 17 (1.66%) Consultant
13 17 (1.66%) Operations Manager
13 17 (1.66%) Product Manager
14 16 (1.56%) Data Analyst
Libraries, Frameworks & Software Standards
1 39 (3.81%) .NET
2 30 (2.93%) RESTful
3 21 (2.05%) React
4 19 (1.86%) Kafka
5 16 (1.56%) OAuth
5 16 (1.56%) REST
6 14 (1.37%) JWT
7 12 (1.17%) PyTorch
7 12 (1.17%) Spring Boot
8 11 (1.08%) .NET Core
8 11 (1.08%) AngularJS
8 11 (1.08%) Node.js
8 11 (1.08%) React Native
8 11 (1.08%) Spring
9 10 (0.98%) .NET Framework
9 10 (0.98%) Web Services
10 9 (0.88%) Elastic Stack
10 9 (0.88%) Flutter
10 9 (0.88%) scikit-learn
11 8 (0.78%) TensorFlow
Miscellaneous
1 31 (3.03%) Management Information System
2 27 (2.64%) Cloud Native
3 24 (2.35%) Product Ownership
3 24 (2.35%) Self-Motivation
4 17 (1.66%) Data Centre
4 17 (1.66%) Social Media
5 15 (1.47%) Algorithms
5 15 (1.47%) Enterprise Software
5 15 (1.47%) Taxonomies
5 15 (1.47%) Team-Oriented Environment
6 13 (1.27%) Cyber Threat
6 13 (1.27%) Learning Management System
6 13 (1.27%) Public Cloud
7 12 (1.17%) Onboarding
8 10 (0.98%) Legacy Systems
9 9 (0.88%) Greenfield Project
9 9 (0.88%) Private Cloud
9 9 (0.88%) Virtual Team
10 8 (0.78%) Hybrid Cloud
10 8 (0.78%) Security Operations Centre
Operating Systems
1 69 (6.74%) Windows
2 49 (4.79%) Linux
3 37 (3.62%) Windows Server
4 9 (0.88%) Apple iOS
5 7 (0.68%) Android
5 7 (0.68%) Windows 10
6 5 (0.49%) Ubuntu
7 4 (0.39%) Windows Server 2016
7 4 (0.39%) Windows Server 2019
8 3 (0.29%) CentOS
8 3 (0.29%) Mac OS
8 3 (0.29%) Red Hat Enterprise Linux
9 2 (0.20%) Embedded Linux
9 2 (0.20%) Windows Server 2003
10 1 (0.098%) VMS
10 1 (0.098%) Windows Server 2008
10 1 (0.098%) Windows Server 2012
Processes & Methodologies
1 307 (30.01%) Business Development
2 301 (29.42%) Collaborative Working
3 275 (26.88%) Marketing Strategy
4 266 (26.00%) Facilities Management
5 243 (23.75%) Continuous Improvement
6 240 (23.46%) Agile
7 238 (23.26%) Problem-Solving
8 153 (14.96%) Mentoring
9 142 (13.88%) Analytics
10 116 (11.34%) Artificial Intelligence
11 111 (10.85%) Roadmaps
12 110 (10.75%) DevOps
13 92 (8.99%) Stakeholder Management
14 90 (8.80%) Project Management
15 86 (8.41%) Software Engineering
16 83 (8.11%) CI/CD
17 76 (7.43%) Computer Science
18 70 (6.84%) Decision-Making
19 69 (6.74%) Coaching
20 66 (6.45%) Strategic Thinking
Programming Languages
1 138 (13.49%) SQL
2 121 (11.83%) Python
3 86 (8.41%) Java
4 55 (5.38%) C#
5 48 (4.69%) JavaScript
6 45 (4.40%) PowerShell
7 24 (2.35%) Bash
8 16 (1.56%) TypeScript
9 13 (1.27%) C
10 12 (1.17%) PHP
11 9 (0.88%) C++
11 9 (0.88%) T-SQL
12 8 (0.78%) PL/SQL
13 7 (0.68%) Ruby
14 3 (0.29%) Bicep
14 3 (0.29%) Perl
15 2 (0.20%) MATLAB
15 2 (0.20%) Scala
15 2 (0.20%) Shell Script
15 2 (0.20%) VB.NET
Qualifications
1 209 (20.43%) Degree
2 42 (4.11%) Master's Degree
3 41 (4.01%) Security Cleared
4 30 (2.93%) AWS Certification
4 30 (2.93%) Computer Science Degree
5 24 (2.35%) DBS Check
6 17 (1.66%) Azure Certification
6 17 (1.66%) Microsoft Certification
7 15 (1.47%) Cisco Certification
8 14 (1.37%) DV Cleared
9 13 (1.27%) CompTIA Security+
9 13 (1.27%) SC Cleared
10 12 (1.17%) CISSP
10 12 (1.17%) PMP
11 11 (1.08%) PMI Certification
12 8 (0.78%) CCNA
12 8 (0.78%) ISTQB
13 7 (0.68%) GCIH
13 7 (0.68%) MBA
13 7 (0.68%) PhD
Quality Assurance & Compliance
1 40 (3.91%) QA
2 38 (3.71%) Data Quality
3 32 (3.13%) GDPR
4 22 (2.15%) ISO/IEC 27001
5 14 (1.37%) California Consumer Privacy Act
6 10 (0.98%) NIST
7 9 (0.88%) Accessibility
8 7 (0.68%) PCI DSS
8 7 (0.68%) SLA
8 7 (0.68%) WCAG
9 6 (0.59%) Good Clinical Practice
9 6 (0.59%) PMO
9 6 (0.59%) Sarbanes-Oxley
10 5 (0.49%) HIPAA
11 3 (0.29%) 21 CFR Part 11
12 2 (0.20%) Actionable Recommendations
12 2 (0.20%) Cyber Essentials
12 2 (0.20%) NCSC
13 1 (0.098%) GRC
13 1 (0.098%) SOC 2
System Software
1 52 (5.08%) Active Directory
2 37 (3.62%) Docker
3 24 (2.35%) VMware Infrastructure
4 16 (1.56%) Hyper-V
5 6 (0.59%) Embedded Firmware
5 6 (0.59%) Firmware
5 6 (0.59%) Virtual Machines
6 4 (0.39%) Virtual Desktop
6 4 (0.39%) Virtual Servers
7 3 (0.29%) Dovecot
7 3 (0.29%) Postfix
7 3 (0.29%) VMware ESXi
8 2 (0.20%) vSphere
9 1 (0.098%) NFS
9 1 (0.098%) XenDesktop
Systems Management
1 44 (4.30%) Kubernetes
2 42 (4.11%) Terraform
3 21 (2.05%) Ansible
4 12 (1.17%) Microsoft Intune
5 11 (1.08%) Progress Chef
5 11 (1.08%) Prometheus
6 7 (0.68%) Grafana
7 6 (0.59%) SCCM
8 4 (0.39%) Failover Clustering
8 4 (0.39%) SCOM
9 3 (0.29%) Argo
9 3 (0.29%) Puppet
9 3 (0.29%) Single Sign-On
10 2 (0.20%) FortiGate
10 2 (0.20%) SCOrch
10 2 (0.20%) SCSM
10 2 (0.20%) vCenter Server
10 2 (0.20%) VxRail
11 1 (0.098%) CASB
Vendors
1 132 (12.90%) Microsoft
2 42 (4.11%) Oracle
3 33 (3.23%) Salesforce
4 31 (3.03%) VMware
5 23 (2.25%) Google
5 23 (2.25%) ServiceNow
6 20 (1.96%) Adobe
7 19 (1.86%) Cisco
8 17 (1.66%) Informatica
9 16 (1.56%) MuleSoft
10 12 (1.17%) Databricks
11 8 (0.78%) Dell
11 8 (0.78%) HubSpot
12 7 (0.68%) Apple
12 7 (0.68%) Omniture
12 7 (0.68%) Red Hat
13 6 (0.59%) Fortinet
13 6 (0.59%) Veeam
14 5 (0.49%) iManage
14 5 (0.49%) Meraki