Customer Engagement Jobs in England

Customer Engagement
UK > England

The table below provides summary statistics for permanent job vacancies advertised in England requiring Customer Engagement skills. It includes a benchmarking guide to the annual salaries offered in vacancies that cited Customer Engagement over the 6 months leading up to 13 May 2025, comparing them to the same period in the previous two years.

6 months to
13 May 2025
Same period 2024 Same period 2023
Rank 349 463 337
Rank change year-on-year +114 -126 +156
Permanent jobs citing Customer Engagement 399 421 918
As % of all permanent jobs advertised in England 0.81% 0.49% 1.02%
As % of the Processes & Methodologies category 0.86% 0.57% 1.06%
Number of salaries quoted 186 287 366
10th Percentile £30,250 £28,950 £36,250
25th Percentile £39,063 £41,250 £52,500
Median annual salary (50th Percentile) £57,500 £58,350 £68,250
Median % change year-on-year -1.46% -14.51% +13.75%
75th Percentile £85,000 £82,875 £88,750
90th Percentile £98,474 £105,000 £97,500
UK median annual salary £57,500 £57,500 £70,000
% change year-on-year - -17.86% +9.80%

All Process and Methodology Skills
England

Customer Engagement falls under the Processes and Methodologies category. For comparison with the information above, the following table provides summary statistics for all permanent job vacancies requiring process or methodology skills in England.

Permanent vacancies with a requirement for process or methodology skills 46,211 73,441 86,231
As % of all permanent jobs advertised in England 94.15% 85.47% 95.62%
Number of salaries quoted 23,829 53,979 51,188
10th Percentile £30,000 £29,000 £34,324
25th Percentile £42,500 £40,000 £46,000
Median annual salary (50th Percentile) £57,500 £55,000 £62,500
Median % change year-on-year +4.55% -12.00% +4.17%
75th Percentile £76,250 £73,500 £82,500
90th Percentile £100,000 £93,750 £101,250
UK median annual salary £57,500 £55,000 £61,000
% change year-on-year +4.55% -9.84% +1.67%

Customer Engagement
Job Vacancy Trend in England

Job postings citing Customer Engagement as a proportion of all IT jobs advertised in England.
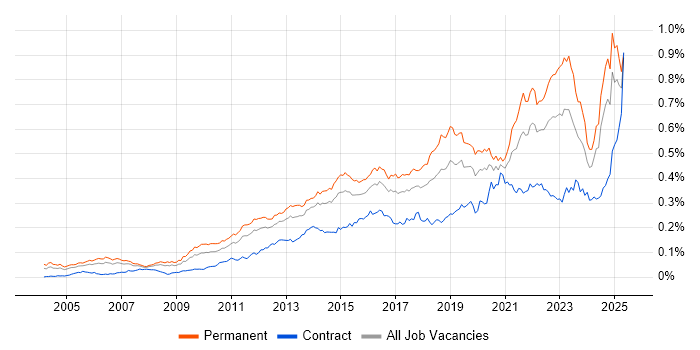
Job vacancy trend for Customer Engagement in England

Customer Engagement
Salary Trend in England

3-month moving average salary quoted in jobs citing Customer Engagement in England.

Salary trend for Customer Engagement in England

Customer Engagement
Salary Histogram in England

Salary distribution for jobs citing Customer Engagement in England over the 6 months to 13 May 2025.

Salary histogram for Customer Engagement in England

Customer Engagement
Job Locations in England

The table below looks at the demand and provides a guide to the median salaries quoted in IT jobs citing Customer Engagement within the England region over the 6 months to 13 May 2025. The 'Rank Change' column provides an indication of the change in demand within each location based on the same 6 month period last year.

Location Rank Change
on Same Period
Last Year
Matching
Permanent
IT Job Ads
Median Salary
Past 6 Months
Median Salary
% Change
on Same Period
Last Year
Live
Jobs
London +80 113 £66,404 -17.00% 587
North of England +62 86 £54,793 +36.98% 85
South East +128 68 £47,500 -23.01% 178
Midlands +66 53 £47,500 -17.39% 59
South West +113 47 £60,684 +61.82% 40
Yorkshire +110 44 £54,793 -39.95% 17
North West -4 41 £50,000 +25.00% 69
West Midlands +42 32 £45,000 -21.74% 29
East Midlands +35 21 £52,500 +10.53% 26
East of England -1 20 £32,500 -27.78% 25
North East +35 1 £52,500 +23.53%
Customer Engagement
UK

Customer Engagement
Co-occurring Skills and Capabilities in England by Category

The follow tables expand on the table above by listing co-occurrences grouped by category. The same employment type, locality and period is covered with up to 20 co-occurrences shown in each of the following categories:

Application Platforms
1 15 (3.76%) CMS
2 4 (1.00%) Apache Spark
2 4 (1.00%) Confluence
2 4 (1.00%) Headless CMS
2 4 (1.00%) SharePoint
3 2 (0.50%) Adobe Experience Manager
3 2 (0.50%) SAS
3 2 (0.50%) WordPress
4 1 (0.25%) Apache Airflow
4 1 (0.25%) NetWeaver
Applications
1 17 (4.26%) Microsoft Office
2 9 (2.26%) Microsoft Excel
3 5 (1.25%) MS Visio
4 3 (0.75%) Microsoft Project
5 2 (0.50%) Adobe Creative Suite
5 2 (0.50%) Adobe Illustrator
5 2 (0.50%) InDesign
5 2 (0.50%) Photoshop
6 1 (0.25%) Chatbot
6 1 (0.25%) Trello
Business Applications
1 26 (6.52%) Dynamics CRM
2 9 (2.26%) Shopify
3 5 (1.25%) Oracle ERP
4 2 (0.50%) Magento
4 2 (0.50%) SAP S/4HANA
5 1 (0.25%) Academy Revenues and Benefits
5 1 (0.25%) Oracle Retail
5 1 (0.25%) Remedy ITSM
5 1 (0.25%) SAP ERP
5 1 (0.25%) SAP FI
5 1 (0.25%) SAP FSCM
5 1 (0.25%) SAP MDG
Cloud Services
1 54 (13.53%) Dynamics 365
2 42 (10.53%) Azure
3 35 (8.77%) Power Platform
4 30 (7.52%) AWS
5 26 (6.52%) SaaS
6 22 (5.51%) PowerApps
7 21 (5.26%) Google Analytics
8 20 (5.01%) Power Automate
9 10 (2.51%) Azure Logic Apps
9 10 (2.51%) GCP
10 6 (1.50%) Azure DevOps
10 6 (1.50%) Azure Functions
10 6 (1.50%) Cloud Computing
10 6 (1.50%) Serverless
11 5 (1.25%) Google Ads
11 5 (1.25%) PaaS
12 4 (1.00%) Amazon EMR
12 4 (1.00%) Amazon SageMaker
12 4 (1.00%) Azure Data Factory
12 4 (1.00%) Microsoft 365
Communications & Networking
1 6 (1.50%) Network Security
2 5 (1.25%) SMS
3 4 (1.00%) VoIP
4 3 (0.75%) DNS
4 3 (0.75%) Firewall
4 3 (0.75%) Internet
5 2 (0.50%) LAN
5 2 (0.50%) MPLS
5 2 (0.50%) Unified Communications
5 2 (0.50%) VPN
5 2 (0.50%) WAN
6 1 (0.25%) BGP
6 1 (0.25%) Broadband
6 1 (0.25%) DHCP
6 1 (0.25%) Ethernet
6 1 (0.25%) Intranet
6 1 (0.25%) NAS
6 1 (0.25%) SSL
6 1 (0.25%) TCP/IP
6 1 (0.25%) WLAN
Database & Business Intelligence
1 19 (4.76%) Power BI
1 19 (4.76%) Tableau
2 7 (1.75%) SQL Server
3 4 (1.00%) Big Data
3 4 (1.00%) KDB
3 4 (1.00%) Kdb+
3 4 (1.00%) SQL Server Integration Services
4 3 (0.75%) Data Lake
4 3 (0.75%) NoSQL
5 2 (0.50%) Metadata
5 2 (0.50%) Relational Database
5 2 (0.50%) SAP HANA
6 1 (0.25%) Amazon QuickSight
6 1 (0.25%) Amazon Redshift
6 1 (0.25%) Apache Cassandra
6 1 (0.25%) Azure SQL Database
6 1 (0.25%) DynamoDB
6 1 (0.25%) Elasticsearch
6 1 (0.25%) Looker
6 1 (0.25%) SAP Data Services
Development Applications
1 9 (2.26%) JIRA
2 4 (1.00%) SQL Server Management Studio (SSMS)
2 4 (1.00%) Visual Studio
3 3 (0.75%) Selenium
4 1 (0.25%) MLflow
4 1 (0.25%) Team Foundation Server
General
1 164 (41.10%) Social Skills
2 113 (28.32%) Marketing
3 94 (23.56%) Finance
4 55 (13.78%) Analytical Skills
5 49 (12.28%) Presentation Skills
6 35 (8.77%) Inclusion and Diversity
7 21 (5.26%) Retail
8 18 (4.51%) Law
9 17 (4.26%) Advertising
9 17 (4.26%) Banking
9 17 (4.26%) Legal
10 16 (4.01%) Organisational Skills
11 11 (2.76%) Publishing
12 8 (2.01%) Brand Awareness
12 8 (2.01%) Public Sector
13 7 (1.75%) Electronics
13 7 (1.75%) Influencing Skills
13 7 (1.75%) Telecoms
14 6 (1.50%) Billing
14 6 (1.50%) Games
Job Titles
1 83 (20.80%) Engineering Manager
2 34 (8.52%) Lead
3 29 (7.27%) Architect
4 27 (6.77%) Senior
5 24 (6.02%) Analyst
6 23 (5.76%) Cisco Specialist
7 18 (4.51%) Consultant
7 18 (4.51%) Developer
7 18 (4.51%) Product Manager
7 18 (4.51%) Solutions Architect
8 14 (3.51%) IT Support
9 12 (3.01%) Marketing Manager
9 12 (3.01%) Project Manager
10 10 (2.51%) Product Owner
11 9 (2.26%) Dynamics 365 Developer
11 9 (2.26%) Product Marketing Manager
11 9 (2.26%) Sales Manager
11 9 (2.26%) Senior Analyst
12 8 (2.01%) Dynamics 365 Architect
12 8 (2.01%) Power Platform Developer
Libraries, Frameworks & Software Standards
1 15 (3.76%) CSS
1 15 (3.76%) HTML
2 11 (2.76%) .NET
3 8 (2.01%) .NET Framework
4 4 (1.00%) Django
4 4 (1.00%) Express.js
4 4 (1.00%) Flask
4 4 (1.00%) Kafka
4 4 (1.00%) MACH
4 4 (1.00%) Next.js
4 4 (1.00%) Node.js
4 4 (1.00%) React
5 3 (0.75%) JSON
6 2 (0.50%) Playwright
6 2 (0.50%) SAP Fiori
6 2 (0.50%) SOAP
6 2 (0.50%) XML
7 1 (0.25%) ASP.NET Web API
7 1 (0.25%) cloud-init
7 1 (0.25%) scikit-learn
Miscellaneous
1 22 (5.51%) Product Ownership
2 19 (4.76%) GNSS
3 17 (4.26%) Social Media
4 14 (3.51%) Analytical Mindset
5 8 (2.01%) Marketing Technology
5 8 (2.01%) Onboarding
5 8 (2.01%) Self-Motivation
6 5 (1.25%) Mobile App
7 4 (1.00%) Blog
7 4 (1.00%) Data Centre
7 4 (1.00%) Hackathon
8 3 (0.75%) Cyber Defence
9 2 (0.50%) Hybrid Cloud
9 2 (0.50%) Low-Code
9 2 (0.50%) PropTech
10 1 (0.25%) Algorithms
10 1 (0.25%) Driving Licence
10 1 (0.25%) Enterprise Cloud
10 1 (0.25%) Private Cloud
10 1 (0.25%) Public Cloud
Operating Systems
1 5 (1.25%) Linux
1 5 (1.25%) Windows
2 3 (0.75%) Mac OS
3 2 (0.50%) Android
3 2 (0.50%) Apple iOS
4 1 (0.25%) Unix
4 1 (0.25%) Windows Server
Processes & Methodologies
1 84 (21.05%) Systems Engineering
2 83 (20.80%) Model-Based Systems Engineering
3 77 (19.30%) CRM
4 61 (15.29%) Problem-Solving
5 60 (15.04%) Agile
6 59 (14.79%) Analytics
7 58 (14.54%) Project Management
8 51 (12.78%) Decision-Making
9 44 (11.03%) Digital Marketing
10 43 (10.78%) B2B
11 35 (8.77%) Marketing Strategy
12 34 (8.52%) Collaborative Culture
13 33 (8.27%) Customer Experience
13 33 (8.27%) Roadmaps
14 32 (8.02%) Stakeholder Management
15 31 (7.77%) Artificial Intelligence
15 31 (7.77%) Continuous Improvement
16 30 (7.52%) Mentoring
17 27 (6.77%) Value Proposition
18 26 (6.52%) Business Development
Programming Languages
1 26 (6.52%) C#
1 26 (6.52%) Python
2 17 (4.26%) SQL
3 16 (4.01%) JavaScript
4 8 (2.01%) R
5 5 (1.25%) C
6 4 (1.00%) X++
7 3 (0.75%) Go
8 1 (0.25%) ABAP
8 1 (0.25%) Bash
8 1 (0.25%) C++
8 1 (0.25%) MATLAB
8 1 (0.25%) PHP
8 1 (0.25%) PowerShell
8 1 (0.25%) TypeScript
Qualifications
1 139 (34.84%) Degree
2 97 (24.31%) Master's Degree
3 88 (22.06%) BPSS Clearance
4 83 (20.80%) Chartered Engineer
5 9 (2.26%) AWS Certification
5 9 (2.26%) Cisco Certification
5 9 (2.26%) Security Cleared
6 8 (2.01%) AWS Certified Cloud Practitioner
6 8 (2.01%) Azure Certification
6 8 (2.01%) MBA
7 7 (1.75%) Microsoft Certification
7 7 (1.75%) SC Cleared
8 6 (1.50%) CCNP
8 6 (1.50%) CISM
8 6 (1.50%) CISSP
8 6 (1.50%) PMI Certification
8 6 (1.50%) PMP
9 4 (1.00%) CCIE
9 4 (1.00%) ISTQB
9 4 (1.00%) ISTQB Foundation Certification
Quality Assurance & Compliance
1 21 (5.26%) PMO
2 9 (2.26%) GDPR
3 8 (2.01%) QA
4 6 (1.50%) California Consumer Privacy Act
4 6 (1.50%) PCI DSS
5 5 (1.25%) Data Quality
6 4 (1.00%) ISO/IEC 27001
7 3 (0.75%) Actionable Recommendations
7 3 (0.75%) GRC
7 3 (0.75%) NIST
8 2 (0.50%) Accessibility
9 1 (0.25%) ISO 9001
9 1 (0.25%) MiFID
9 1 (0.25%) PSD2
9 1 (0.25%) Sarbanes-Oxley
9 1 (0.25%) SLA
System Software
1 10 (2.51%) Docker
2 1 (0.25%) Snort
2 1 (0.25%) Virtual Machines
2 1 (0.25%) VMware Infrastructure
2 1 (0.25%) vSphere
Systems Management
1 10 (2.51%) Kubernetes
2 4 (1.00%) Ansible
3 3 (0.75%) Terraform
4 1 (0.25%) HP UCMDB
4 1 (0.25%) Microsoft Intune
4 1 (0.25%) vCenter Server
Vendors
1 75 (18.80%) Microsoft
2 32 (8.02%) Cisco
3 24 (6.02%) Salesforce
4 22 (5.51%) Google
5 15 (3.76%) Oracle
6 7 (1.75%) SAP
7 5 (1.25%) Adobe
7 5 (1.25%) HubSpot
7 5 (1.25%) PeopleSoft
7 5 (1.25%) ServiceNow
8 4 (1.00%) Databricks
8 4 (1.00%) Dell
8 4 (1.00%) Facebook
8 4 (1.00%) Palo Alto
8 4 (1.00%) Salesforce Marketing Cloud
9 3 (0.75%) Arista
9 3 (0.75%) CheckPoint
9 3 (0.75%) F5
9 3 (0.75%) Fortinet
9 3 (0.75%) Splunk