Mentoring Jobs in the UK excluding London

Mentorship
UK > UK excluding London

The table below provides summary statistics for permanent job vacancies advertised in the UK excluding London requiring Mentoring skills. It includes a benchmarking guide to the annual salaries offered in vacancies that cited Mentoring over the 6 months leading up to 12 May 2025, comparing them to the same period in the previous two years.

6 months to
12 May 2025
Same period 2024 Same period 2023
Rank 11 24 8
Rank change year-on-year +13 -16 +21
Permanent jobs citing Mentoring 3,866 5,638 8,965
As % of all permanent jobs advertised in the UK excluding London 9.86% 7.94% 14.97%
As % of the Processes & Methodologies category 10.62% 9.46% 15.66%
Number of salaries quoted 1,466 3,613 2,315
10th Percentile £32,500 £32,500 £36,250
25th Percentile £47,863 £42,238 £46,000
Median annual salary (50th Percentile) £62,500 £57,965 £62,500
Median % change year-on-year +7.82% -7.26% +8.70%
75th Percentile £73,886 £73,250 £77,500
90th Percentile £89,375 £84,964 £92,500
UK median annual salary £65,000 £62,500 £70,000
% change year-on-year +4.00% -10.71% +12.00%

All Process and Methodology Skills
UK excluding London

Mentoring falls under the Processes and Methodologies category. For comparison with the information above, the following table provides summary statistics for all permanent job vacancies requiring process or methodology skills in the UK excluding London.

Permanent vacancies with a requirement for process or methodology skills 36,419 59,619 57,237
As % of all permanent jobs advertised in the UK excluding London 92.92% 83.98% 95.60%
Number of salaries quoted 18,159 41,251 29,495
10th Percentile £27,000 £27,250 £30,500
25th Percentile £37,716 £36,250 £40,000
Median annual salary (50th Percentile) £52,500 £50,000 £55,000
Median % change year-on-year +5.00% -9.09% +4.76%
75th Percentile £66,100 £65,000 £70,000
90th Percentile £78,750 £77,500 £82,500
UK median annual salary £57,500 £55,000 £61,000
% change year-on-year +4.55% -9.84% +1.67%

Mentoring
Job Vacancy Trend in the UK excluding London

Job postings citing Mentoring as a proportion of all IT jobs advertised in the UK excluding London.
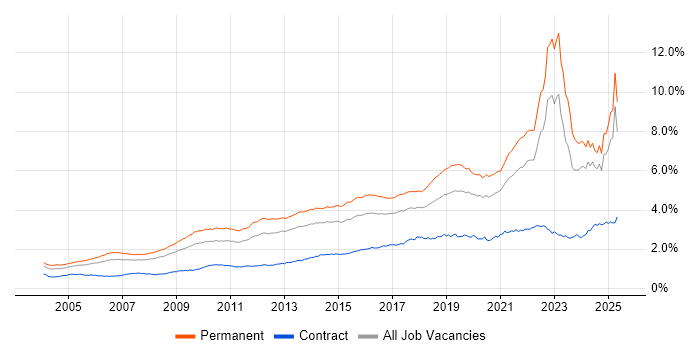
Job vacancy trend for Mentoring in the UK excluding London

Mentoring
Salary Trend in the UK excluding London

3-month moving average salary quoted in jobs citing Mentoring in the UK excluding London.

Salary trend for Mentoring in the UK excluding London

Mentoring
Salary Histogram in the UK excluding London

Salary distribution for jobs citing Mentoring in the UK excluding London over the 6 months to 12 May 2025.

Salary histogram for Mentoring in the UK excluding London

Mentoring
Job Locations in the UK excluding London

The table below looks at the demand and provides a guide to the median salaries quoted in IT jobs citing Mentoring within the UK excluding London region over the 6 months to 12 May 2025. The 'Rank Change' column provides an indication of the change in demand within each location based on the same 6 month period last year.

Location Rank Change
on Same Period
Last Year
Matching
Permanent
IT Job Ads
Median Salary
Past 6 Months
Median Salary
% Change
on Same Period
Last Year
Live
Jobs
South East +13 1,066 £62,000 +7.83% 1,043
North of England -15 949 £62,639 +4.40% 932
North West -16 697 £62,500 +7.82% 528
Midlands +7 649 £60,000 +20.00% 418
East of England +33 582 £62,500 +13.28% 291
East Midlands +12 350 £59,000 +32.76% 166
West Midlands -9 297 £62,500 +10.87% 231
South West +9 288 £60,000 +4.35% 378
Scotland +21 248 £62,750 +4.58% 267
Yorkshire -22 187 £69,018 +12.76% 288
Wales +10 91 £65,000 +10.54% 94
North East -19 65 £55,000 -11.08% 126
Northern Ireland -6 9 £60,000 +50.00% 65
Channel Islands - 1 £97,500 -
Mentoring
UK

Mentoring
Co-occurring Skills and Capabilities in the UK excluding London by Category

The follow tables expand on the table above by listing co-occurrences grouped by category. The same employment type, locality and period is covered with up to 20 co-occurrences shown in each of the following categories:

Application Platforms
1 74 (1.91%) SharePoint
2 39 (1.01%) Confluence
3 38 (0.98%) Microsoft Exchange
4 34 (0.88%) Apache
5 31 (0.80%) CMS
6 25 (0.65%) Jupyter
7 9 (0.23%) Apache Spark
8 6 (0.16%) Headless CMS
8 6 (0.16%) Umbraco
9 5 (0.13%) Adobe Experience Manager
10 4 (0.10%) ArcGIS
11 3 (0.078%) Apache Solr
11 3 (0.078%) IIS
11 3 (0.078%) OpenStack
11 3 (0.078%) Oracle SOA Suite
11 3 (0.078%) SAS
11 3 (0.078%) Sitecore CMS
12 2 (0.052%) Apache Airflow
12 2 (0.052%) Mendix
12 2 (0.052%) ThingWorx
Applications
1 144 (3.72%) Microsoft Office
2 43 (1.11%) Microsoft Excel
3 14 (0.36%) Microsoft PowerPoint
4 12 (0.31%) Simulink
5 9 (0.23%) Adobe Creative Suite
5 9 (0.23%) AutoCAD
5 9 (0.23%) MS Visio
6 7 (0.18%) Sketch
7 6 (0.16%) Adobe XD
8 5 (0.13%) Microsoft Project
8 5 (0.13%) Trello
9 4 (0.10%) Adobe Illustrator
10 3 (0.078%) Photoshop
11 2 (0.052%) GNU Octave
11 2 (0.052%) InDesign
11 2 (0.052%) Moqups
12 1 (0.026%) Chatbot
12 1 (0.026%) MicroStation
12 1 (0.026%) Revit
12 1 (0.026%) Spreadsheet
Business Applications
1 22 (0.57%) Dynamics AX
2 10 (0.26%) Oracle EBS
2 10 (0.26%) Salesforce CRM
3 9 (0.23%) Dynamics CRM
3 9 (0.23%) Oracle ERP
3 9 (0.23%) SAP S/4HANA
4 5 (0.13%) Oracle Applications
5 4 (0.10%) Magento
5 4 (0.10%) PeopleSoft HCM
6 3 (0.078%) NetSuite
6 3 (0.078%) Shopify
7 2 (0.052%) Payment Gateway
7 2 (0.052%) PeopleSoft Financials
7 2 (0.052%) Sprinklr
8 1 (0.026%) BASE24
8 1 (0.026%) Maximo
8 1 (0.026%) Ripple
8 1 (0.026%) Ripple XRP
8 1 (0.026%) SAP Business One
8 1 (0.026%) SAP MDM
Cloud Services
1 790 (20.43%) Azure
2 647 (16.74%) AWS
3 300 (7.76%) GCP
4 149 (3.85%) SaaS
5 121 (3.13%) Microsoft 365
6 117 (3.03%) Power Platform
7 97 (2.51%) Azure DevOps
8 65 (1.68%) GitHub
8 65 (1.68%) Pulumi
9 63 (1.63%) PaaS
10 56 (1.45%) Serverless
11 40 (1.03%) Entra ID
11 40 (1.03%) PowerApps
12 39 (1.01%) Power Automate
13 37 (0.96%) AWS Lambda
14 26 (0.67%) Cloud Computing
15 24 (0.62%) AWS CloudFormation
16 21 (0.54%) GitHub Actions
17 20 (0.52%) Amazon S3
18 19 (0.49%) Dynamics 365
Communications & Networking
1 741 (19.17%) Wi-Fi
2 733 (18.96%) 5G
3 730 (18.88%) Wireless
4 726 (18.78%) Bluetooth
5 723 (18.70%) GSM
6 721 (18.65%) LTE
6 721 (18.65%) UMTS
7 241 (6.23%) Broadband
8 117 (3.03%) VPN
9 105 (2.72%) Firewall
10 93 (2.41%) TCP/IP
11 81 (2.10%) Network Security
12 57 (1.47%) WAN
13 39 (1.01%) Internet
14 36 (0.93%) LAN
15 31 (0.80%) DNS
16 30 (0.78%) WLAN
17 22 (0.57%) SD-WAN
18 16 (0.41%) VSAT
19 13 (0.34%) Modbus
Database & Business Intelligence
1 180 (4.66%) SQL Server
2 134 (3.47%) NoSQL
3 110 (2.85%) Relational Database
4 98 (2.53%) Power BI
5 86 (2.22%) RDBMS
6 64 (1.66%) Big Data
6 64 (1.66%) Data Lake
6 64 (1.66%) Tableau
7 59 (1.53%) PostgreSQL
8 50 (1.29%) MongoDB
9 39 (1.01%) Data Warehouse
10 30 (0.78%) MySQL
11 27 (0.70%) Elasticsearch
12 16 (0.41%) Azure SQL Database
13 15 (0.39%) BigQuery
14 13 (0.34%) Amazon Redshift
15 12 (0.31%) Cloud Spanner
16 11 (0.28%) Amazon RDS
16 11 (0.28%) Metadata
16 11 (0.28%) SQL Server Integration Services
Development Applications
1 199 (5.15%) JIRA
2 177 (4.58%) Rational DOORS
3 157 (4.06%) Cucumber
4 130 (3.36%) GitLab
5 124 (3.21%) Selenium
6 117 (3.03%) Git
7 111 (2.87%) SonarQube
8 101 (2.61%) Bitbucket
9 98 (2.53%) Sonatype Nexus
10 92 (2.38%) Maven
11 65 (1.68%) Jaeger
12 62 (1.60%) Robot Framework
13 59 (1.53%) Jenkins
14 27 (0.70%) Visual Studio
15 26 (0.67%) Eclipse
16 25 (0.65%) Eclipse RCP
17 11 (0.28%) eggPlant
17 11 (0.28%) Oracle Forms
17 11 (0.28%) Postman
18 9 (0.23%) IBM UrbanCode
General
1 967 (25.01%) Social Skills
2 885 (22.89%) Electronics
3 680 (17.59%) Finance
4 652 (16.86%) Inclusion and Diversity
5 283 (7.32%) Retail
6 257 (6.65%) Analytical Skills
7 234 (6.05%) Banking
8 211 (5.46%) Manufacturing
9 202 (5.23%) Telecoms
10 149 (3.85%) Games
11 118 (3.05%) Marketing
12 111 (2.87%) Public Sector
13 103 (2.66%) Law
14 95 (2.46%) Investment Banking
14 95 (2.46%) Legal
15 90 (2.33%) Corporate Banking
16 67 (1.73%) Organisational Skills
17 58 (1.50%) Presentation Skills
18 36 (0.93%) Aerospace
19 30 (0.78%) Influencing Skills
Job Titles
1 1,048 (27.11%) Senior
2 808 (20.90%) Test Engineer
3 724 (18.73%) Electronics Engineer
4 721 (18.65%) Electronics Test Engineer
5 646 (16.71%) Lead
6 459 (11.87%) Software Engineer
7 270 (6.98%) Systems Engineer
8 258 (6.67%) Architect
9 244 (6.31%) Senior Software Engineer
10 176 (4.55%) Developer
11 156 (4.04%) Team Leader
12 148 (3.83%) Engineering Manager
13 134 (3.47%) Senior Systems Engineer
14 102 (2.64%) Senior Manager
15 96 (2.48%) Analyst
15 96 (2.48%) Senior Architect
16 84 (2.17%) Support Engineer
17 71 (1.84%) DevOps Engineer
17 71 (1.84%) IT Support
18 67 (1.73%) Systems Architect
Libraries, Frameworks & Software Standards
1 330 (8.54%) .NET
2 270 (6.98%) Node.js
3 224 (5.79%) React
4 192 (4.97%) HTML
5 188 (4.86%) CSS
6 144 (3.72%) Kafka
7 138 (3.57%) REST
8 132 (3.41%) RESTful
9 131 (3.39%) Spring Boot
10 129 (3.34%) Spring
11 104 (2.69%) Redux
12 102 (2.64%) Jest
13 97 (2.51%) HTML5
14 96 (2.48%) Sass
15 94 (2.43%) CSS3
16 90 (2.33%) JPA
17 71 (1.84%) Middleware
18 69 (1.78%) Elastic Stack
19 66 (1.71%) AngularJS
20 65 (1.68%) OpenTelemetry
Miscellaneous
1 811 (20.98%) Driving Licence
2 243 (6.29%) Linux Command Line
3 239 (6.18%) Self-Motivation
4 222 (5.74%) Management Information System
5 201 (5.20%) Cyberattack
6 189 (4.89%) Product Ownership
7 182 (4.71%) Algorithms
8 116 (3.00%) Enterprise Software
9 63 (1.63%) Robotics
10 58 (1.50%) Hybrid Cloud
11 55 (1.42%) Blockchain
12 52 (1.35%) e-Learning
12 52 (1.35%) Onboarding
13 49 (1.27%) Greenfield Project
14 48 (1.24%) Public Cloud
15 42 (1.09%) Cloud Native
16 40 (1.03%) Security Posture
17 38 (0.98%) SCADA
18 36 (0.93%) Social Media
19 34 (0.88%) IoT
Operating Systems
1 477 (12.34%) Linux
2 275 (7.11%) Windows
3 92 (2.38%) Unix
4 57 (1.47%) Windows Server
5 30 (0.78%) Apple iOS
6 16 (0.41%) Windows Server 2016
7 15 (0.39%) Windows Server 2019
8 13 (0.34%) Android
9 10 (0.26%) Mac OS
9 10 (0.26%) Windows 10
9 10 (0.26%) Windows Vista
10 8 (0.21%) Red Hat Enterprise Linux
11 5 (0.13%) VMS
12 3 (0.078%) CentOS
13 2 (0.052%) Debian
13 2 (0.052%) Oracle Linux
13 2 (0.052%) Ubuntu
13 2 (0.052%) Windows Server 2012
14 1 (0.026%) Embedded Linux
14 1 (0.026%) zOS
Processes & Methodologies
1 1,525 (39.45%) Coaching
2 1,104 (28.56%) Agile
3 804 (20.80%) Customer Requirements
4 797 (20.62%) Problem-Solving
5 794 (20.54%) Validation
6 733 (18.96%) Test Strategy
7 730 (18.88%) Verification and Validation
8 678 (17.54%) Software Engineering
9 586 (15.16%) DevOps
10 442 (11.43%) Roadmaps
11 432 (11.17%) Microservices
12 404 (10.45%) Computer Science
13 378 (9.78%) CI/CD
14 370 (9.57%) Project Management
15 344 (8.90%) Test Automation
16 330 (8.54%) User Experience
17 324 (8.38%) Continuous Improvement
18 317 (8.20%) Technical Leadership
19 290 (7.50%) Analytics
19 290 (7.50%) Scrum
Programming Languages
1 613 (15.86%) JavaScript
2 564 (14.59%) Python
3 534 (13.81%) Java
4 372 (9.62%) SQL
5 253 (6.54%) Go
6 249 (6.44%) C++
7 238 (6.16%) TypeScript
8 214 (5.54%) C#
9 197 (5.10%) Rust
10 167 (4.32%) Bash
11 155 (4.01%) PowerShell
12 145 (3.75%) R
13 66 (1.71%) C
14 52 (1.35%) PHP
15 28 (0.72%) Ada
16 12 (0.31%) Bicep
17 11 (0.28%) T-SQL
18 9 (0.23%) PL/SQL
18 9 (0.23%) Scala
18 9 (0.23%) Shell Script
Qualifications
1 1,807 (46.74%) Degree
2 734 (18.99%) HND
3 522 (13.50%) BPSS Clearance
4 329 (8.51%) Security Cleared
5 311 (8.04%) Computer Science Degree
6 251 (6.49%) AWS Certification
7 229 (5.92%) DV Cleared
8 195 (5.04%) Chartered Engineer
9 177 (4.58%) AWS Certified Solutions Architect
10 173 (4.47%) AWS Certified Developer
11 114 (2.95%) CISSP
12 79 (2.04%) SC Cleared
13 78 (2.02%) Cisco Certification
13 78 (2.02%) Microsoft Certification
14 73 (1.89%) CCNA
15 56 (1.45%) Master's Degree
16 54 (1.40%) CCNP
17 43 (1.11%) CISM
18 39 (1.01%) Azure Certification
19 38 (0.98%) MCSE
Quality Assurance & Compliance
1 340 (8.79%) QA
2 175 (4.53%) ISO/IEC 15288
3 133 (3.44%) Accessibility
4 91 (2.35%) Data Quality
5 81 (2.10%) ISO/IEC 27001
6 49 (1.27%) NIST
7 45 (1.16%) ITGC
8 40 (1.03%) GDPR
9 35 (0.91%) ISO/IEC 12207
9 35 (0.91%) NCSC
10 28 (0.72%) PMO
11 24 (0.62%) Cyber Essentials
12 17 (0.44%) SLA
12 17 (0.44%) SOC 2
13 11 (0.28%) Cyber Essentials PLUS
13 11 (0.28%) Sarbanes-Oxley
14 10 (0.26%) PCI DSS
15 8 (0.21%) ISO 9001
16 7 (0.18%) ISO/IEC 27002 (supersedes ISO/IEC 17799)
17 6 (0.16%) PMBOK
System Software
1 331 (8.56%) Docker
2 91 (2.35%) Active Directory
3 42 (1.09%) VMware Infrastructure
4 33 (0.85%) Firmware
5 22 (0.57%) Hyper-V
6 15 (0.39%) Embedded Firmware
6 15 (0.39%) XenApp
7 14 (0.36%) Virtual Machines
8 12 (0.31%) Virtual Desktop
9 5 (0.13%) VMware NSX
10 3 (0.078%) vSphere
11 2 (0.052%) Virtual Servers
12 1 (0.026%) HDFS
12 1 (0.026%) KVM
12 1 (0.026%) Oracle RAC
12 1 (0.026%) Snort
Systems Management
1 341 (8.82%) Kubernetes
2 169 (4.37%) Terraform
3 113 (2.92%) Ansible
4 78 (2.02%) Prometheus
5 69 (1.78%) Argo
6 65 (1.68%) Kustomize
7 37 (0.96%) Microsoft Intune
8 15 (0.39%) Progress Chef
9 14 (0.36%) Grafana
10 13 (0.34%) SCCM
11 11 (0.28%) Puppet
12 8 (0.21%) Proxmox
13 7 (0.18%) CASB
14 6 (0.16%) CA Endevor
15 5 (0.13%) Kibana
16 4 (0.10%) Single Sign-On
17 3 (0.078%) QRadar
18 2 (0.052%) Jamf Pro
18 2 (0.052%) Nmap
18 2 (0.052%) WMI
Vendors
1 382 (9.88%) Microsoft
2 233 (6.03%) IBM
3 136 (3.52%) Google
4 96 (2.48%) Oracle
5 95 (2.46%) Cisco
6 90 (2.33%) Solace
7 70 (1.81%) BT
8 59 (1.53%) Databricks
8 59 (1.53%) VMware
9 55 (1.42%) Red Hat
10 53 (1.37%) ServiceNow
11 44 (1.14%) SAP
12 36 (0.93%) Salesforce
13 22 (0.57%) Adobe
13 22 (0.57%) Citrix
13 22 (0.57%) Meraki
14 18 (0.47%) Okta
15 17 (0.44%) CheckPoint
15 17 (0.44%) Informatica
16 16 (0.41%) Commvault