Budget Management Jobs

Budget Management
UK

The table below provides summary statistics for permanent job vacancies requiring Budget Management skills. It includes a benchmarking guide to the annual salaries offered in vacancies that cited Budget Management over the 6 months leading up to 8 December 2024, comparing them to the same period in the previous two years.

6 months to
8 Dec 2024
Same period 2023 Same period 2022
Rank 262 336 402
Rank change year-on-year +74 +66 -22
Permanent jobs citing Budget Management 760 480 983
As % of all permanent jobs advertised in the UK 1.10% 0.91% 0.80%
As % of the Processes & Methodologies category 1.24% 0.96% 0.84%
Number of salaries quoted 322 372 673
10th Percentile £41,275 £40,750 £40,000
25th Percentile £51,250 £51,250 £47,500
Median annual salary (50th Percentile) £65,000 £70,000 £60,000
Median % change year-on-year -7.14% +16.67% -
75th Percentile £80,000 £88,000 £75,000
90th Percentile £98,625 £115,000 £90,000
UK excluding London median annual salary £60,850 £60,000 £57,500
% change year-on-year +1.42% +4.35% +2.68%

All Process and Methodology Skills
UK

Budget Management falls under the Processes and Methodologies category. For comparison with the information above, the following table provides summary statistics for all permanent job vacancies requiring process or methodology skills.

Permanent vacancies with a requirement for process or methodology skills 61,487 49,863 117,613
As % of all permanent jobs advertised in the UK 88.65% 94.11% 95.75%
Number of salaries quoted 28,400 36,022 72,003
10th Percentile £35,000 £32,500 £34,700
25th Percentile £45,000 £43,750 £45,000
Median annual salary (50th Percentile) £60,000 £60,000 £61,000
Median % change year-on-year - -1.64% +1.67%
75th Percentile £78,750 £80,000 £82,500
90th Percentile £97,500 £99,680 £100,000
UK excluding London median annual salary £54,714 £52,500 £53,500
% change year-on-year +4.22% -1.87% +7.00%

Budget Management
Job Vacancy Trend

Job postings citing Budget Management as a proportion of all IT jobs advertised.
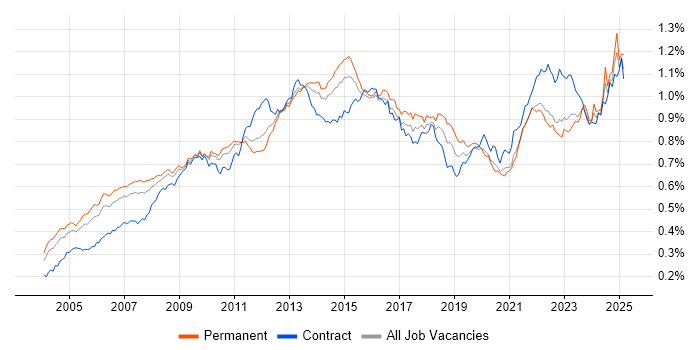
Job vacancy trend for Budget Management in the UK

Budget Management
Salary Trend

3-month moving average salary quoted in jobs citing Budget Management.

Salary trend for Budget Management in the UK

Budget Management
Salary Histogram

Salary distribution for jobs citing Budget Management over the 6 months to 8 December 2024.

Salary histogram for Budget Management in the UK

Budget Management
Top 17 Job Locations

The table below looks at the demand and provides a guide to the median salaries quoted in IT jobs citing Budget Management within the UK over the 6 months to 8 December 2024. The 'Rank Change' column provides an indication of the change in demand within each location based on the same 6 month period last year.

Location Rank Change
on Same Period
Last Year
Matching
Permanent
IT Job Ads
Median Salary
Past 6 Months
Median Salary
% Change
on Same Period
Last Year
Live
Jobs
England +80 710 £65,000 -7.14% 290
UK excluding London +61 496 £60,850 +1.42% 166
London +37 247 £83,750 +11.67% 137
Work from Home -6 177 £60,000 -14.29% 188
South East +43 143 £64,250 +38.92% 31
Midlands +6 108 £60,000 -18.64% 42
North of England -8 92 £59,000 -7.81% 41
West Midlands 0 74 £60,001 -17.24% 28
East of England -1 72 £70,000 -17.65% 23
North West -29 54 £57,500 -13.21% 24
South West +12 48 £51,000 -2.86% 13
East Midlands -17 34 £60,000 -21.31% 14
Yorkshire +19 26 £65,000 +4.00% 16
Scotland -24 15 £44,000 -23.48% 8
North East -23 12 £58,750 +1.73% 3
Wales +18 11 £50,000 -23.66% 9
Northern Ireland +22 8 £67,500 +11.57% 2

Budget Management
Co-occurring Skills and Capabilities by Category

The follow tables expand on the table above by listing co-occurrences grouped by category. The same employment type, locality and period is covered with up to 20 co-occurrences shown in each of the following categories:

Application Platforms
1 23 (3.03%) CMS
2 17 (2.24%) SharePoint
3 12 (1.58%) Microsoft Exchange
4 6 (0.79%) SAS
4 6 (0.79%) WordPress
5 4 (0.53%) Apache
5 4 (0.53%) nginx
6 3 (0.39%) IBM Notes
7 2 (0.26%) Confluence
8 1 (0.13%) Exchange Server 2013
Applications
1 53 (6.97%) Microsoft Project
2 44 (5.79%) Microsoft Excel
2 44 (5.79%) Microsoft Office
3 40 (5.26%) Microsoft PowerPoint
4 8 (1.05%) InDesign
5 7 (0.92%) Trello
6 5 (0.66%) MS Visio
7 4 (0.53%) Adobe Illustrator
7 4 (0.53%) Adobe Premiere
7 4 (0.53%) Photoshop
8 3 (0.39%) Adobe Creative Suite
9 1 (0.13%) Chatbot
Business Applications
1 14 (1.84%) SAP ERP
2 9 (1.18%) Salesforce CRM
2 9 (1.18%) SAP SD
3 7 (0.92%) NetSuite
4 6 (0.79%) SAP S/4HANA
5 5 (0.66%) Dynamics CRM
6 4 (0.53%) Maximo
6 4 (0.53%) NEC Housing
7 2 (0.26%) Oracle Assets
7 2 (0.26%) SAP MDM
7 2 (0.26%) SAP PM
7 2 (0.26%) Summit
8 1 (0.13%) Distributed Ledger
8 1 (0.13%) Finacle
8 1 (0.13%) Magento
8 1 (0.13%) Oracle ERP
8 1 (0.13%) Shopify
Cloud Services
1 69 (9.08%) Azure
2 44 (5.79%) Microsoft 365
3 25 (3.29%) SaaS
4 24 (3.16%) Power Platform
5 21 (2.76%) AWS
6 18 (2.37%) Cloud Computing
7 12 (1.58%) Azure Synapse Analytics
8 9 (1.18%) Asana
8 9 (1.18%) Google Workspace
9 8 (1.05%) Azure Data Factory
9 8 (1.05%) Entra ID
9 8 (1.05%) Google Analytics
10 4 (0.53%) Contentful
10 4 (0.53%) Google Ads
10 4 (0.53%) MailChimp
10 4 (0.53%) Microsoft Purview
10 4 (0.53%) Smartsheet
10 4 (0.53%) Snowflake
11 3 (0.39%) Siteimprove
11 3 (0.39%) WhatsApp
Communications & Networking
1 36 (4.74%) DNS
2 35 (4.61%) DHCP
3 28 (3.68%) Wi-Fi
4 25 (3.29%) Broadband
5 21 (2.76%) Unified Communications
6 19 (2.50%) Structured Cabling
7 15 (1.97%) Internet
8 11 (1.45%) Wireless
9 10 (1.32%) LAN
10 9 (1.18%) Firewall
10 9 (1.18%) Network Security
10 9 (1.18%) VPN
11 8 (1.05%) HTTPS
11 8 (1.05%) Intranet
12 7 (0.92%) WAN
13 4 (0.53%) Cisco IOS
13 4 (0.53%) MQTT
13 4 (0.53%) VLAN
14 3 (0.39%) DWDM
14 3 (0.39%) SDH
Database & Business Intelligence
1 18 (2.37%) Power BI
2 12 (1.58%) Relational Database
3 6 (0.79%) Data Warehouse
4 5 (0.66%) Tableau
5 4 (0.53%) Data Lake
5 4 (0.53%) Data Mining
5 4 (0.53%) MySQL
6 3 (0.39%) Looker
6 3 (0.39%) SQL Server
7 2 (0.26%) Big Data
7 2 (0.26%) Geospatial Data
7 2 (0.26%) SAP HANA
8 1 (0.13%) Amazon Redshift
8 1 (0.13%) BusinessObjects
8 1 (0.13%) Electronic Patient Records
8 1 (0.13%) GIS
8 1 (0.13%) RDBMS
8 1 (0.13%) SQL Server Integration Services
8 1 (0.13%) SQL Server Reporting Services
Development Applications
1 17 (2.24%) JIRA
2 1 (0.13%) Git
General
1 325 (42.76%) Finance
2 292 (38.42%) Social Skills
3 141 (18.55%) Manufacturing
4 121 (15.92%) Analytical Skills
5 86 (11.32%) Retail
6 72 (9.47%) Marketing
7 61 (8.03%) Legal
8 55 (7.24%) Inclusion and Diversity
9 34 (4.47%) Public Sector
10 27 (3.55%) Law
11 24 (3.16%) Organisational Skills
12 23 (3.03%) Telecoms
13 18 (2.37%) Presentation Skills
14 16 (2.11%) Influencing Skills
15 14 (1.84%) Local Government
16 10 (1.32%) Aerospace
16 10 (1.32%) Automotive
17 9 (1.18%) Advertising
18 6 (0.79%) Banking
18 6 (0.79%) Military
Job Titles
1 332 (43.68%) Project Manager
2 129 (16.97%) IT Manager
3 88 (11.58%) Senior
4 74 (9.74%) Senior Manager
5 54 (7.11%) Senior Project Manager
6 44 (5.79%) Programme Manager
7 32 (4.21%) IT Project Manager
8 31 (4.08%) Lead
9 24 (3.16%) IT Programme Manager
10 22 (2.89%) Head of IT
11 19 (2.50%) Principal Project Manager
11 19 (2.50%) Service Manager
12 16 (2.11%) Systems Manager
13 15 (1.97%) Infrastructure Manager
14 14 (1.84%) Architect
14 14 (1.84%) Head of Projects
14 14 (1.84%) Senior IT Manager
15 12 (1.58%) Analyst
15 12 (1.58%) Consultant
15 12 (1.58%) Delivery Manager
Libraries, Frameworks & Software Standards
1 19 (2.50%) CSS
1 19 (2.50%) HTML
2 11 (1.45%) React
3 9 (1.18%) Middleware
3 9 (1.18%) Web Services
4 8 (1.05%) REST
5 4 (0.53%) .NET
5 4 (0.53%) Node-RED
6 2 (0.26%) Symfony
7 1 (0.13%) ADO
7 1 (0.13%) EDI
7 1 (0.13%) Laravel
7 1 (0.13%) Smart Contracts
Miscellaneous
1 98 (12.89%) Driving Licence
2 78 (10.26%) Management Information System
3 26 (3.42%) Data Centre
3 26 (3.42%) Self-Motivation
4 21 (2.76%) Social Media
5 19 (2.50%) FMCG
5 19 (2.50%) Video Conferencing
6 15 (1.97%) PMI
7 14 (1.84%) IoT
7 14 (1.84%) Product Ownership
8 13 (1.71%) NHS
9 10 (1.32%) Data Protection Act
10 9 (1.18%) Cyber Threat
10 9 (1.18%) Onboarding
11 8 (1.05%) Digital Media
12 7 (0.92%) Data Structures
13 6 (0.79%) Enterprise Software
13 6 (0.79%) Greenfield Project
13 6 (0.79%) Hybrid Cloud
14 5 (0.66%) Blog
Operating Systems
1 28 (3.68%) Windows
2 19 (2.50%) Linux
3 14 (1.84%) Windows Server
4 10 (1.32%) Unix
5 5 (0.66%) Mac OS
6 4 (0.53%) Windows 10
7 3 (0.39%) Android
7 3 (0.39%) Apple iOS
8 2 (0.26%) Windows Server 2016
8 2 (0.26%) Windows Server 2019
9 1 (0.13%) Solaris
9 1 (0.13%) Windows Server 2012
9 1 (0.13%) Windows Vista
Processes & Methodologies
1 359 (47.24%) Project Management
2 200 (26.32%) Continuous Improvement
3 175 (23.03%) Stakeholder Management
4 163 (21.45%) Problem-Solving
5 141 (18.55%) Project Delivery
6 122 (16.05%) Risk Management
7 115 (15.13%) Agile
8 92 (12.11%) PRINCE2
9 91 (11.97%) Budgeting
10 75 (9.87%) Project Planning
11 71 (9.34%) Roadmaps
12 69 (9.08%) Resource Allocation
13 67 (8.82%) Cybersecurity
14 65 (8.55%) Coaching
15 64 (8.42%) Budgeting and Forecasting
15 64 (8.42%) Computer Science
16 63 (8.29%) Strategic Planning
17 62 (8.16%) Mentoring
18 57 (7.50%) Decision-Making
19 55 (7.24%) ITIL
Programming Languages
1 36 (4.74%) SQL
2 30 (3.95%) Python
3 22 (2.89%) JavaScript
4 13 (1.71%) PowerShell
5 12 (1.58%) PHP
6 9 (1.18%) Bash
7 8 (1.05%) Data Analysis Expressions
8 2 (0.26%) C#
8 2 (0.26%) Java
8 2 (0.26%) R
9 1 (0.13%) PL/SQL
9 1 (0.13%) Scala
9 1 (0.13%) VB.NET
9 1 (0.13%) VBA
Qualifications
1 181 (23.82%) Degree
2 82 (10.79%) NVQ Level 3
3 56 (7.37%) PMI Certification
4 55 (7.24%) PMP
5 34 (4.47%) Computer Science Degree
6 26 (3.42%) Master's Degree
7 19 (2.50%) RIBA
8 16 (2.11%) DBS Check
9 15 (1.97%) CISSP
10 12 (1.58%) Security Cleared
11 10 (1.32%) CISA
11 10 (1.32%) PRINCE2 Certification
12 9 (1.18%) PRINCE2 Practitioner
13 7 (0.92%) Cisco Certification
14 6 (0.79%) Azure Certification
15 5 (0.66%) CCNA
15 5 (0.66%) CCNP
15 5 (0.66%) MBA
15 5 (0.66%) SC Cleared
16 4 (0.53%) ACSP
Quality Assurance & Compliance
1 53 (6.97%) QA
2 43 (5.66%) GDPR
3 40 (5.26%) SLA
4 31 (4.08%) PMO
5 29 (3.82%) ISO/IEC 27001
6 23 (3.03%) Cyber Essentials
7 18 (2.37%) Cyber Essentials PLUS
8 13 (1.71%) Accessibility
9 11 (1.45%) NIST
9 11 (1.45%) PCI DSS
10 6 (0.79%) COBIT
11 5 (0.66%) Data Quality
12 4 (0.53%) PERC
12 4 (0.53%) WCAG
13 2 (0.26%) ISO/IEC 19770
13 2 (0.26%) ITGC
14 1 (0.13%) Disclosure Scotland
14 1 (0.13%) MiFID
14 1 (0.13%) PMBOK
14 1 (0.13%) PSD2
System Software
1 24 (3.16%) Active Directory
2 12 (1.58%) Hyper-V
3 11 (1.45%) VMware Infrastructure
3 11 (1.45%) vSphere
4 4 (0.53%) Virtual Machines
5 2 (0.26%) VMware ESXi
5 2 (0.26%) XenApp
5 2 (0.26%) XenDesktop
6 1 (0.13%) Docker
6 1 (0.13%) KVM
Systems Management
1 4 (0.53%) Grafana
1 4 (0.53%) Jamf Pro
1 4 (0.53%) WSUS
2 3 (0.39%) SCCM
3 2 (0.26%) Terraform
3 2 (0.26%) vCenter Server
4 1 (0.13%) Autotask
4 1 (0.13%) Cisco UCCE
4 1 (0.13%) Cisco UCCX
4 1 (0.13%) Kubernetes
4 1 (0.13%) Microsoft Intune
Vendors
1 155 (20.39%) Microsoft
2 39 (5.13%) SAP
3 31 (4.08%) NEC
3 31 (4.08%) Oracle
4 24 (3.16%) Salesforce
5 21 (2.76%) Planview
6 19 (2.50%) Google
7 18 (2.37%) Cisco
7 18 (2.37%) VMware
8 12 (1.58%) Veeam
9 9 (1.18%) Adobe
9 9 (1.18%) Databricks
9 9 (1.18%) Nimble Storage
9 9 (1.18%) SolarWinds
9 9 (1.18%) Splunk
9 9 (1.18%) Zscaler
10 8 (1.05%) Facebook
10 8 (1.05%) Siemens
11 7 (0.92%) Epicor
11 7 (0.92%) Sage