Technology Roadmaps
UK

The following table provides summary statistics for permanent job vacancies with a requirement for Technology Roadmap skills. Included is a benchmarking guide to the salaries offered in vacancies that have cited Technology Roadmap over the 6 months to 4 December 2023 with a comparison to the same period in the previous 2 years.

6 months to
4 Dec 2023
Same period 2022 Same period 2021
Rank 284 245 325
Rank change year-on-year -39 +80 -22
Permanent jobs citing Technology Roadmap 616 1,851 1,447
As % of all permanent jobs advertised in the UK 1.16% 1.49% 1.13%
As % of the Processes & Methodologies category 1.23% 1.56% 1.18%
Number of salaries quoted 455 1,078 949
10th Percentile £45,250 £38,999 £46,100
25th Percentile £58,750 £56,250 £58,750
Median annual salary (50th Percentile) £77,500 £70,000 £80,000
Median % change year-on-year +10.71% -12.50% +18.52%
75th Percentile £111,250 £97,328 £112,500
90th Percentile £130,000 £117,500 -
UK excluding London median annual salary £67,500 £65,000 £70,000
% change year-on-year +3.85% -7.14% +16.67%

All Process and Methodology Skills
UK

Technology Roadmap is in the Processes and Methodologies category. The following table is for comparison with the above and provides summary statistics for all permanent job vacancies with a requirement for process or methodology skills.

Permanent vacancies with a requirement for process or methodology skills 50,088 118,671 122,416
As % of all permanent jobs advertised in the UK 94.09% 95.74% 95.45%
Number of salaries quoted 36,209 72,079 81,851
10th Percentile £32,500 £34,492 £32,500
25th Percentile £43,750 £45,000 £42,500
Median annual salary (50th Percentile) £60,000 £60,000 £60,000
Median % change year-on-year - - +9.09%
75th Percentile £80,000 £82,000 £77,500
90th Percentile £99,025 £100,000 £95,000
UK excluding London median annual salary £52,500 £53,219 £50,000
% change year-on-year -1.35% +6.44% +4.17%

Technology Roadmap
Job Vacancy Trend

Job postings citing Technology Roadmap as a proportion of all IT jobs advertised.
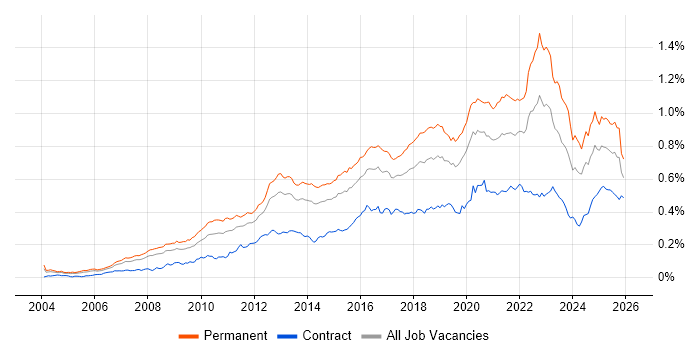
Job vacancy trend for Technology Roadmap in the UK

Technology Roadmap
Salary Trend

3-month moving average salary quoted in jobs citing Technology Roadmap.

Salary trend for Technology Roadmap in the UK

Technology Roadmap
Salary Histogram

Salary distribution for jobs citing Technology Roadmap over the 6 months to 4 December 2023.

Salary histogram for Technology Roadmap in the UK

Technology Roadmap
Top 17 Job Locations

The table below looks at the demand and provides a guide to the median salaries quoted in IT jobs citing Technology Roadmap within the UK over the 6 months to 4 December 2023. The 'Rank Change' column provides an indication of the change in demand within each location based on the same 6 month period last year.

Location Rank Change
on Same Period
Last Year
Matching
Permanent
IT Job Ads
Median Salary
Past 6 Months
Median Salary
% Change
on Same Period
Last Year
Live
Jobs
England -15 552 £80,000 +10.34% 224
UK excluding London -63 349 £67,500 +3.85% 147
London +49 231 £102,500 +17.14% 88
Work from Home -87 227 £80,000 +6.67% 95
North of England +6 97 £67,500 +3.85% 39
South East -3 78 £70,000 +3.70% 37
South West 0 70 £61,000 +1.67% 13
Midlands +89 56 £60,000 -7.69% 26
North West +21 56 £73,900 +17.30% 18
Yorkshire +19 39 £65,351 -5.90% 11
West Midlands +113 31 £65,000 +9.96% 20
East Midlands +26 25 £60,000 -11.11% 6
Scotland -73 24 £81,112 +21.45% 4
East of England +62 21 £122,500 +147.47% 26
Northern Ireland +26 5 £70,000 +78.02%
North East +40 4 £122,500 +211.53% 10
Wales -22 4 £66,250 +10.42% 3

Technology Roadmap
Co-occurring Skills and Capabilities by Category

The follow tables expand on the table above by listing co-occurrences grouped by category. The same employment type, locality and period is covered with up to 20 co-occurrences shown in each of the following categories:

Application Platforms
1 29 (4.71%) SharePoint
2 6 (0.97%) Confluence
3 4 (0.65%) SharePoint 2010
3 4 (0.65%) SharePoint 2013
4 3 (0.49%) WebLogic
5 2 (0.32%) Apache
5 2 (0.32%) CMS
5 2 (0.32%) Drupal
5 2 (0.32%) Oracle Workflow
6 1 (0.16%) IIS
6 1 (0.16%) JBoss
6 1 (0.16%) NetWeaver
6 1 (0.16%) nginx
6 1 (0.16%) OpenEdge
6 1 (0.16%) Tomcat
Applications
1 28 (4.55%) Microsoft Office
2 7 (1.14%) Simulink
3 6 (0.97%) Microsoft PowerPoint
4 4 (0.65%) AutoCAD
5 3 (0.49%) Microsoft Excel
6 2 (0.32%) Mathcad
7 1 (0.16%) CANalyzer
7 1 (0.16%) Chatbot
Business Applications
1 6 (0.97%) SAP Business One
2 5 (0.81%) SAP S/4HANA
3 4 (0.65%) Maximo
4 3 (0.49%) SAP CO
4 3 (0.49%) SAP FI
4 3 (0.49%) SAP FI/CO
5 2 (0.32%) Dynamics CRM
6 1 (0.16%) Adobe Campaign
6 1 (0.16%) Distributed Ledger
6 1 (0.16%) Loan IQ
6 1 (0.16%) Remedy ITSM
6 1 (0.16%) SAP ERP
Cloud Services
1 165 (26.79%) Azure
2 148 (24.03%) AWS
3 87 (14.12%) GCP
4 73 (11.85%) Microsoft 365
5 48 (7.79%) SaaS
6 35 (5.68%) PaaS
7 29 (4.71%) AWS CloudFormation
7 29 (4.71%) Entra ID
8 26 (4.22%) IaaS
9 24 (3.90%) Azure DevOps
10 20 (3.25%) Azure Sentinel
11 15 (2.44%) Azure Functions
11 15 (2.44%) Power Platform
11 15 (2.44%) Serverless
12 10 (1.62%) AWS CodePipeline
12 10 (1.62%) Azure ExpressRoute
12 10 (1.62%) GitHub
13 8 (1.30%) Azure API Management
14 7 (1.14%) Azure Cosmos DB
15 6 (0.97%) dbt
Communications & Networking
1 42 (6.82%) DNS
2 40 (6.49%) DHCP
3 32 (5.19%) TCP/IP
4 29 (4.71%) HTTP
5 22 (3.57%) WAN
6 21 (3.41%) Firewall
7 17 (2.76%) LAN
8 15 (2.44%) Network Security
9 14 (2.27%) SAN
10 12 (1.95%) Internet
10 12 (1.95%) VPN
11 11 (1.79%) SD-WAN
11 11 (1.79%) Wi-Fi
11 11 (1.79%) Wireless
12 6 (0.97%) MPLS
13 5 (0.81%) Remote Desktop
14 3 (0.49%) BGP
14 3 (0.49%) OSPF
14 3 (0.49%) VLAN
15 2 (0.32%) Wireshark
Database & Business Intelligence
1 17 (2.76%) SQL Server
2 15 (2.44%) Data Warehouse
3 11 (1.79%) NoSQL
3 11 (1.79%) Power BI
4 8 (1.30%) MongoDB
4 8 (1.30%) Relational Database
5 7 (1.14%) Elasticsearch
6 6 (0.97%) DataStage
6 6 (0.97%) IBM InfoSphere
6 6 (0.97%) MySQL
7 4 (0.65%) Tableau
8 3 (0.49%) Amazon RDS
8 3 (0.49%) Metadata
9 2 (0.32%) Apache Ignite
9 2 (0.32%) Azure SQL Database
9 2 (0.32%) Data Lake
9 2 (0.32%) Flink
9 2 (0.32%) GIS
9 2 (0.32%) SQL Server Reporting Services
10 1 (0.16%) SQL Server Integration Services
Development Applications
1 26 (4.22%) Git
2 22 (3.57%) Cypress.io
3 18 (2.92%) JIRA
4 4 (0.65%) Jenkins
4 4 (0.65%) Team Foundation Server
5 3 (0.49%) JUnit
6 2 (0.32%) Artifactory
6 2 (0.32%) Bitbucket
6 2 (0.32%) ERwin
6 2 (0.32%) Visual Studio Team System
7 1 (0.16%) Cucumber
7 1 (0.16%) DbUnit
7 1 (0.16%) jMock
7 1 (0.16%) Maven
7 1 (0.16%) Mockito
7 1 (0.16%) MSI
7 1 (0.16%) Selenium
7 1 (0.16%) SoapUI
7 1 (0.16%) SpecFlow
7 1 (0.16%) TestNG
General
1 226 (36.69%) Finance
2 170 (27.60%) Social Skills
3 70 (11.36%) Banking
4 53 (8.60%) Inclusion and Diversity
5 48 (7.79%) Retail
6 42 (6.82%) Analytical Skills
7 27 (4.38%) Front Office
8 19 (3.08%) Automotive
8 19 (3.08%) Presentation Skills
9 16 (2.60%) Influencing Skills
10 14 (2.27%) Back Office
11 13 (2.11%) Law
12 12 (1.95%) Organisational Skills
12 12 (1.95%) Publishing
12 12 (1.95%) Telecoms
13 10 (1.62%) Manufacturing
13 10 (1.62%) Marketing
13 10 (1.62%) Public Sector
14 9 (1.46%) Billing
14 9 (1.46%) Legal
Job Titles
1 164 (26.62%) Architect
2 101 (16.40%) Lead
3 93 (15.10%) Senior
4 77 (12.50%) Solutions Architect
5 46 (7.47%) Software Engineer
6 45 (7.31%) Developer
7 41 (6.66%) Cloud Engineer
8 38 (6.17%) Senior Architect
9 33 (5.36%) IT Manager
10 30 (4.87%) Product Manager
11 27 (4.38%) Infrastructure Architect
12 25 (4.06%) Full Stack Developer
13 24 (3.90%) Infrastructure Engineer
14 22 (3.57%) Developer/Software Engineer
14 22 (3.57%) Full Stack Engineer
14 22 (3.57%) Principal Engineer
14 22 (3.57%) Python Developer
14 22 (3.57%) Python Engineer
14 22 (3.57%) Python Software Engineer
14 22 (3.57%) React Developer
Libraries, Frameworks & Software Standards
1 54 (8.77%) React
2 53 (8.60%) Node.js
3 43 (6.98%) HTML
4 38 (6.17%) .NET
5 33 (5.36%) SAML
6 31 (5.03%) OpenID
6 31 (5.03%) Redux
7 21 (3.41%) JSON
8 19 (3.08%) RESTful
9 16 (2.60%) AngularJS
9 16 (2.60%) YAML
10 15 (2.44%) Middleware
11 13 (2.11%) CSS
11 13 (2.11%) Kafka
12 11 (1.79%) REST
13 10 (1.62%) .NET Framework
13 10 (1.62%) ARM Templates
13 10 (1.62%) Azure Blueprints
13 10 (1.62%) Spring
14 8 (1.30%) Web Services
Miscellaneous
1 54 (8.77%) Cloud Native
2 46 (7.47%) Public Cloud
3 44 (7.14%) Data Centre
4 41 (6.66%) Product Ownership
5 33 (5.36%) Cyberattack
6 27 (4.38%) Fixed Income
7 19 (3.08%) Management Information System
8 17 (2.76%) Self-Motivation
9 16 (2.60%) Linux Command Line
9 16 (2.60%) Replication
9 16 (2.60%) Virtual Team
10 15 (2.44%) Hybrid Cloud
11 13 (2.11%) Enterprise Software
12 11 (1.79%) Blockchain
12 11 (1.79%) CMDB
12 11 (1.79%) Mainframe
13 10 (1.62%) Culture of Ownership
14 9 (1.46%) PKI
15 6 (0.97%) Algorithms
15 6 (0.97%) Derivative
Operating Systems
1 61 (9.90%) Windows
2 39 (6.33%) Linux
3 19 (3.08%) Windows Server
4 12 (1.95%) HPUX
4 12 (1.95%) Red Hat Enterprise Linux
5 11 (1.79%) Solaris
6 7 (1.14%) Apple iOS
7 5 (0.81%) CentOS
8 4 (0.65%) Mac OS
8 4 (0.65%) Windows Server 2012
9 3 (0.49%) Android
10 2 (0.32%) Unix
10 2 (0.32%) Windows 10
11 1 (0.16%) Debian
11 1 (0.16%) Mac OS X
11 1 (0.16%) Ubuntu
Processes & Methodologies
1 616 (100.00%) Roadmaps
2 251 (40.75%) Agile
3 121 (19.64%) DevOps
4 107 (17.37%) Technical Leadership
5 106 (17.21%) Mentoring
6 95 (15.42%) Problem-Solving
7 91 (14.77%) Stakeholder Management
8 85 (13.80%) IT Strategy
9 84 (13.64%) Software Engineering
10 77 (12.50%) ITIL
11 73 (11.85%) Infrastructure as Code
12 72 (11.69%) Line Management
12 72 (11.69%) Technology Strategy
13 66 (10.71%) Cloud Security
13 66 (10.71%) Continuous Improvement
14 60 (9.74%) TOGAF
15 55 (8.93%) Coaching
16 51 (8.28%) Technical Debt
17 50 (8.12%) Full Stack Development
17 50 (8.12%) SDLC
Programming Languages
1 76 (12.34%) Python
2 51 (8.28%) JavaScript
2 51 (8.28%) TypeScript
3 50 (8.12%) PowerShell
4 41 (6.66%) Bash
5 37 (6.01%) C#
6 33 (5.36%) Java
7 31 (5.03%) SQL
8 13 (2.11%) MATLAB
9 11 (1.79%) Bicep
10 8 (1.30%) PHP
11 7 (1.14%) C++
12 3 (0.49%) C
13 2 (0.32%) Go
13 2 (0.32%) Kotlin
13 2 (0.32%) Shell Script
14 1 (0.16%) ABAP
14 1 (0.16%) Delphi
14 1 (0.16%) PL/SQL
Qualifications
1 85 (13.80%) Degree
2 51 (8.28%) Security Cleared
3 36 (5.84%) Azure Certification
4 35 (5.68%) DV Cleared
5 34 (5.52%) AWS Certification
6 31 (5.03%) Computer Science Degree
7 29 (4.71%) AWS Certified Solutions Architect
8 17 (2.76%) SC Cleared
9 16 (2.60%) HNC
10 12 (1.95%) Cisco Certification
11 9 (1.46%) ITIL Certification
12 8 (1.30%) CCNA
12 8 (1.30%) CISSP
13 7 (1.14%) CCNP
13 7 (1.14%) TOGAF Certification
14 6 (0.97%) CISM
14 6 (0.97%) Microsoft Certification
15 4 (0.65%) ISACA
15 4 (0.65%) ISSAP
15 4 (0.65%) MCPD
Quality Assurance & Compliance
1 11 (1.79%) ISO/IEC 27001
2 8 (1.30%) ISO 9001
3 7 (1.14%) GDPR
4 6 (0.97%) Data Quality
4 6 (0.97%) GAAP
4 6 (0.97%) PMO
5 5 (0.81%) GxP
5 5 (0.81%) SLA
6 4 (0.65%) COBIT
6 4 (0.65%) Cyber Essentials
6 4 (0.65%) Sarbanes-Oxley
7 3 (0.49%) Accessibility
7 3 (0.49%) ISO/IEC 20000
7 3 (0.49%) NIST
7 3 (0.49%) QA
8 1 (0.16%) Cyber Essentials PLUS
8 1 (0.16%) ISO 26262
8 1 (0.16%) NIST 800
8 1 (0.16%) SOC 2
System Software
1 47 (7.63%) Active Directory
2 16 (2.60%) Virtual Machines
2 16 (2.60%) VMware Infrastructure
3 13 (2.11%) Docker
4 7 (1.14%) Hyper-V
5 2 (0.32%) Firmware
5 2 (0.32%) Virtual Desktop
6 1 (0.16%) Virtual Servers
6 1 (0.16%) VMware ESXi
6 1 (0.16%) vSphere
6 1 (0.16%) XenApp
Systems Management
1 64 (10.39%) Terraform
2 45 (7.31%) Kubernetes
3 26 (4.22%) Microsoft Intune
4 17 (2.76%) Istio
5 10 (1.62%) Ansible
6 5 (0.81%) Jamf Pro
6 5 (0.81%) SCCM
6 5 (0.81%) Single Sign-On
7 2 (0.32%) SCOM
8 1 (0.16%) Consul
8 1 (0.16%) Failover Clustering
8 1 (0.16%) Nagios
8 1 (0.16%) vCenter Server
8 1 (0.16%) ZABBIX
Vendors
1 134 (21.75%) Microsoft
2 49 (7.95%) Google
3 27 (4.38%) SAP
4 25 (4.06%) VMware
5 22 (3.57%) Salesforce
6 18 (2.92%) HubSpot
7 17 (2.76%) IBM
8 15 (2.44%) HP
9 13 (2.11%) Cisco
9 13 (2.11%) ServiceNow
10 12 (1.95%) Sun
11 11 (1.79%) Fortinet
11 11 (1.79%) Unisys
12 10 (1.62%) Juniper
13 8 (1.30%) Palo Alto
14 7 (1.14%) Meraki
15 6 (0.97%) Aruba
15 6 (0.97%) Confluent
15 6 (0.97%) Oracle
16 5 (0.81%) Citrix