Hybrid/Remote Innovative Thinking Job Trends

Innovative Thinking
UK > Work from Home

The table below provides summary statistics and salary benchmarking for remote or hybrid work requiring Innovative Thinking skills. It covers vacancies from the 6 months leading up to 31 August 2025, with comparisons to the same periods in the previous two years.

6 months to
31 Aug 2025
Same period 2024 Same period 2023
Rank 204 455 458
Rank change year-on-year +251 +3 -76
Permanent jobs citing Innovative Thinking 248 48 93
As % of all permanent jobs with a WFH option 1.50% 0.20% 0.35%
As % of the Processes & Methodologies category 1.61% 0.23% 0.37%
Number of salaries quoted 54 37 76
10th Percentile £36,250 £36,600 £31,512
25th Percentile £61,563 £60,000 £45,751
Median annual salary (50th Percentile) £67,500 £65,000 £65,000
Median % change year-on-year +3.85% - +23.81%
75th Percentile £76,875 £76,250 £97,500
90th Percentile £111,750 £86,750 £100,000
UK median annual salary £65,000 £55,322 £62,500
% change year-on-year +17.49% -11.48% -

All Process and Methodology Skills
Work from Home

Innovative Thinking falls under the Processes and Methodologies category. For comparison with the information above, the following table provides summary statistics for all permanent job vacancies with remote or hybrid options requiring process or methodology skills.

Permanent vacancies with a requirement for process or methodology skills 15,360 21,266 25,262
As % of all permanent jobs with a WFH option 93.02% 87.61% 95.51%
Number of salaries quoted 8,950 14,216 20,397
10th Percentile £29,750 £35,000 £37,500
25th Percentile £40,750 £44,106 £47,500
Median annual salary (50th Percentile) £58,500 £60,000 £62,500
Median % change year-on-year -2.50% -4.00% +2.16%
75th Percentile £77,500 £79,114 £81,250
90th Percentile £100,000 £100,000 £100,000
UK median annual salary £55,000 £56,000 £60,000
% change year-on-year -1.79% -6.67% -

Innovative Thinking
Trend for Jobs with a WFH Option

Job vacancies with remote working options citing Innovative Thinking as a proportion of all IT jobs advertised.
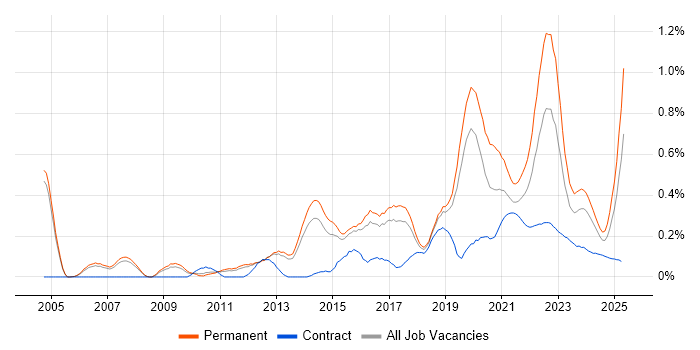
Innovative Thinking trend for jobs with Hybrid/Remote/WFH options

Innovative Thinking
Salary Trend for Jobs with Hybrid Work Options

Salary distribution trend for jobs with remote work options citing Innovative Thinking.

Salary distribution trend for jobs with remote work options citing Innovative Thinking

Innovative Thinking
Salary Histogram for Jobs with a WFH Option

Salary distribution for jobs with remote working options citing Innovative Thinking over the 6 months to 31 August 2025.

Innovative Thinking salary histogram for jobs with a WFH option

Innovative Thinking
Co-occurring Skills and Capabilities with WFH Options by Category

The follow tables expand on the table above by listing co-occurrences grouped by category. The same employment type, locality and period is covered with up to 20 co-occurrences shown in each of the following categories:

Application Platforms
1 16 (6.45%) IIS
2 9 (3.63%) Microsoft Exchange
3 1 (0.40%) SharePoint
Applications
1 13 (5.24%) Microsoft Excel
2 5 (2.02%) Microsoft Office
3 4 (1.61%) Microsoft PowerPoint
3 4 (1.61%) Simulink
4 2 (0.81%) Adobe After Effects
4 2 (0.81%) Adobe Creative Suite
4 2 (0.81%) Adobe Illustrator
4 2 (0.81%) InDesign
4 2 (0.81%) Photoshop
Business Applications
1 43 (17.34%) Sparx Enterprise Architect
2 7 (2.82%) Q-Pulse
3 1 (0.40%) SAP S/4HANA
Cloud Services
1 14 (5.65%) Azure
2 8 (3.23%) AWS
2 8 (3.23%) Microsoft 365
3 7 (2.82%) Figma
3 7 (2.82%) SaaS
4 5 (2.02%) IaaS
4 5 (2.02%) PaaS
4 5 (2.02%) Power Platform
5 4 (1.61%) Google Docs
5 4 (1.61%) Google Sheets
5 4 (1.61%) Miro
5 4 (1.61%) Slack
6 3 (1.21%) Azure Data Factory
6 3 (1.21%) GCP
7 2 (0.81%) Collibra
8 1 (0.40%) Azure DevOps
Communications & Networking
1 41 (16.53%) Software-Defined Radio
2 40 (16.13%) Wireless
3 5 (2.02%) Firewall
3 5 (2.02%) SAN
4 4 (1.61%) VPN
5 2 (0.81%) GPRS
5 2 (0.81%) Intrusion Detection
5 2 (0.81%) LTE
5 2 (0.81%) Modbus
5 2 (0.81%) Network Security
6 1 (0.40%) BGP
6 1 (0.40%) Broadband
6 1 (0.40%) Cisco IOS
6 1 (0.40%) DHCP
6 1 (0.40%) LAN
6 1 (0.40%) MPLS
6 1 (0.40%) Multicast
6 1 (0.40%) OSPF
6 1 (0.40%) TCP/IP
6 1 (0.40%) WAN
Database & Business Intelligence
1 5 (2.02%) Power BI
1 5 (2.02%) SQL Server
2 3 (1.21%) Data Warehouse
2 3 (1.21%) SQL Server Integration Services
2 3 (1.21%) SQL Server Reporting Services
3 2 (0.81%) Tableau
4 1 (0.40%) GIS
4 1 (0.40%) Metadata
Development Applications
1 5 (2.02%) SQL Server Management Studio (SSMS)
2 3 (1.21%) JIRA
General
1 197 (79.44%) Finance
2 37 (14.92%) Analytical Skills
3 27 (10.89%) Social Skills
4 10 (4.03%) Military
5 9 (3.63%) Marketing
6 7 (2.82%) Aerospace
6 7 (2.82%) Aviation
6 7 (2.82%) Inclusion and Diversity
7 6 (2.42%) Influencing Skills
7 6 (2.42%) Law
8 5 (2.02%) Legal
8 5 (2.02%) Manufacturing
8 5 (2.02%) Spanish Language
8 5 (2.02%) Telecoms
9 4 (1.61%) Banking
10 3 (1.21%) Organisational Skills
10 3 (1.21%) Presentation Skills
11 2 (0.81%) Public Sector
12 1 (0.40%) Retail
12 1 (0.40%) Retail Banking
Job Titles
1 76 (30.65%) Systems Engineer
2 45 (18.15%) Software Engineer
3 41 (16.53%) Administrator
3 41 (16.53%) Systems Administrator
4 38 (15.32%) Embedded Engineer
4 38 (15.32%) Embedded Software Engineer
5 20 (8.06%) Senior
6 16 (6.45%) Consultant
6 16 (6.45%) Cybersecurity Consultant
6 16 (6.45%) Security Consultant
6 16 (6.45%) Senior Consultant
6 16 (6.45%) Senior Cybersecurity Consultant
6 16 (6.45%) Senior Security Consultant
7 9 (3.63%) Analyst
7 9 (3.63%) Design Engineer
7 9 (3.63%) FPGA Design Engineer
7 9 (3.63%) FPGA Engineer
8 6 (2.42%) Architect
9 5 (2.02%) Applications Support Analyst
9 5 (2.02%) Enterprise Architect
Libraries, Frameworks & Software Standards
1 7 (2.82%) XML
2 5 (2.02%) Middleware
2 5 (2.02%) SAML
3 4 (1.61%) .NET
4 1 (0.40%) Laravel
4 1 (0.40%) Node.js
4 1 (0.40%) SAP Fiori
Miscellaneous
1 177 (71.37%) e-Learning
2 38 (15.32%) Embedded Systems
2 38 (15.32%) MicroBlaze
2 38 (15.32%) RISC-V
3 18 (7.26%) Management Information System
4 16 (6.45%) CESG
5 12 (4.84%) FPGA
6 9 (3.63%) Self-Motivation
7 7 (2.82%) Product Ownership
7 7 (2.82%) Reference Data
8 6 (2.42%) Enterprise Software
9 5 (2.02%) Augmented Reality
9 5 (2.02%) Cloud Native
9 5 (2.02%) PKI
10 3 (1.21%) IoT
11 2 (0.81%) Animation
11 2 (0.81%) NB-IoT
11 2 (0.81%) Onboarding
11 2 (0.81%) Video Editing
12 1 (0.40%) Video Conferencing
Operating Systems
1 84 (33.87%) Linux
2 38 (15.32%) Embedded Linux
3 19 (7.66%) Unix
3 19 (7.66%) Windows
4 9 (3.63%) Windows Server
5 5 (2.02%) Mac OS
6 2 (0.81%) Windows 10
Processes & Methodologies
1 55 (22.18%) Agile
2 46 (18.55%) Software Engineering
3 45 (18.15%) Problem-Solving
4 44 (17.74%) Model-Based Systems Engineering
4 44 (17.74%) Systems Engineering
5 43 (17.34%) DoDAF
5 43 (17.34%) Scenario Testing
5 43 (17.34%) SysML
5 43 (17.34%) Trade-off Analysis
5 43 (17.34%) UML
6 41 (16.53%) Digital Signal Processing
6 41 (16.53%) High Availability
6 41 (16.53%) Signal Processing
7 34 (13.71%) Cybersecurity
8 29 (11.69%) Mathematics
8 29 (11.69%) Physics
9 26 (10.48%) Trend Analysis
10 23 (9.27%) Creative Thinking
10 23 (9.27%) Risk Management
11 20 (8.06%) Information Security
Programming Languages
1 39 (15.73%) C
1 39 (15.73%) C++
2 15 (6.05%) SQL
3 8 (3.23%) Python
4 7 (2.82%) PL/SQL
5 6 (2.42%) PHP
6 4 (1.61%) MATLAB
6 4 (1.61%) Perl
7 3 (1.21%) Bash
7 3 (1.21%) Data Analysis Expressions
7 3 (1.21%) PowerShell
8 1 (0.40%) Ruby
8 1 (0.40%) Tcl
8 1 (0.40%) TypeScript
Qualifications
1 181 (72.98%) Security Cleared
2 164 (66.13%) SC Cleared
3 68 (27.42%) DV Cleared
4 49 (19.76%) Cisco Certification
4 49 (19.76%) Degree
5 48 (19.35%) CCNP
6 23 (9.27%) CCNA
6 23 (9.27%) RHCSA
7 17 (6.85%) CESG Certified Professional
8 16 (6.45%) CISM
8 16 (6.45%) CISMP
8 16 (6.45%) CISSP
8 16 (6.45%) IISP
9 10 (4.03%) Master's Degree
10 8 (3.23%) BPSS Clearance
11 5 (2.02%) Azure Certification
11 5 (2.02%) VMware Certified Professional (VCP)
12 3 (1.21%) CCIE
12 3 (1.21%) Microsoft Certification
12 3 (1.21%) PhD
Quality Assurance & Compliance
1 18 (7.26%) NIST
1 18 (7.26%) NIST 800
2 16 (6.45%) HMG Security Policy Framework
2 16 (6.45%) JSP 440
2 16 (6.45%) NCSC
2 16 (6.45%) RMADS
3 8 (3.23%) Data Quality
4 7 (2.82%) GDPR
4 7 (2.82%) QA
5 6 (2.42%) SLA
6 5 (2.02%) Sarbanes-Oxley
7 2 (0.81%) AQAP
7 2 (0.81%) Cyber Essentials
7 2 (0.81%) HIPAA
7 2 (0.81%) ISO 9001
7 2 (0.81%) ISO/IEC 27001
7 2 (0.81%) Software Quality Assurance
8 1 (0.40%) Accessibility
8 1 (0.40%) Government Security Classifications
System Software
1 41 (16.53%) Firmware
2 38 (15.32%) Embedded Firmware
3 7 (2.82%) Active Directory
4 6 (2.42%) VMware ESXi
5 5 (2.02%) Hyper-V
6 2 (0.81%) Virtual Desktop
7 1 (0.40%) Docker
7 1 (0.40%) VMware Infrastructure
7 1 (0.40%) VMware NSX
Systems Management
1 5 (2.02%) Single Sign-On
2 1 (0.40%) Ansible
2 1 (0.40%) Avamar
2 1 (0.40%) Kubernetes
2 1 (0.40%) Progress Chef
2 1 (0.40%) Puppet
2 1 (0.40%) SCCM
2 1 (0.40%) vCenter Server
2 1 (0.40%) VxRail
Vendors
1 43 (17.34%) Cisco
1 43 (17.34%) Sparx
2 23 (9.27%) Red Hat
3 17 (6.85%) Microsoft
4 6 (2.42%) VMware
5 5 (2.02%) Google
5 5 (2.02%) N-able
5 5 (2.02%) Veeam
6 4 (1.61%) Salesforce
6 4 (1.61%) TippingPoint
7 3 (1.21%) Xilinx
8 2 (0.81%) Adobe
9 1 (0.40%) Alteryx
9 1 (0.40%) Aruba
9 1 (0.40%) CyberArk
9 1 (0.40%) Dell
9 1 (0.40%) EMC
9 1 (0.40%) SAP
9 1 (0.40%) ServiceNow
9 1 (0.40%) Snow