Tableau Jobs with Hybrid/Remote/WFH Options

Tableau
UK > Work from Home

The table below provides summary statistics for permanent remote or hybrid work requiring Tableau skills. It includes a benchmarking guide to the annual salaries offered in vacancies that cited Tableau over the 6 months leading up to 7 May 2025, comparing them to the same period in the previous two years.

6 months to
7 May 2025
Same period 2024 Same period 2023
Rank 210 214 188
Rank change year-on-year +4 -26 +77
Permanent jobs citing Tableau 249 507 802
As % of all permanent jobs with a WFH option 1.52% 1.50% 1.89%
As % of the Database & Business Intelligence category 7.13% 6.54% 7.67%
Number of salaries quoted 107 266 377
10th Percentile £38,750 £36,250 £37,500
25th Percentile £45,000 £42,625 £46,250
Median annual salary (50th Percentile) £58,000 £60,000 £60,000
Median % change year-on-year -3.33% - +4.35%
75th Percentile £73,750 £84,964 £76,250
90th Percentile £102,410 £85,000 £98,500
UK median annual salary £60,000 £55,000 £60,000
% change year-on-year +9.09% -8.33% +9.09%

All Database and Business Intelligence Skills
Work from Home

Tableau falls under the Databases and Business Intelligence category. For comparison with the information above, the following table provides summary statistics for all permanent job vacancies with remote or hybrid options requiring database or business intelligence skills.

Permanent vacancies with a requirement for database or business intelligence skills 3,490 7,749 10,462
As % of all permanent jobs with a WFH option 21.27% 22.89% 24.69%
Number of salaries quoted 2,414 6,228 7,186
10th Percentile £37,500 £37,042 £40,000
25th Percentile £50,000 £43,750 £49,750
Median annual salary (50th Percentile) £65,000 £57,500 £65,000
Median % change year-on-year +13.04% -11.54% +8.33%
75th Percentile £90,000 £75,000 £82,500
90th Percentile £122,500 £95,000 £102,250
UK median annual salary £62,500 £57,500 £65,000
% change year-on-year +8.70% -11.54% +8.33%

Tableau
Trend for Jobs with a WFH Option

Job vacancies with remote working options citing Tableau as a proportion of all IT jobs advertised.
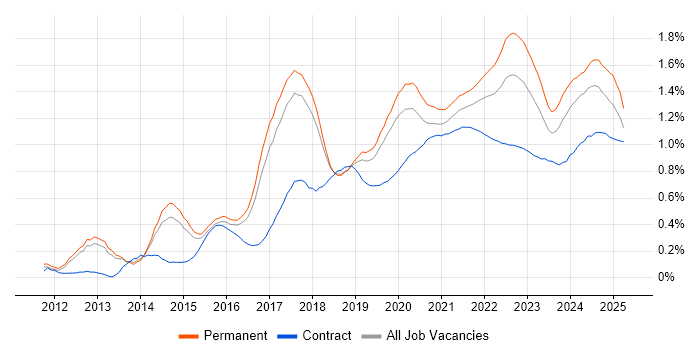
Tableau trend for jobs with Hybrid/Remote/WFH options

Tableau
Salary Trend for Jobs with a WFH Option

3-month moving average salary quoted in job vacancies with remote working options citing Tableau.

Tableau salary trend for jobs with a WFH option

Tableau
Salary Histogram for Jobs with a WFH Option

Salary distribution for jobs with remote working options citing Tableau over the 6 months to 7 May 2025.

Tableau salary histogram for jobs with a WFH option

Tableau
Co-occurring Skills and Capabilities with WFH Options by Category

The follow tables expand on the table above by listing co-occurrences grouped by category. The same employment type, locality and period is covered with up to 20 co-occurrences shown in each of the following categories:

Application Platforms
1 11 (4.42%) Apache Spark
2 3 (1.20%) Apache Airflow
3 2 (0.80%) Confluence
4 1 (0.40%) Jupyter
Applications
1 46 (18.47%) Microsoft Excel
2 8 (3.21%) Microsoft PowerPoint
3 6 (2.41%) Trello
4 4 (1.61%) MS Visio
5 2 (0.80%) Microsoft Office
5 2 (0.80%) Spreadsheet
Business Applications
1 2 (0.80%) ResourceLink
2 1 (0.40%) NetSuite
Cloud Services
1 132 (53.01%) Power Platform
2 50 (20.08%) Azure
3 39 (15.66%) AWS
4 34 (13.65%) Snowflake
5 22 (8.84%) GCP
6 17 (6.83%) GitHub
7 12 (4.82%) Azure DevOps
8 10 (4.02%) Azure Synapse Analytics
8 10 (4.02%) dbt
9 8 (3.21%) Adobe Analytics
10 5 (2.01%) Google Analytics
11 4 (1.61%) Amazon EC2
11 4 (1.61%) Amazon S3
11 4 (1.61%) AWS Lambda
11 4 (1.61%) Collibra
11 4 (1.61%) Serverless
11 4 (1.61%) Zapier
12 3 (1.20%) Amazon SageMaker
12 3 (1.20%) Azure Data Factory
12 3 (1.20%) Typeform
Database & Business Intelligence
1 132 (53.01%) Power BI
2 32 (12.85%) Data Warehouse
3 24 (9.64%) SQL Server
4 18 (7.23%) Big Data
5 16 (6.43%) BigQuery
5 16 (6.43%) Looker
6 10 (4.02%) Metadata
6 10 (4.02%) SQL Server Integration Services
7 8 (3.21%) Data Hub
7 8 (3.21%) Data Lake
7 8 (3.21%) Hadoop
7 8 (3.21%) SQL Server Reporting Services
8 7 (2.81%) Relational Database
9 6 (2.41%) PostgreSQL
10 5 (2.01%) Amazon Redshift
11 4 (1.61%) Azure SQL Data Warehouse
11 4 (1.61%) Enterprise Data Warehouse
11 4 (1.61%) Metabase
11 4 (1.61%) Metadata Repository
11 4 (1.61%) Qlik Sense
Development Applications
1 52 (20.88%) Git
2 9 (3.61%) JIRA
3 3 (1.20%) GitLab
3 3 (1.20%) Subversion
4 1 (0.40%) SQL Server Management Studio (SSMS)
General
1 123 (49.40%) Social Skills
2 106 (42.57%) Analytical Skills
3 96 (38.55%) Finance
4 50 (20.08%) Presentation Skills
5 43 (17.27%) Retail
6 32 (12.85%) Marketing
7 30 (12.05%) Banking
8 18 (7.23%) Inclusion and Diversity
9 14 (5.62%) Law
10 11 (4.42%) Billing
10 11 (4.42%) Public Sector
11 10 (4.02%) Legal
12 9 (3.61%) Influencing Skills
13 8 (3.21%) Games
14 6 (2.41%) Publishing
15 4 (1.61%) Telecoms
16 3 (1.20%) Manufacturing
16 3 (1.20%) Organisational Skills
17 2 (0.80%) Advertising
17 2 (0.80%) Police
Job Titles
1 111 (44.58%) Analyst
2 77 (30.92%) Data Analyst
3 71 (28.51%) Senior
4 47 (18.88%) Senior Analyst
5 31 (12.45%) Senior Data Analyst
6 26 (10.44%) Data Engineer
7 23 (9.24%) Data Manager
8 21 (8.43%) Data Scientist
9 18 (7.23%) Lead
10 12 (4.82%) Developer
11 11 (4.42%) Insight Analyst
11 11 (4.42%) Senior Data Scientist
12 9 (3.61%) Financial Analyst
12 9 (3.61%) Principal Data Scientist
13 8 (3.21%) Analytics Manager
13 8 (3.21%) Credit Analyst
13 8 (3.21%) Data Insight Analyst
13 8 (3.21%) Insight Data Analyst
13 8 (3.21%) Junior
13 8 (3.21%) Strategy Analyst
Libraries, Frameworks & Software Standards
1 13 (5.22%) PySpark
2 11 (4.42%) Pandas
2 11 (4.42%) scikit-learn
3 9 (3.61%) .NET
3 9 (3.61%) TensorFlow
4 6 (2.41%) React
4 6 (2.41%) RESTful
5 5 (2.01%) HTML
5 5 (2.01%) Hugging Face
6 4 (1.61%) CSS
6 4 (1.61%) Middleware
7 3 (1.20%) XGBoost
7 3 (1.20%) XML
8 2 (0.80%) Kafka
8 2 (0.80%) NumPy
8 2 (0.80%) Pyramid
8 2 (0.80%) Regular Expression
9 1 (0.40%) Django
9 1 (0.40%) EDI
9 1 (0.40%) REST
Miscellaneous
1 19 (7.63%) Algorithms
2 18 (7.23%) Credit Risk
3 14 (5.62%) Product Ownership
4 7 (2.81%) Linux Command Line
4 7 (2.81%) Management Information System
5 6 (2.41%) Mobile Games
6 5 (2.01%) Data Structures
6 5 (2.01%) Legacy Systems
6 5 (2.01%) NHS
7 4 (1.61%) Analytical Mindset
8 3 (1.20%) Digital Media
9 2 (0.80%) Educational Technology
9 2 (0.80%) Life Science
9 2 (0.80%) Marketing Technology
9 2 (0.80%) Online Games
9 2 (0.80%) Self-Motivation
10 1 (0.40%) Greenfield Project
10 1 (0.40%) Pricing Data
10 1 (0.40%) Public Cloud
10 1 (0.40%) Renewable Energy
Operating Systems
1 7 (2.81%) Linux
Processes & Methodologies
1 160 (64.26%) Analytics
2 147 (59.04%) Visualisation
3 119 (47.79%) Business Intelligence
4 95 (38.15%) Problem-Solving
5 81 (32.53%) Data Visualisation
6 66 (26.51%) Data Analytics
7 61 (24.50%) Decision-Making
7 61 (24.50%) Storytelling
8 57 (22.89%) Mentoring
9 55 (22.09%) Data Science
10 54 (21.69%) Data Analysis
11 49 (19.68%) Data Pipeline
12 47 (18.88%) Actionable Insight
12 47 (18.88%) Agile
12 47 (18.88%) Data Modelling
13 45 (18.07%) Mathematics
14 42 (16.87%) Statistics
15 37 (14.86%) Continuous Improvement
15 37 (14.86%) Root Cause Analysis
16 33 (13.25%) ETL
Programming Languages
1 194 (77.91%) SQL
2 140 (56.22%) Python
3 15 (6.02%) R
4 14 (5.62%) T-SQL
5 9 (3.61%) C#
5 9 (3.61%) JavaScript
6 8 (3.21%) Java
7 4 (1.61%) PL/SQL
7 4 (1.61%) VBA
8 3 (1.20%) Julia
9 2 (0.80%) Bash
9 2 (0.80%) Data Analysis Expressions
9 2 (0.80%) PHP
9 2 (0.80%) VB
10 1 (0.40%) Ruby
10 1 (0.40%) Scala
Qualifications
1 87 (34.94%) Degree
2 59 (23.69%) DBS Check
3 31 (12.45%) Master's Degree
4 10 (4.02%) Computer Science Degree
5 8 (3.21%) Security Cleared
6 7 (2.81%) SC Cleared
7 6 (2.41%) Six Sigma Black Belt
8 5 (2.01%) CSPO
8 5 (2.01%) DV Cleared
9 4 (1.61%) Numerate Degree
10 2 (0.80%) Tableau Certification
11 1 (0.40%) ACCA
11 1 (0.40%) CBAP
11 1 (0.40%) CIMA
11 1 (0.40%) IIBA
11 1 (0.40%) PMI Certification
Quality Assurance & Compliance
1 44 (17.67%) Data Quality
2 10 (4.02%) QA
3 8 (3.21%) Actionable Recommendations
4 7 (2.81%) GDPR
5 5 (2.01%) Accessibility
6 2 (0.80%) SLA
System Software
1 14 (5.62%) Docker
2 4 (1.61%) HDFS
Systems Management
1 14 (5.62%) Kubernetes
2 2 (0.80%) Systems Management Server (SMS)
2 2 (0.80%) Terraform
3 1 (0.40%) Istio
Vendors
1 53 (21.29%) Databricks
2 41 (16.47%) Microsoft
3 22 (8.84%) Google
4 18 (7.23%) Salesforce
5 14 (5.62%) SAP
6 10 (4.02%) Oracle
7 8 (3.21%) Adobe
7 8 (3.21%) Cognos
8 7 (2.81%) Omniture
9 4 (1.61%) Teradata
10 2 (0.80%) Alteryx
10 2 (0.80%) F5
10 2 (0.80%) Informatica
10 2 (0.80%) Logi
10 2 (0.80%) Logi Analytics
10 2 (0.80%) Salesforce Marketing Cloud
10 2 (0.80%) ServiceNow
11 1 (0.40%) Anaplan
11 1 (0.40%) Facebook
11 1 (0.40%) MuleSoft