Team Leader Jobs with Hybrid/Remote/WFH Options

Team Lead
UK > Work from Home

The median Team Lead salary for remote or hybrid work is £54,793 per year, according to job vacancies posted during the 6 months leading to 28 May 2025.

The table below provides salary benchmarking and summary statistics, comparing them to the same period in the previous two years.

6 months to
28 May 2025
Same period 2024 Same period 2023
Rank 158 238 340
Rank change year-on-year +80 +102 +119
Permanent jobs requiring a Team Leader 441 460 361
As % of all permanent jobs with a WFH option 2.37% 1.35% 0.90%
As % of the Job Titles category 2.59% 1.40% 0.94%
Number of salaries quoted 115 425 276
10th Percentile £32,500 £39,450 £41,500
25th Percentile £46,423 £50,000 £47,375
Median annual salary (50th Percentile) £54,793 £65,000 £58,750
Median % change year-on-year -15.70% +10.64% -9.62%
75th Percentile £71,250 £81,250 £75,000
90th Percentile £84,000 £142,500 £92,035
UK median annual salary £54,793 £55,000 £57,500
% change year-on-year -0.38% -4.35% +4.55%

All Permanent IT Job Vacancies
Work from Home

For comparison with the information above, the following table provides summary statistics for all permanent IT job vacancies with WFH or hybrid options. Most job vacancies include a discernible job title that can be normalized. As such, the figures in the second row provide an indication of the number of permanent jobs in our overall sample.

Permanent vacancies in Work from Home with a recognized job title 17,000 32,872 38,382
% of permanent jobs with a recognized job title 91.30% 96.16% 95.92%
Number of salaries quoted 9,335 25,152 27,304
10th Percentile £27,500 £33,127 £36,750
25th Percentile £41,250 £42,500 £47,447
Median annual salary (50th Percentile) £57,500 £56,000 £62,500
Median % change year-on-year +2.68% -10.40% +4.17%
75th Percentile £76,250 £75,000 £81,250
90th Percentile £100,000 £93,750 £100,000
UK median annual salary £55,000 £52,500 £60,000
% change year-on-year +4.76% -12.50% -

Team Leader
Trend for Jobs with a WFH Option

Job vacancies with remote working options which featured Team Leader in the job title as a proportion of all IT jobs advertised.
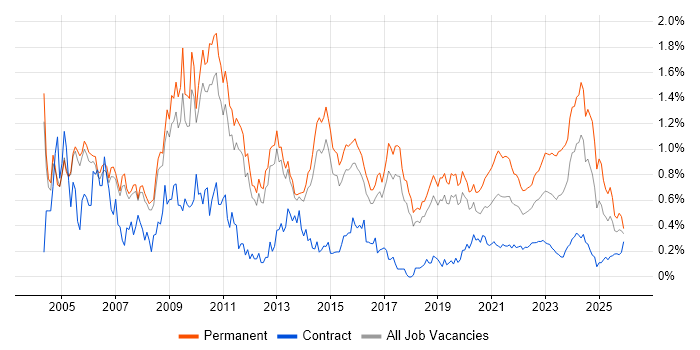
Team Leader trend for jobs with Hybrid/Remote/WFH options

Team Leader
Salary Trend for Jobs with a WFH Option

3-month moving average salary quoted in job vacancies with remote working options citing Team Leader.

Team Leader salary trend for jobs with a WFH option

Team Leader
Salary Histogram for Jobs with a WFH Option

Salary distribution for jobs with remote working options citing Team Leader over the 6 months to 28 May 2025.

Team Leader salary histogram for jobs with a WFH option

Team Leader Skill Set
Top 30 Co-occurring Skills and Capabilities in Job Vacancies with WFH Options

For the 6 months to 28 May 2025, Team Leader job roles required the following skills and capabilities in order of popularity. The figures indicate the absolute number co-occurrences and as a proportion of all permanent jobs with hybrid or remote work options featuring Team Leader in the job title.

1 339 (76.87%) Mentoring
2 299 (67.80%) Agile
3 295 (66.89%) Roadmaps
4 288 (65.31%) High Availability
5 287 (65.08%) Product Management
5 287 (65.08%) Broadband
6 239 (54.20%) AWS
6 239 (54.20%) DevOps
7 238 (53.97%) Linux
8 230 (52.15%) Python
9 224 (50.79%) Java
10 223 (50.57%) Inclusion and Diversity
11 222 (50.34%) JavaScript
12 220 (49.89%) Kubernetes
13 219 (49.66%) Docker
14 218 (49.43%) Relational Database
15 217 (49.21%) Go
15 217 (49.21%) NoSQL
15 217 (49.21%) Continuous Integration
16 216 (48.98%) Resource Management
16 216 (48.98%) Ansible
16 216 (48.98%) AWS Certification
16 216 (48.98%) Containerisation
16 216 (48.98%) Terraform
16 216 (48.98%) Task Automation
16 216 (48.98%) Infrastructure as Code
17 215 (48.75%) Argo
17 215 (48.75%) GitOps
17 215 (48.75%) Pulumi
17 215 (48.75%) Kustomize

Team Leader Skill Set
Co-occurring Skills and Capabilities with WFH Options by Category

The follow tables expand on the table above by listing co-occurrences grouped by category. The same employment type, locality and period is covered with up to 20 co-occurrences shown in each of the following categories:

Application Platforms
1 4 (0.91%) SharePoint
Applications
1 43 (9.75%) Microsoft Office
2 40 (9.07%) Simulink
3 6 (1.36%) Microsoft Excel
Cloud Services
1 239 (54.20%) AWS
2 215 (48.75%) Pulumi
3 27 (6.12%) Microsoft 365
4 22 (4.99%) Azure
5 12 (2.72%) SaaS
6 7 (1.59%) PaaS
6 7 (1.59%) Serverless
7 6 (1.36%) Entra ID
8 3 (0.68%) Amazon EKS
8 3 (0.68%) GCP
9 2 (0.45%) npm
10 1 (0.23%) Amazon SQS
10 1 (0.23%) AWS Lambda
10 1 (0.23%) IaaS
10 1 (0.23%) Power Platform
10 1 (0.23%) Snowflake
Communications & Networking
1 287 (65.08%) Broadband
2 7 (1.59%) Firewall
3 6 (1.36%) VPN
4 5 (1.13%) LAN
4 5 (1.13%) WAN
5 4 (0.91%) TCP/IP
6 3 (0.68%) DHCP
6 3 (0.68%) DNS
6 3 (0.68%) Wi-Fi
7 2 (0.45%) Internet
7 2 (0.45%) Intrusion Detection
7 2 (0.45%) WLAN
8 1 (0.23%) Bluetooth
8 1 (0.23%) HTTP
8 1 (0.23%) Wireless
Database & Business Intelligence
1 218 (49.43%) Relational Database
2 217 (49.21%) NoSQL
3 215 (48.75%) RDBMS
4 15 (3.40%) SQL Server
5 14 (3.17%) PostgreSQL
6 2 (0.45%) MongoDB
7 1 (0.23%) Data Lake
7 1 (0.23%) Data Warehouse
7 1 (0.23%) Elasticsearch
7 1 (0.23%) Power BI
7 1 (0.23%) SQLite
Development Applications
1 215 (48.75%) Jaeger
2 5 (1.13%) JIRA
3 4 (0.91%) Git
4 2 (0.45%) webpack
5 1 (0.23%) Bitbucket
5 1 (0.23%) Jenkins
General
1 223 (50.57%) Inclusion and Diversity
2 162 (36.73%) Social Skills
3 41 (9.30%) Aerospace
4 11 (2.49%) Law
5 9 (2.04%) Analytical Skills
6 8 (1.81%) Finance
7 5 (1.13%) Electronics
8 3 (0.68%) Banking
9 2 (0.45%) Games
9 2 (0.45%) Military
9 2 (0.45%) Organisational Skills
9 2 (0.45%) Tech for Good
10 1 (0.23%) Advertising
10 1 (0.23%) Automotive
10 1 (0.23%) Front Office
10 1 (0.23%) Pharmaceutical
10 1 (0.23%) Public Sector
10 1 (0.23%) Retail
Libraries, Frameworks & Software Standards
1 215 (48.75%) Elastic Stack
1 215 (48.75%) OpenTelemetry
2 10 (2.27%) React Native
3 9 (2.04%) Flutter
4 5 (1.13%) React
4 5 (1.13%) RESTful
5 4 (0.91%) .NET
5 4 (0.91%) SailPoint
6 3 (0.68%) CSS
7 2 (0.45%) AngularJS
7 2 (0.45%) FastAPI
7 2 (0.45%) HTML
7 2 (0.45%) Web Services
8 1 (0.23%) .NET Core
8 1 (0.23%) .NET Framework
8 1 (0.23%) Kafka
8 1 (0.23%) Laravel
8 1 (0.23%) Pandas
8 1 (0.23%) Vue
8 1 (0.23%) XML
Miscellaneous
1 7 (1.59%) Driving Licence
1 7 (1.59%) Onboarding
2 6 (1.36%) Algorithms
2 6 (1.36%) IoT
3 5 (1.13%) Cyber Threat
4 4 (0.91%) Data Structures
5 3 (0.68%) iPad
5 3 (0.68%) iPhone
5 3 (0.68%) Low-Code
6 2 (0.45%) CMDB
6 2 (0.45%) Data Centre
6 2 (0.45%) Legacy Systems
6 2 (0.45%) Management Information System
6 2 (0.45%) Mobile App
6 2 (0.45%) Mobile Games
6 2 (0.45%) Private Cloud
6 2 (0.45%) Product Ownership
6 2 (0.45%) Security Operations Centre
7 1 (0.23%) Cloud Native
7 1 (0.23%) Virtual Team
Operating Systems
1 238 (53.97%) Linux
2 215 (48.75%) Unix
3 30 (6.80%) Windows
4 15 (3.40%) Windows Server
5 9 (2.04%) Apple iOS
6 3 (0.68%) Android
7 2 (0.45%) Windows 10
Processes & Methodologies
1 339 (76.87%) Mentoring
2 299 (67.80%) Agile
3 295 (66.89%) Roadmaps
4 288 (65.31%) High Availability
5 287 (65.08%) Product Management
6 239 (54.20%) DevOps
7 217 (49.21%) Continuous Integration
8 216 (48.98%) Containerisation
8 216 (48.98%) Infrastructure as Code
8 216 (48.98%) Resource Management
8 216 (48.98%) Task Automation
9 215 (48.75%) Budget Control
9 215 (48.75%) Cost Optimisation
9 215 (48.75%) GitOps
9 215 (48.75%) Performance Optimisation
10 109 (24.72%) Problem-Solving
11 82 (18.59%) Coaching
12 78 (17.69%) Computer Science
13 71 (16.10%) Broadcast Engineering
14 49 (11.11%) Project Management
Programming Languages
1 230 (52.15%) Python
2 224 (50.79%) Java
3 222 (50.34%) JavaScript
4 217 (49.21%) Go
5 215 (48.75%) Bash
6 16 (3.63%) SQL
7 7 (1.59%) C#
8 6 (1.36%) TypeScript
9 5 (1.13%) C++
10 3 (0.68%) PHP
11 2 (0.45%) Elixir
11 2 (0.45%) F#
11 2 (0.45%) Ruby
11 2 (0.45%) Scala
12 1 (0.23%) C
12 1 (0.23%) Kotlin
12 1 (0.23%) PowerShell
Qualifications
1 216 (48.98%) AWS Certification
2 82 (18.59%) Degree
3 72 (16.33%) Computer Science Degree
4 40 (9.07%) BPSS Clearance
5 15 (3.40%) DBS Check
6 7 (1.59%) CCNA
6 7 (1.59%) CCNP
6 7 (1.59%) Cisco Certification
6 7 (1.59%) MCP
6 7 (1.59%) MCSA
6 7 (1.59%) MCSE
6 7 (1.59%) Microsoft Certification
7 4 (0.91%) Security Cleared
8 2 (0.45%) DV Cleared
8 2 (0.45%) SC Cleared
9 1 (0.23%) AWS Certified Solutions Architect
9 1 (0.23%) Azure Certification
9 1 (0.23%) Chartered Engineer
9 1 (0.23%) CHECK Team Leader
9 1 (0.23%) CITP
Quality Assurance & Compliance
1 12 (2.72%) ISO 9001
2 6 (1.36%) QA
3 3 (0.68%) SLA
4 2 (0.45%) Accessibility
5 1 (0.23%) Data Quality
5 1 (0.23%) GDPR
5 1 (0.23%) IEC 62304
5 1 (0.23%) ISO 13485
5 1 (0.23%) ISO/IEC 27001
System Software
1 219 (49.66%) Docker
2 12 (2.72%) Active Directory
3 8 (1.81%) VMware Infrastructure
4 5 (1.13%) Hyper-V
5 3 (0.68%) BitLocker
5 3 (0.68%) Firmware
6 2 (0.45%) vSphere
Systems Management
1 220 (49.89%) Kubernetes
2 216 (48.98%) Ansible
2 216 (48.98%) Terraform
3 215 (48.75%) Argo
3 215 (48.75%) Kustomize
3 215 (48.75%) Prometheus
4 5 (1.13%) SCCM
5 3 (0.68%) Microsoft Intune
6 1 (0.23%) Active Directory Federation Services
6 1 (0.23%) Progress Chef
6 1 (0.23%) Puppet
6 1 (0.23%) Single Sign-On
Vendors
1 215 (48.75%) Google
2 79 (17.91%) Microsoft
3 40 (9.07%) MathWorks
4 12 (2.72%) Cisco
5 8 (1.81%) NetApp
5 8 (1.81%) VMware
6 6 (1.36%) Dell
7 4 (0.91%) Apple
7 4 (0.91%) ServiceNow
8 3 (0.68%) HP
8 3 (0.68%) MobileIron
9 2 (0.45%) Aruba
9 2 (0.45%) IBM
9 2 (0.45%) Juniper
9 2 (0.45%) McAfee
9 2 (0.45%) Splunk
10 1 (0.23%) Databricks
10 1 (0.23%) Intel
10 1 (0.23%) Okta
10 1 (0.23%) Zscaler