TOGAF Jobs with Work from Home Options

The Open Group Architecture Framework (TOGAF)
UK > Work from Home

The table below provides summary statistics for permanent remote or hybrid work requiring TOGAF skills. It includes a benchmarking guide to the annual salaries offered in vacancies that cited TOGAF over the 6 months leading up to 20 June 2024, comparing them to the same period in the previous two years.

6 months to
20 Jun 2024
Same period 2023 Same period 2022
Rank 178 213 400
Rank change year-on-year +35 +187 -34
Permanent jobs citing TOGAF 635 604 660
As % of all permanent jobs with a WFH option 1.79% 1.61% 0.87%
As % of the Processes & Methodologies category 1.99% 1.68% 0.90%
Number of salaries quoted 111 397 459
10th Percentile £53,250 £57,500 £57,500
25th Percentile £61,250 £70,600 £66,250
Median annual salary (50th Percentile) £82,500 £72,500 £78,500
Median % change year-on-year +13.79% -7.64% +12.14%
75th Percentile £92,500 £90,000 £92,500
90th Percentile £107,500 £99,850 £105,000
UK median annual salary £82,500 £77,500 £79,500
% change year-on-year +6.45% -2.52% +6.00%

All Process and Methodology Skills
Work from Home

TOGAF falls under the Processes and Methodologies category. For comparison with the information above, the following table provides summary statistics for all permanent job vacancies with remote or hybrid options requiring process or methodology skills.

Permanent vacancies with a requirement for process or methodology skills 31,847 35,988 73,511
As % of all permanent jobs with a WFH option 89.59% 96.02% 97.15%
Number of salaries quoted 23,766 25,695 42,040
10th Percentile £33,750 £37,500 £36,250
25th Percentile £42,500 £47,500 £46,250
Median annual salary (50th Percentile) £57,500 £63,000 £60,000
Median % change year-on-year -8.73% +5.00% +9.09%
75th Percentile £75,000 £82,500 £80,000
90th Percentile £95,000 £100,000 £95,000
UK median annual salary £55,000 £60,899 £60,000
% change year-on-year -9.69% +1.50% +9.09%

TOGAF
Trend for Jobs with a WFH Option

Job vacancies with a work from home option citing TOGAF as a proportion of all IT jobs advertised.
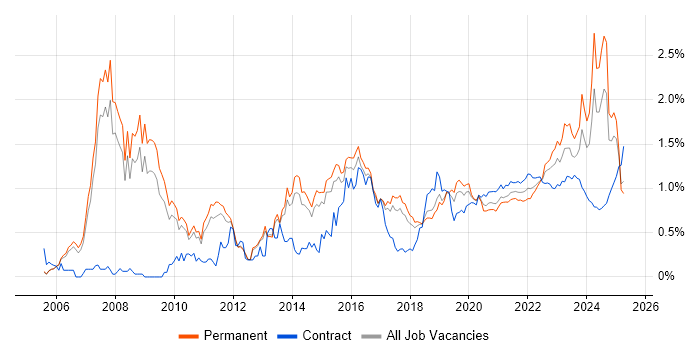
TOGAF trend for jobs with a WFH option

TOGAF
Salary Trend for Jobs with a WFH Option

3-month moving average salary quoted in job vacancies with a work from home option citing TOGAF.

TOGAF salary trend for jobs with a WFH option

TOGAF
Salary Histogram for Jobs with a WFH Option

Salary distribution for jobs with a work from home option citing TOGAF over the 6 months to 20 June 2024.

TOGAF salary histogram for jobs with a WFH option

TOGAF
Co-occurring Skills and Capabilities with WFH Options by Category

The follow tables expand on the table above by listing co-occurrences grouped by category. The same employment type, locality and period is covered with up to 20 co-occurrences shown in each of the following categories:

Application Platforms
1 299 (47.09%) SAS
2 46 (7.24%) WebLogic
3 12 (1.89%) Confluence
4 4 (0.63%) ArcGIS
4 4 (0.63%) WebSphere
5 1 (0.16%) SharePoint
Applications
1 3 (0.47%) MS Visio
2 2 (0.31%) Microsoft Excel
Business Applications
1 299 (47.09%) SAP ERP
2 58 (9.13%) Sparx Enterprise Architect
3 32 (5.04%) Remedy ITSM
4 1 (0.16%) Oracle ERP
4 1 (0.16%) Salesforce CRM
4 1 (0.16%) SAP IS-U
4 1 (0.16%) SAP Oil and Gas
4 1 (0.16%) SAP S/4HANA
Cloud Services
1 232 (36.54%) Azure
2 192 (30.24%) AWS
3 115 (18.11%) SaaS
4 107 (16.85%) Microsoft 365
5 86 (13.54%) GCP
6 46 (7.24%) Amazon EKS
6 46 (7.24%) Amazon SQS
7 34 (5.35%) IaaS
7 34 (5.35%) PaaS
8 18 (2.83%) Power Platform
8 18 (2.83%) Snowflake
9 17 (2.68%) Serverless
10 15 (2.36%) Cloud Computing
11 12 (1.89%) Dynamics 365
11 12 (1.89%) Matillion
11 12 (1.89%) Microsoft Copilot
12 8 (1.26%) Entra ID
13 6 (0.94%) Azure Service Fabric
14 3 (0.47%) Lucidchart
14 3 (0.47%) WhatsApp
Communications & Networking
1 299 (47.09%) Broadband
2 51 (8.03%) DNS
2 51 (8.03%) TCP/IP
3 46 (7.24%) BGP
3 46 (7.24%) SSL
4 9 (1.42%) Firewall
4 9 (1.42%) Network Security
4 9 (1.42%) VPN
5 6 (0.94%) WAN
6 5 (0.79%) DHCP
7 4 (0.63%) LAN
7 4 (0.63%) Wireless
8 3 (0.47%) Internet
9 2 (0.31%) PBX
9 2 (0.31%) SD-WAN
10 1 (0.16%) 4G
10 1 (0.16%) 5G
10 1 (0.16%) VoIP
Database & Business Intelligence
1 46 (7.24%) Amazon RDS
1 46 (7.24%) Oracle Database
1 46 (7.24%) RDBMS
1 46 (7.24%) Relational Database
2 38 (5.98%) Data Warehouse
3 14 (2.20%) Power BI
4 13 (2.05%) Metadata
5 12 (1.89%) Data Lake
6 8 (1.26%) NoSQL
7 6 (0.94%) Azure SQL Database
8 5 (0.79%) Elasticsearch
8 5 (0.79%) Redis
9 4 (0.63%) DB2
9 4 (0.63%) Geospatial Data
9 4 (0.63%) GIS
10 3 (0.47%) Big Data
10 3 (0.47%) QualityStage
11 1 (0.16%) Amazon Athena
11 1 (0.16%) Amazon Redshift
11 1 (0.16%) Data Vault
Development Applications
1 12 (1.89%) JIRA
2 1 (0.16%) Rational DOORS
General
1 405 (63.78%) Social Skills
2 341 (53.70%) Finance
3 85 (13.39%) Presentation Skills
4 35 (5.51%) Analytical Skills
5 18 (2.83%) Public Sector
6 17 (2.68%) Inclusion and Diversity
7 5 (0.79%) Law
7 5 (0.79%) Local Government
8 4 (0.63%) Billing
8 4 (0.63%) Legal
8 4 (0.63%) Military
8 4 (0.63%) Retail
8 4 (0.63%) Wearables
9 3 (0.47%) Banking
9 3 (0.47%) Influencing Skills
10 2 (0.31%) Back Office
10 2 (0.31%) Police
10 2 (0.31%) Public Speaking
11 1 (0.16%) Advertising
11 1 (0.16%) Aerospace
Job Titles
1 610 (96.06%) Architect
2 434 (68.35%) Solutions Architect
3 88 (13.86%) Cloud Architect
4 55 (8.66%) Lead
5 54 (8.50%) Lead Architect
6 50 (7.87%) Lead Solutions Architect
7 36 (5.67%) Presales Solution Architect
8 34 (5.35%) ServiceNow Architect
9 28 (4.41%) Enterprise Architect
10 18 (2.83%) IT Architect
11 16 (2.52%) Data Architect
11 16 (2.52%) Salesforce Architect
11 16 (2.52%) Salesforce Solution Architect
12 12 (1.89%) Business Manager
12 12 (1.89%) Business Systems Manager
12 12 (1.89%) Infrastructure Architect
12 12 (1.89%) Systems Manager
13 11 (1.73%) IT Infrastructure Architect
14 10 (1.57%) Enterprise Data Architect
15 9 (1.42%) Security Architect
Libraries, Frameworks & Software Standards
1 46 (7.24%) RabbitMQ
1 46 (7.24%) Spring Boot
2 23 (3.62%) Middleware
3 8 (1.26%) REST
3 8 (1.26%) SOAP
4 7 (1.10%) Web Services
5 6 (0.94%) .NET
6 4 (0.63%) WebSphere MQ
7 2 (0.31%) EDI
8 1 (0.16%) Blazor
8 1 (0.16%) XML
Miscellaneous
1 150 (23.62%) Public Cloud
2 81 (12.76%) PKI
3 62 (9.76%) Enterprise Software
4 39 (6.14%) Cloud Native
5 16 (2.52%) Management Information System
6 12 (1.89%) Data Centre
7 6 (0.94%) Distributed Systems
8 5 (0.79%) Legacy Systems
8 5 (0.79%) Onboarding
9 4 (0.63%) Private Cloud
9 4 (0.63%) Taxonomies
10 3 (0.47%) Educational Technology
10 3 (0.47%) Mobile App
10 3 (0.47%) Product Ownership
11 2 (0.31%) CMDB
11 2 (0.31%) Greenfield Project
11 2 (0.31%) NHS
11 2 (0.31%) N-Tier
11 2 (0.31%) Replication
11 2 (0.31%) Self-Motivation
Operating Systems
1 58 (9.13%) Linux
2 50 (7.87%) Red Hat Enterprise Linux
3 13 (2.05%) Windows
4 2 (0.31%) Windows 10
Processes & Methodologies
1 420 (66.14%) Agile
2 378 (59.53%) Enterprise Architecture
3 347 (54.65%) Roadmaps
4 318 (50.08%) Data Management
5 317 (49.92%) Change Management
6 312 (49.13%) ERP
7 306 (48.19%) Strategic Roadmap
8 299 (47.09%) Performance Management
9 159 (25.04%) Actionable Insight
10 152 (23.94%) Presales
11 142 (22.36%) Project Management
12 136 (21.42%) Migration
13 100 (15.75%) Configuration Management
14 95 (14.96%) Scrum
15 81 (12.76%) Application Virtualisation
16 66 (10.39%) Collaborative Working
17 62 (9.76%) ArchiMate
18 57 (8.98%) SDLC
19 51 (8.03%) Systems Engineering
20 50 (7.87%) Load Balancing
Programming Languages
1 27 (4.25%) SQL
2 12 (1.89%) T-SQL
3 1 (0.16%) C#
Qualifications
1 96 (15.12%) Security Cleared
2 90 (14.17%) SC Cleared
3 84 (13.23%) TOGAF Certification
4 55 (8.66%) Azure Certification
5 50 (7.87%) Degree
6 49 (7.72%) AWS Certification
7 47 (7.40%) AWS Certified Solutions Architect
8 17 (2.68%) CISSP
8 17 (2.68%) Computer Science Degree
9 13 (2.05%) Master's Degree
10 12 (1.89%) APMG
10 12 (1.89%) PMI Certification
10 12 (1.89%) PMP
11 11 (1.73%) CISM
12 6 (0.94%) GIAC
12 6 (0.94%) Microsoft Certification
12 6 (0.94%) SANS
13 4 (0.63%) BPSS Clearance
13 4 (0.63%) RHCA
14 2 (0.31%) DV Cleared
Quality Assurance & Compliance
1 38 (5.98%) COBIT
2 16 (2.52%) GDPR
3 11 (1.73%) NIST
4 6 (0.94%) ISO/IEC 27001
4 6 (0.94%) Web Application Security Consortium
5 5 (0.79%) Data Quality
5 5 (0.79%) QA
6 4 (0.63%) NCSC
7 3 (0.47%) Accessibility
8 2 (0.31%) Cyber Essentials
8 2 (0.31%) ISO/IEC 15288
9 1 (0.16%) ECSS
9 1 (0.16%) NIST 800
System Software
1 7 (1.10%) VMware Infrastructure
2 5 (0.79%) Active Directory
2 5 (0.79%) Hyper-V
3 4 (0.63%) VMware ESXi
3 4 (0.63%) vSphere
4 1 (0.16%) Virtual Desktop
Systems Management
1 32 (5.04%) OpenView
2 6 (0.94%) Computer Emergency Response Teams
3 5 (0.79%) Grafana
3 5 (0.79%) Kubernetes
3 5 (0.79%) Prometheus
3 5 (0.79%) SCOM
4 3 (0.47%) Terraform
5 2 (0.31%) Microsoft Intune
Vendors
1 358 (56.38%) Oracle
2 306 (48.19%) SAP
3 299 (47.09%) Anaplan
3 299 (47.09%) Hyperion
4 114 (17.95%) Microsoft
5 84 (13.23%) Google
6 58 (9.13%) Sparx
7 46 (7.24%) ServiceNow
8 32 (5.04%) BMC
8 32 (5.04%) HP
8 32 (5.04%) Remedy
9 31 (4.88%) Salesforce
10 15 (2.36%) Databricks
11 7 (1.10%) VMware
12 5 (0.79%) IBM
12 5 (0.79%) SolarWinds
13 4 (0.63%) Cisco
13 4 (0.63%) Citrix
13 4 (0.63%) Juniper
13 4 (0.63%) Red Hat