Process Improvement Jobs in England

Process Improvement
UK > England

The table below provides summary statistics for permanent job vacancies advertised in England requiring Process Improvement skills. It includes a benchmarking guide to the annual salaries offered in vacancies that cited Process Improvement over the 6 months leading up to 28 May 2025, comparing them to the same period in the previous two years.

6 months to
28 May 2025
Same period 2024 Same period 2023
Rank 159 121 200
Rank change year-on-year -38 +79 +29
Permanent jobs citing Process Improvement 1,007 2,011 1,583
As % of all permanent jobs advertised in England 2.08% 2.27% 1.82%
As % of the Processes & Methodologies category 2.21% 2.70% 1.90%
Number of salaries quoted 602 935 834
10th Percentile £31,250 £31,500 £37,500
25th Percentile £40,000 £41,250 £46,250
Median annual salary (50th Percentile) £52,750 £55,000 £60,000
Median % change year-on-year -4.09% -8.33% +1.69%
75th Percentile £73,750 £72,500 £71,250
90th Percentile £87,500 £85,000 £88,750
UK median annual salary £53,000 £53,500 £60,000
% change year-on-year -0.93% -10.83% +4.35%

All Process and Methodology Skills
England

Process Improvement falls under the Processes and Methodologies category. For comparison with the information above, the following table provides summary statistics for all permanent job vacancies requiring process or methodology skills in England.

Permanent vacancies with a requirement for process or methodology skills 45,477 74,482 83,229
As % of all permanent jobs advertised in England 94.01% 84.24% 95.56%
Number of salaries quoted 22,533 54,432 49,691
10th Percentile £29,625 £29,000 £34,375
25th Percentile £41,250 £40,000 £46,105
Median annual salary (50th Percentile) £57,500 £55,000 £62,500
Median % change year-on-year +4.55% -12.00% +4.17%
75th Percentile £75,000 £72,500 £82,500
90th Percentile £98,695 £93,750 £102,500
UK median annual salary £57,500 £55,000 £61,000
% change year-on-year +4.55% -9.84% +1.67%

Process Improvement
Job Vacancy Trend in England

Job postings citing Process Improvement as a proportion of all IT jobs advertised in England.
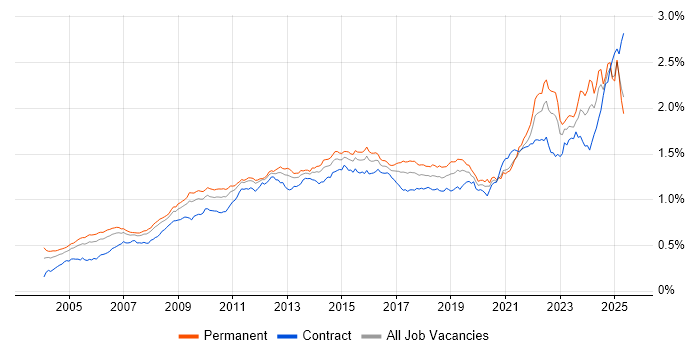
Job vacancy trend for Process Improvement in England

Process Improvement
Salary Trend in England

3-month moving average salary quoted in jobs citing Process Improvement in England.

Salary trend for Process Improvement in England

Process Improvement
Salary Histogram in England

Salary distribution for jobs citing Process Improvement in England over the 6 months to 28 May 2025.

Salary histogram for Process Improvement in England

Process Improvement
Job Locations in England

The table below looks at the demand and provides a guide to the median salaries quoted in IT jobs citing Process Improvement within the England region over the 6 months to 28 May 2025. The 'Rank Change' column provides an indication of the change in demand within each location based on the same 6 month period last year.

Location Rank Change
on Same Period
Last Year
Matching
Permanent
IT Job Ads
Median Salary
Past 6 Months
Median Salary
% Change
on Same Period
Last Year
Live
Jobs
London +1 338 £72,500 +3.57% 929
North of England 0 266 £45,000 -5.26% 824
North West -2 196 £47,000 -1.05% 403
South East -4 180 £57,500 +27.78% 1,015
Midlands -113 94 £45,362 -13.60% 660
East of England +19 73 £35,000 -30.00% 488
West Midlands -81 60 £48,000 -11.11% 374
Yorkshire +3 54 £42,500 -5.56% 317
South West +7 41 £52,500 +0.20% 390
East Midlands -53 33 £42,750 +6.88% 237
North East +13 16 £38,500 -9.41% 108
Process Improvement
UK

Process Improvement
Co-occurring Skills and Capabilities in England by Category

The follow tables expand on the table above by listing co-occurrences grouped by category. The same employment type, locality and period is covered with up to 20 co-occurrences shown in each of the following categories:

Application Platforms
1 51 (5.06%) SharePoint
2 14 (1.39%) Confluence
3 12 (1.19%) IIS
4 11 (1.09%) Microsoft Exchange
5 2 (0.20%) OpenStack
5 2 (0.20%) ThingWorx
5 2 (0.20%) WordPress
6 1 (0.099%) Apache
6 1 (0.099%) Apache Airflow
6 1 (0.099%) CMS
6 1 (0.099%) Moodle
6 1 (0.099%) Oracle Workflow
6 1 (0.099%) SugarCRM
6 1 (0.099%) WebLogic
Applications
1 126 (12.51%) Microsoft Excel
2 48 (4.77%) Microsoft Office
3 25 (2.48%) Microsoft Project
4 23 (2.28%) Trello
5 15 (1.49%) MS Visio
6 12 (1.19%) Microsoft PowerPoint
7 7 (0.70%) Chatbot
8 5 (0.50%) Spreadsheet
9 1 (0.099%) Simulink
Business Applications
1 42 (4.17%) SAP S/4HANA
2 22 (2.18%) NetSuite
3 8 (0.79%) Salesforce CRM
4 7 (0.70%) SAP Business One
5 5 (0.50%) SAP ERP
6 3 (0.30%) Dynamics CRM
6 3 (0.30%) Dynamics NAV
6 3 (0.30%) Infor CloudSuite
6 3 (0.30%) Infor CloudSuite Industrial (formerly SyteLine)
6 3 (0.30%) SAP HCM
6 3 (0.30%) Workday HCM
7 2 (0.20%) iTrent
7 2 (0.20%) Magento
7 2 (0.20%) Sage 1000
7 2 (0.20%) SAP GRC
7 2 (0.20%) SAP GTS
7 2 (0.20%) SAP Oil and Gas
7 2 (0.20%) SAP Payroll
7 2 (0.20%) SAP SCM
7 2 (0.20%) SAP SD
Cloud Services
1 123 (12.21%) Azure
2 106 (10.53%) Power Platform
3 85 (8.44%) AWS
4 83 (8.24%) Microsoft 365
5 59 (5.86%) SaaS
6 29 (2.88%) GCP
7 20 (1.99%) Dynamics 365
8 15 (1.49%) Azure DevOps
8 15 (1.49%) Cloud Computing
8 15 (1.49%) PowerApps
9 12 (1.19%) Power Automate
10 11 (1.09%) Entra ID
11 10 (0.99%) Virtual Private Cloud
12 9 (0.89%) Amazon S3
13 8 (0.79%) AWS Direct Connect
13 8 (0.79%) Miro
13 8 (0.79%) Serverless
14 7 (0.70%) Amazon CloudWatch
14 7 (0.70%) Amazon EC2
14 7 (0.70%) OneDrive
Communications & Networking
1 45 (4.47%) Firewall
2 26 (2.58%) VPN
3 24 (2.38%) DNS
4 23 (2.28%) LAN
4 23 (2.28%) WAN
5 21 (2.09%) DHCP
6 20 (1.99%) TCP/IP
7 15 (1.49%) Network Security
8 10 (0.99%) Cisco ASA
8 10 (0.99%) SD-WAN
8 10 (0.99%) WLAN
9 9 (0.89%) Internet
9 9 (0.89%) IPsec
9 9 (0.89%) MPLS
9 9 (0.89%) Wi-Fi
10 8 (0.79%) BGP
10 8 (0.79%) Cisco ISE
10 8 (0.79%) NX-OS
10 8 (0.79%) OSPF
10 8 (0.79%) VXLAN
Database & Business Intelligence
1 94 (9.33%) Power BI
2 50 (4.97%) Big Data
3 31 (3.08%) SQL Server
4 22 (2.18%) Relational Database
5 21 (2.09%) Tableau
6 20 (1.99%) PostgreSQL
7 15 (1.49%) NoSQL
8 9 (0.89%) RDBMS
9 7 (0.70%) Power Query
9 7 (0.70%) SQL Server Reporting Services
10 5 (0.50%) Data Lake
10 5 (0.50%) Data Warehouse
11 4 (0.40%) Amazon QuickSight
11 4 (0.40%) PowerPivot
11 4 (0.40%) SQL Server Integration Services
12 3 (0.30%) Azure SQL Database
12 3 (0.30%) BigQuery
12 3 (0.30%) Crystal Reports
12 3 (0.30%) MongoDB
12 3 (0.30%) MS Access
Development Applications
1 81 (8.04%) JIRA
2 21 (2.09%) Selenium
3 13 (1.29%) Git
4 7 (0.70%) Jenkins
4 7 (0.70%) Postman
5 6 (0.60%) JMeter
5 6 (0.60%) SpecFlow
6 5 (0.50%) LoadRunner
6 5 (0.50%) TestRail
6 5 (0.50%) Visual Studio
7 4 (0.40%) Cypress.io
7 4 (0.40%) JUnit
8 3 (0.30%) Oracle Forms
9 2 (0.20%) NUnit
9 2 (0.20%) Visual Studio Code
9 2 (0.20%) WebDriver
10 1 (0.099%) Bitbucket
10 1 (0.099%) Jasmine
10 1 (0.099%) Karma Test Runner
10 1 (0.099%) REST Assured
General
1 485 (48.16%) Social Skills
2 357 (35.45%) Finance
3 336 (33.37%) Analytical Skills
4 92 (9.14%) Marketing
5 86 (8.54%) Law
6 62 (6.16%) Manufacturing
7 58 (5.76%) Advertising
8 54 (5.36%) Legal
9 44 (4.37%) Inclusion and Diversity
10 36 (3.57%) Banking
11 29 (2.88%) Organisational Skills
12 28 (2.78%) Pharmaceutical
13 26 (2.58%) Public Sector
13 26 (2.58%) Retail
14 25 (2.48%) Aviation
14 25 (2.48%) Telecoms
15 23 (2.28%) Documentation Skills
16 19 (1.89%) Aerospace
17 18 (1.79%) Games
17 18 (1.79%) Presentation Skills
Job Titles
1 274 (27.21%) Analyst
2 171 (16.98%) Senior
3 98 (9.73%) Lead
4 72 (7.15%) Business Analyst
5 71 (7.05%) Financial Analyst
6 67 (6.65%) Senior Manager
7 52 (5.16%) Systems Analyst
8 50 (4.97%) Account Manager
9 49 (4.87%) Senior Account Manager
10 46 (4.57%) Administrator
10 46 (4.57%) Developer
11 44 (4.37%) Project Manager
12 39 (3.87%) Data Analyst
13 36 (3.57%) Team Leader
14 35 (3.48%) Finance Systems Analyst
15 32 (3.18%) Support Analyst
16 26 (2.58%) Procurement Analyst
17 24 (2.38%) Finance Business Analyst
18 23 (2.28%) IT Manager
18 23 (2.28%) Senior Analyst
Libraries, Frameworks & Software Standards
1 31 (3.08%) REST
2 30 (2.98%) .NET
3 22 (2.18%) FastAPI
4 21 (2.09%) Flask
5 20 (1.99%) React
6 15 (1.49%) HTML
7 11 (1.09%) CSS
8 10 (0.99%) AngularJS
9 8 (0.79%) ASP.NET
9 8 (0.79%) Node.js
10 7 (0.70%) RESTful
11 6 (0.60%) Boost C++ Libraries
11 6 (0.60%) FIX Protocol
11 6 (0.60%) JSON
11 6 (0.60%) pytest
12 5 (0.50%) Lightning Web Components
13 4 (0.40%) .NET Core
13 4 (0.40%) Oracle Fusion
13 4 (0.40%) Web Services
14 3 (0.30%) Kafka
Miscellaneous
1 118 (11.72%) Management Information System
2 50 (4.97%) Digital Media
2 50 (4.97%) Marketing Technology
3 38 (3.77%) Social Media
4 36 (3.57%) Product Ownership
5 31 (3.08%) Analytical Mindset
6 24 (2.38%) Algorithms
7 22 (2.18%) Onboarding
7 22 (2.18%) Self-Motivation
8 19 (1.89%) Data Centre
8 19 (1.89%) Data Protection Act
8 19 (1.89%) Legacy Systems
9 18 (1.79%) Life Science
10 17 (1.69%) Derivative
11 15 (1.49%) Client/Server
12 13 (1.29%) Taxonomies
13 11 (1.09%) Enterprise Software
14 10 (0.99%) Mobile App
14 10 (0.99%) Private Cloud
14 10 (0.99%) Robotics
Operating Systems
1 81 (8.04%) Windows
2 42 (4.17%) Windows Server
3 21 (2.09%) Linux
4 14 (1.39%) Apple iOS
5 12 (1.19%) Windows Server 2016
6 11 (1.09%) Windows Server 2012
6 11 (1.09%) Windows Server 2019
7 10 (0.99%) Android
8 6 (0.60%) Windows Vista
9 5 (0.50%) CentOS
9 5 (0.50%) Rocky
9 5 (0.50%) Ubuntu
10 4 (0.40%) Unix
10 4 (0.40%) Windows 10
11 1 (0.099%) Embedded Linux
11 1 (0.099%) VMS
Processes & Methodologies
1 448 (44.49%) Problem-Solving
2 265 (26.32%) Project Management
3 249 (24.73%) Agile
4 212 (21.05%) Continuous Improvement
5 170 (16.88%) ERP
6 143 (14.20%) Stakeholder Management
7 135 (13.41%) Decision-Making
8 129 (12.81%) Data Analysis
9 128 (12.71%) Analytics
9 128 (12.71%) Collaborative Working
10 125 (12.41%) Change Management
11 110 (10.92%) ITIL
12 103 (10.23%) Analytical Thinking
13 100 (9.93%) Artificial Intelligence
14 96 (9.53%) Project Delivery
15 93 (9.24%) Business Intelligence
16 91 (9.04%) Roadmaps
17 87 (8.64%) Visualisation
18 86 (8.54%) Computer Science
19 83 (8.24%) Data Management
Programming Languages
1 104 (10.33%) SQL
2 69 (6.85%) Python
3 34 (3.38%) JavaScript
4 28 (2.78%) PowerShell
5 24 (2.38%) C#
6 20 (1.99%) Java
7 9 (0.89%) T-SQL
8 8 (0.79%) C++
9 7 (0.70%) TypeScript
10 6 (0.60%) C
10 6 (0.60%) Data Analysis Expressions
10 6 (0.60%) PL/SQL
10 6 (0.60%) R
11 4 (0.40%) ABAP
11 4 (0.40%) Apex Code
11 4 (0.40%) Shell Script
12 3 (0.30%) VB.NET
12 3 (0.30%) VBA
13 2 (0.20%) Go
14 1 (0.099%) Dart
Qualifications
1 274 (27.21%) Degree
2 61 (6.06%) PMI Certification
3 59 (5.86%) PMP
4 52 (5.16%) ACCA
4 52 (5.16%) DBS Check
5 49 (4.87%) CIMA
6 38 (3.77%) Computer Science Degree
7 35 (3.48%) BPSS Clearance
8 30 (2.98%) Master's Degree
9 21 (2.09%) Microsoft Certification
9 21 (2.09%) Security Cleared
10 19 (1.89%) Azure Certification
11 18 (1.79%) SC Cleared
12 16 (1.59%) CCAB
12 16 (1.59%) PhD
13 14 (1.39%) ISTQB
13 14 (1.39%) MCSE
14 13 (1.29%) ITIL Certification
15 10 (0.99%) VMware Certified Professional (VCP)
16 9 (0.89%) Six Sigma Black Belt
Quality Assurance & Compliance
1 101 (10.03%) QA
2 77 (7.65%) Data Quality
3 73 (7.25%) SLA
4 20 (1.99%) Accessibility
5 17 (1.69%) GDPR
6 10 (0.99%) ISO/IEC 27001
7 9 (0.89%) Actionable Recommendations
8 8 (0.79%) GLP
8 8 (0.79%) GMP
8 8 (0.79%) PMO
9 6 (0.60%) Cyber Essentials
9 6 (0.60%) Cyber Essentials PLUS
10 5 (0.50%) IFRS
11 3 (0.30%) COBIT
11 3 (0.30%) GRC
11 3 (0.30%) PCI DSS
11 3 (0.30%) PMBOK
11 3 (0.30%) Sarbanes-Oxley
12 2 (0.20%) GAAP
12 2 (0.20%) ISO 9001
System Software
1 52 (5.16%) Active Directory
2 28 (2.78%) Docker
3 25 (2.48%) VMware Infrastructure
4 23 (2.28%) Hyper-V
5 9 (0.89%) Firmware
6 5 (0.50%) Virtual Machines
7 4 (0.40%) VMware ESXi
8 1 (0.099%) ProxySG
Systems Management
1 31 (3.08%) Kubernetes
2 29 (2.88%) Terraform
3 18 (1.79%) Microsoft Intune
4 13 (1.29%) SCCM
5 12 (1.19%) NetBackup
6 11 (1.09%) Ansible
6 11 (1.09%) SCOM
7 9 (0.89%) QRadar
8 6 (0.60%) ArcSight ESM
8 6 (0.60%) Grafana
9 5 (0.50%) Progress Chef
10 3 (0.30%) FortiGate
10 3 (0.30%) HP Quality Center
11 2 (0.20%) Computer Emergency Response Teams
12 1 (0.099%) Avamar
12 1 (0.099%) CSIRT
12 1 (0.099%) Functional Safety
12 1 (0.099%) Prometheus
12 1 (0.099%) Puppet
12 1 (0.099%) Single Sign-On
Vendors
1 199 (19.76%) Microsoft
2 157 (15.59%) SAP
3 48 (4.77%) Salesforce
4 41 (4.07%) Google
5 38 (3.77%) Workday
6 37 (3.67%) Oracle
6 37 (3.67%) ServiceNow
7 32 (3.18%) VMware
8 25 (2.48%) Cisco
8 25 (2.48%) Concur
9 22 (2.18%) SolarWinds
10 17 (1.69%) Splunk
11 15 (1.49%) Veeam
12 13 (1.29%) Meraki
13 12 (1.19%) Dynatrace
14 11 (1.09%) Anaplan
15 10 (0.99%) CheckPoint
15 10 (0.99%) Fortinet
16 7 (0.70%) Infoblox
17 6 (0.60%) McAfee