Roadmaps Jobs in England

Roadmaps
UK > England

The table below provides summary statistics for permanent job vacancies advertised in England requiring Roadmaps skills. It includes a benchmarking guide to the annual salaries offered in vacancies that cited Roadmaps over the 6 months leading up to 30 May 2025, comparing them to the same period in the previous two years.

6 months to
30 May 2025
Same period 2024 Same period 2023
Rank 26 33 23
Rank change year-on-year +7 -10 +4
Permanent jobs citing Roadmaps 3,649 4,702 7,656
As % of all permanent jobs advertised in England 7.45% 5.26% 8.86%
As % of the Processes & Methodologies category 7.93% 6.25% 9.27%
Number of salaries quoted 1,485 3,121 4,133
10th Percentile £50,000 £42,238 £47,500
25th Percentile £60,000 £52,500 £54,750
Median annual salary (50th Percentile) £77,500 £70,000 £72,477
Median % change year-on-year +10.71% -3.42% +3.54%
75th Percentile £101,000 £87,500 £92,500
90th Percentile £126,250 £110,000 £115,000
UK median annual salary £76,750 £70,000 £72,500
% change year-on-year +9.64% -3.45% +3.57%

All Process and Methodology Skills
England

Roadmaps falls under the Processes and Methodologies category. For comparison with the information above, the following table provides summary statistics for all permanent job vacancies requiring process or methodology skills in England.

Permanent vacancies with a requirement for process or methodology skills 46,039 75,199 82,570
As % of all permanent jobs advertised in England 94.03% 84.05% 95.58%
Number of salaries quoted 22,875 54,702 49,146
10th Percentile £29,500 £29,000 £34,452
25th Percentile £41,250 £40,000 £46,000
Median annual salary (50th Percentile) £57,500 £55,000 £62,500
Median % change year-on-year +4.55% -12.00% +4.17%
75th Percentile £75,000 £72,500 £82,500
90th Percentile £97,528 £93,750 £102,500
UK median annual salary £57,443 £55,000 £60,899
% change year-on-year +4.44% -9.69% +1.50%

Roadmaps
Job Vacancy Trend in England

Job postings citing Roadmaps as a proportion of all IT jobs advertised in England.
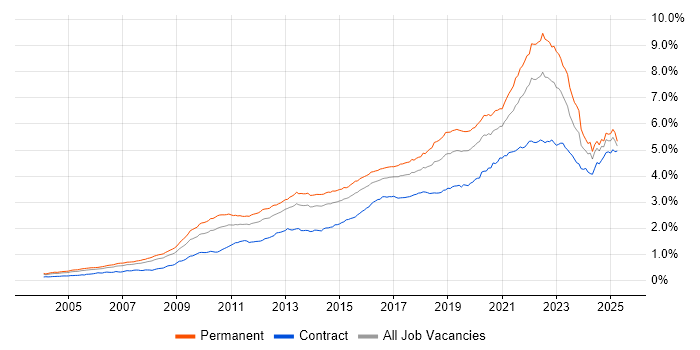
Job vacancy trend for Roadmaps in England

Roadmaps
Salary Trend in England

3-month moving average salary quoted in jobs citing Roadmaps in England.

Salary trend for Roadmaps in England

Roadmaps
Salary Histogram in England

Salary distribution for jobs citing Roadmaps in England over the 6 months to 30 May 2025.

Salary histogram for Roadmaps in England

Roadmaps
Job Locations in England

The table below looks at the demand and provides a guide to the median salaries quoted in IT jobs citing Roadmaps within the England region over the 6 months to 30 May 2025. The 'Rank Change' column provides an indication of the change in demand within each location based on the same 6 month period last year.

Location Rank Change
on Same Period
Last Year
Matching
Permanent
IT Job Ads
Median Salary
Past 6 Months
Median Salary
% Change
on Same Period
Last Year
Live
Jobs
London +11 1,458 £90,000 +5.88% 1,368
South East +24 591 £72,500 +16.00% 3,083
North of England -56 445 £65,000 - 2,334
North West -48 306 £60,000 -1.97% 1,144
Midlands -25 243 £64,750 +3.60% 1,939
East of England +9 224 £65,000 +8.33% 1,532
South West +4 170 £68,525 +19.17% 1,210
West Midlands -32 148 £65,700 +1.08% 1,056
Yorkshire -37 112 £80,000 +8.39% 911
East Midlands -1 93 £64,125 +16.59% 750
North East -20 27 £65,000 +12.14% 281
Roadmaps
UK

Roadmaps
Co-occurring Skills and Capabilities in England by Category

The follow tables expand on the table above by listing co-occurrences grouped by category. The same employment type, locality and period is covered with up to 20 co-occurrences shown in each of the following categories:

Application Platforms
1 110 (3.01%) Confluence
2 80 (2.19%) SharePoint
3 32 (0.88%) Microsoft Exchange
4 26 (0.71%) CMS
5 17 (0.47%) Apache Airflow
6 14 (0.38%) IIS
7 12 (0.33%) Apache Spark
8 11 (0.30%) WordPress
9 10 (0.27%) Tomcat
10 9 (0.25%) Apache
11 7 (0.19%) SAS
12 5 (0.14%) Kentico
13 4 (0.11%) IBM Domino
13 4 (0.11%) nginx
14 3 (0.082%) Drupal
15 2 (0.055%) Adobe Experience Manager
15 2 (0.055%) ArcGIS
15 2 (0.055%) Headless CMS
15 2 (0.055%) OpenStack
16 1 (0.027%) Camunda
Applications
1 114 (3.12%) Microsoft Office
2 34 (0.93%) Microsoft Excel
3 19 (0.52%) Maya
4 18 (0.49%) Chatbot
5 13 (0.36%) Microsoft PowerPoint
5 13 (0.36%) MS Visio
6 9 (0.25%) Microsoft Project
7 6 (0.16%) Trello
8 4 (0.11%) SPSS
9 3 (0.082%) Adobe Illustrator
9 3 (0.082%) Adobe XD
9 3 (0.082%) Photoshop
10 1 (0.027%) Siemens NX
10 1 (0.027%) Spreadsheet
Business Applications
1 43 (1.18%) Dynamics CRM
2 33 (0.90%) SAP S/4HANA
3 25 (0.69%) NetSuite
4 11 (0.30%) Dynamics AX
4 11 (0.30%) Salesforce CRM
4 11 (0.30%) SAP FI
4 11 (0.30%) Shopify
5 10 (0.27%) SAP CO
5 10 (0.27%) SAP FI/CO
6 9 (0.25%) Magento
6 9 (0.25%) SAP IBP
7 7 (0.19%) Endur
8 3 (0.082%) Oracle ERP
8 3 (0.082%) SAP SCM
9 2 (0.055%) Distributed Ledger
9 2 (0.055%) Dynamics NAV
9 2 (0.055%) NEC Housing
9 2 (0.055%) Oracle EBS
9 2 (0.055%) Primavera
9 2 (0.055%) SAP MM
Cloud Services
1 670 (18.36%) AWS
2 534 (14.63%) Azure
3 232 (6.36%) SaaS
4 218 (5.97%) Pulumi
5 156 (4.28%) Microsoft 365
6 146 (4.00%) Power Platform
7 142 (3.89%) GCP
8 122 (3.34%) Serverless
9 97 (2.66%) AWS Lambda
10 88 (2.41%) Miro
11 83 (2.27%) Entra ID
12 72 (1.97%) Asana
13 63 (1.73%) Dynamics 365
14 54 (1.48%) Azure DevOps
14 54 (1.48%) PaaS
15 51 (1.40%) Power Automate
16 42 (1.15%) GitHub
17 41 (1.12%) IaaS
18 39 (1.07%) Microsoft Copilot
19 36 (0.99%) Azure Data Factory
Communications & Networking
1 1,225 (33.57%) Broadband
2 101 (2.77%) SSL
3 83 (2.27%) SSH
4 66 (1.81%) Firewall
5 49 (1.34%) WAN
6 43 (1.18%) VPN
7 38 (1.04%) DNS
8 37 (1.01%) Network Security
9 24 (0.66%) LAN
10 23 (0.63%) Wireshark
11 22 (0.60%) SD-WAN
12 17 (0.47%) HTTP
13 15 (0.41%) DHCP
13 15 (0.41%) Internet
13 15 (0.41%) Wireless
14 14 (0.38%) MPLS
15 11 (0.30%) BGP
15 11 (0.30%) TCP/IP
15 11 (0.30%) Wi-Fi
16 10 (0.27%) DMARC
Database & Business Intelligence
1 243 (6.66%) NoSQL
2 240 (6.58%) Relational Database
3 222 (6.08%) RDBMS
4 182 (4.99%) Data Lake
5 120 (3.29%) Power BI
6 73 (2.00%) SQL Server
7 68 (1.86%) PostgreSQL
8 65 (1.78%) Data Warehouse
9 52 (1.43%) MySQL
10 45 (1.23%) MongoDB
11 43 (1.18%) Tableau
12 36 (0.99%) Metadata
13 30 (0.82%) Data Mining
14 19 (0.52%) BigQuery
14 19 (0.52%) Looker
15 15 (0.41%) Azure SQL Database
15 15 (0.41%) SQL Server Integration Services
16 14 (0.38%) Amazon Athena
16 14 (0.38%) SQL Server Reporting Services
17 11 (0.30%) Dremio
Development Applications
1 415 (11.37%) JIRA
2 215 (5.89%) Jaeger
3 60 (1.64%) Git
4 14 (0.38%) GitLab
5 11 (0.30%) Jenkins
5 11 (0.30%) PowerBuilder
6 8 (0.22%) TeamCity
7 6 (0.16%) Oracle Forms
8 5 (0.14%) Bitbucket
8 5 (0.14%) Selenium
8 5 (0.14%) Sonatype Nexus
9 4 (0.11%) Balsamiq
9 4 (0.11%) ER Studio
10 3 (0.082%) CircleCI
10 3 (0.082%) Cucumber
10 3 (0.082%) Postman
10 3 (0.082%) Subversion
11 2 (0.055%) Cypress.io
11 2 (0.055%) SoapUI
11 2 (0.055%) Vite
General
1 1,446 (39.63%) Social Skills
2 786 (21.54%) Finance
3 376 (10.30%) Analytical Skills
4 358 (9.81%) Inclusion and Diversity
5 330 (9.04%) Law
6 238 (6.52%) Marketing
7 222 (6.08%) Influencing Skills
8 177 (4.85%) Retail
9 150 (4.11%) Legal
10 135 (3.70%) Banking
11 130 (3.56%) Manufacturing
12 123 (3.37%) Games
13 93 (2.55%) Front Office
14 89 (2.44%) Presentation Skills
15 83 (2.27%) Multimedia
16 75 (2.06%) Public Sector
17 53 (1.45%) Organisational Skills
18 37 (1.01%) Telecoms
19 33 (0.90%) Electronics
20 28 (0.77%) Aerospace
Job Titles
1 917 (25.13%) Lead
2 447 (12.25%) Architect
3 445 (12.20%) Senior
4 299 (8.19%) Team Leader
5 226 (6.19%) Solutions Architect
6 215 (5.89%) Embedded Engineer
6 215 (5.89%) Release Engineer
7 204 (5.59%) Product Manager
8 196 (5.37%) Systems Engineer
9 195 (5.34%) Engineering Manager
10 184 (5.04%) Analyst
10 184 (5.04%) Senior Manager
11 110 (3.01%) Cloud Engineer
12 96 (2.63%) DevOps Engineer
12 96 (2.63%) Product Owner
13 87 (2.38%) ServiceNow Manager
14 83 (2.27%) Developer
15 80 (2.19%) Senior Architect
16 78 (2.14%) Senior Service Manager
17 75 (2.06%) Product Analyst
Libraries, Frameworks & Software Standards
1 242 (6.63%) Middleware
2 216 (5.92%) Elastic Stack
2 216 (5.92%) OpenTelemetry
3 140 (3.84%) React
4 102 (2.80%) .NET
5 98 (2.69%) RESTful
6 94 (2.58%) Web Services
7 68 (1.86%) REST
8 50 (1.37%) Kafka
9 42 (1.15%) Node.js
10 39 (1.07%) CSS
10 39 (1.07%) HTML
11 37 (1.01%) SOAP
12 24 (0.66%) Django
13 23 (0.63%) AngularJS
14 22 (0.60%) PyTorch
14 22 (0.60%) TensorFlow
15 21 (0.58%) jQuery
16 20 (0.55%) NumPy
17 18 (0.49%) Next.js
Miscellaneous
1 475 (13.02%) Product Ownership
2 284 (7.78%) Management Information System
3 221 (6.06%) Embedded Systems
4 153 (4.19%) Video\Live Streaming
5 115 (3.15%) Onboarding
6 104 (2.85%) Self-Motivation
7 97 (2.66%) Cloud Native
8 93 (2.55%) Equities
9 92 (2.52%) Fixed Income
10 91 (2.49%) PKI
11 88 (2.41%) Cyber Threat
11 88 (2.41%) Foreign Exchange (FX)
12 85 (2.33%) Derivative
13 83 (2.27%) Enterprise Software
14 82 (2.25%) Cyberattack
14 82 (2.25%) Hedge funds
15 74 (2.03%) Over-the-Top Content
16 64 (1.75%) Analytical Mindset
17 59 (1.62%) Algorithms
18 56 (1.53%) Data Centre
Operating Systems
1 293 (8.03%) Linux
2 233 (6.39%) Unix
3 104 (2.85%) Windows
4 33 (0.90%) Apple iOS
5 28 (0.77%) Windows Server
6 24 (0.66%) Android
7 17 (0.47%) Red Hat Enterprise Linux
8 9 (0.25%) zOS
9 4 (0.11%) Oracle Linux
9 4 (0.11%) Ubuntu
10 3 (0.082%) Windows Server 2012
11 2 (0.055%) Debian
11 2 (0.055%) Mac OS
11 2 (0.055%) Solaris
11 2 (0.055%) VMS
11 2 (0.055%) Windows Server 2016
11 2 (0.055%) Windows Server 2019
11 2 (0.055%) Windows Vista
12 1 (0.027%) AIX
12 1 (0.027%) SUSE
Processes & Methodologies
1 1,420 (38.91%) Agile
2 1,066 (29.21%) Product Management
3 1,031 (28.25%) Mentoring
4 1,025 (28.09%) Problem-Solving
5 853 (23.38%) Computer Science
6 809 (22.17%) High Availability
7 611 (16.74%) DevOps
8 578 (15.84%) Artificial Intelligence
9 557 (15.26%) Broadcast Engineering
10 472 (12.94%) Stakeholder Management
11 459 (12.58%) Analytics
12 440 (12.06%) Strategic Roadmap
13 430 (11.78%) CI/CD
14 388 (10.63%) Strategic Thinking
15 381 (10.44%) Product Roadmap
16 360 (9.87%) Continuous Improvement
17 359 (9.84%) Software Engineering
18 356 (9.76%) Technology Roadmap
19 340 (9.32%) Containerisation
20 325 (8.91%) Infrastructure as Code
Programming Languages
1 592 (16.22%) Python
2 370 (10.14%) Java
3 346 (9.48%) JavaScript
4 232 (6.36%) Bash
5 225 (6.17%) Go
6 196 (5.37%) SQL
7 112 (3.07%) C#
8 88 (2.41%) TypeScript
9 83 (2.27%) PowerShell
10 33 (0.90%) PHP
11 27 (0.74%) Bicep
11 27 (0.74%) Ruby
12 22 (0.60%) C
13 16 (0.44%) Scala
14 12 (0.33%) R
15 11 (0.30%) C++
16 10 (0.27%) VBA
17 9 (0.25%) PL/SQL
18 8 (0.22%) Kotlin
19 7 (0.19%) Swift
Qualifications
1 1,107 (30.34%) Degree
2 760 (20.83%) Computer Science Degree
3 247 (6.77%) AWS Certification
4 117 (3.21%) BPSS Clearance
5 99 (2.71%) Security Cleared
6 76 (2.08%) Master's Degree
6 76 (2.08%) SC Cleared
7 67 (1.84%) Azure Certification
8 62 (1.70%) CISSP
9 42 (1.15%) DBS Check
10 38 (1.04%) CISM
11 37 (1.01%) Microsoft Certification
12 32 (0.88%) PMI Certification
13 28 (0.77%) PMP
14 27 (0.74%) TOGAF Certification
15 23 (0.63%) Chartered Engineer
15 23 (0.63%) DV Cleared
16 22 (0.60%) AWS Certified Solutions Architect
17 19 (0.52%) Cisco Certification
18 18 (0.49%) PhD
Quality Assurance & Compliance
1 151 (4.14%) ISO/IEC 27001
2 138 (3.78%) NIST
3 84 (2.30%) GDPR
4 66 (1.81%) QA
5 53 (1.45%) Accessibility
6 49 (1.34%) Data Quality
7 38 (1.04%) Cyber Essentials
8 37 (1.01%) MiFID
9 22 (0.60%) PMO
10 20 (0.55%) Sarbanes-Oxley
10 20 (0.55%) SLA
11 18 (0.49%) California Consumer Privacy Act
11 18 (0.49%) PCI DSS
12 17 (0.47%) Cyber Essentials PLUS
13 15 (0.41%) HIPAA
14 13 (0.36%) NCSC
14 13 (0.36%) SOC 2
15 11 (0.30%) COBIT
15 11 (0.30%) NIST 800
16 10 (0.27%) GxP
System Software
1 311 (8.52%) Docker
2 145 (3.97%) Active Directory
3 53 (1.45%) Virtual Machines
4 25 (0.69%) VMware Infrastructure
5 19 (0.52%) Virtual Desktop
6 4 (0.11%) Virtual Servers
7 2 (0.055%) HDFS
7 2 (0.055%) Hyper-V
7 2 (0.055%) KVM
7 2 (0.055%) vSphere
7 2 (0.055%) Xen
8 1 (0.027%) Forefront TMG
8 1 (0.027%) ISA Server
Systems Management
1 394 (10.80%) Terraform
2 323 (8.85%) Kubernetes
3 254 (6.96%) Ansible
4 231 (6.33%) Prometheus
5 217 (5.95%) Argo
5 217 (5.95%) Kustomize
6 35 (0.96%) Microsoft Intune
7 27 (0.74%) Single Sign-On
8 20 (0.55%) Grafana
9 16 (0.44%) Puppet
10 13 (0.36%) Progress Chef
11 9 (0.25%) CASB
12 7 (0.19%) NetBackup
13 5 (0.14%) Systems Management Server (SMS)
14 4 (0.11%) Automic
14 4 (0.11%) FortiGate
14 4 (0.11%) Jamf Pro
15 3 (0.082%) EMC VPLEX
15 3 (0.082%) SCCM
16 2 (0.055%) CFEngine
Vendors
1 493 (13.51%) Microsoft
2 366 (10.03%) Google
3 179 (4.91%) Salesforce
4 163 (4.47%) ServiceNow
5 152 (4.17%) SAP
6 82 (2.25%) Thales
7 77 (2.11%) Databricks
8 73 (2.00%) Oracle
9 53 (1.45%) Cisco
10 45 (1.23%) OpenAI
11 43 (1.18%) IBM
12 37 (1.01%) VMware
13 33 (0.90%) Meraki
14 25 (0.69%) Fortinet
15 24 (0.66%) Palo Alto
16 22 (0.60%) Adobe
17 18 (0.49%) Dell
17 18 (0.49%) Workday
18 16 (0.44%) Citrix
18 16 (0.44%) YouTube