A/B Testing
UK
The table below provides summary statistics for permanent job vacancies requiring A/B Testing skills. It includes a benchmarking guide to the annual salaries offered in vacancies that cited A/B Testing over the 6 months leading up to 30 May 2025, comparing them to the same period in the previous two years.
| 6 months to 30 May 2025 |
Same period 2024 | Same period 2023 | |
|---|---|---|---|
| Rank | 599 | 732 | 757 |
| Rank change year-on-year | +133 | +25 | -256 |
| Permanent jobs citing A/B Testing | 110 | 182 | 205 |
| As % of all permanent jobs advertised in the UK | 0.20% | 0.18% | 0.21% |
| As % of the Processes & Methodologies category | 0.21% | 0.21% | 0.22% |
| Number of salaries quoted | 55 | 131 | 103 |
| 10th Percentile | £31,250 | £31,250 | £32,700 |
| 25th Percentile | £37,500 | £36,250 | £40,750 |
| Median annual salary (50th Percentile) | £52,500 | £47,500 | £55,000 |
| Median % change year-on-year | +10.53% | -13.64% | -12.00% |
| 75th Percentile | £70,834 | £63,750 | £76,250 |
| 90th Percentile | £75,750 | £82,500 | £82,500 |
| UK excluding London median annual salary | £51,250 | £37,500 | £47,500 |
| % change year-on-year | +36.67% | -21.05% | -7.77% |
All Process and Methodology Skills
UK
A/B Testing falls under the Processes and Methodologies category. For comparison with the information above, the following table provides summary statistics for all permanent job vacancies requiring process or methodology skills.
| Permanent vacancies with a requirement for process or methodology skills | 51,902 | 86,889 | 92,846 |
| As % of all permanent jobs advertised in the UK | 93.67% | 84.13% | 95.56% |
| Number of salaries quoted | 25,611 | 60,763 | 54,796 |
| 10th Percentile | £28,822 | £29,250 | £34,000 |
| 25th Percentile | £41,250 | £40,000 | £45,000 |
| Median annual salary (50th Percentile) | £57,443 | £55,000 | £60,899 |
| Median % change year-on-year | +4.44% | -9.69% | +1.50% |
| 75th Percentile | £75,000 | £72,500 | £81,250 |
| 90th Percentile | £97,500 | £92,500 | £100,000 |
| UK excluding London median annual salary | £51,574 | £50,000 | £55,000 |
| % change year-on-year | +3.15% | -9.09% | +4.76% |
A/B Testing
Job Vacancy Trend
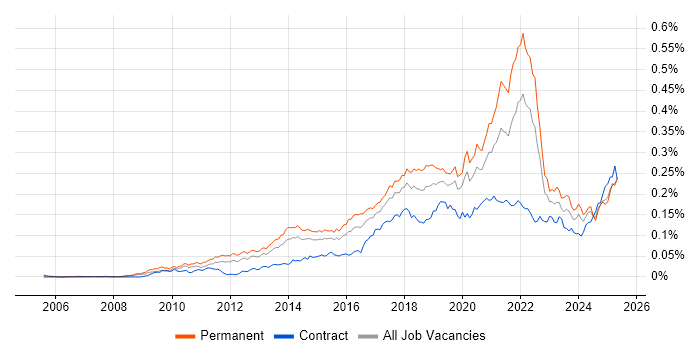
Job postings citing A/B Testing as a proportion of all IT jobs advertised.

A/B Testing
Salary Trend
3-month moving average salary quoted in jobs citing A/B Testing.
A/B Testing
Salary Histogram
Salary distribution for jobs citing A/B Testing over the 6 months to 30 May 2025.
A/B Testing
Top 15 Job Locations
The table below looks at the demand and provides a guide to the median salaries quoted in IT jobs citing A/B Testing within the UK over the 6 months to 30 May 2025. The 'Rank Change' column provides an indication of the change in demand within each location based on the same 6 month period last year.
| Location | Rank Change on Same Period Last Year |
Matching Permanent IT Job Ads |
Median Salary Past 6 Months |
Median Salary % Change on Same Period Last Year |
Live Jobs |
|---|---|---|---|---|---|
| England | +80 | 102 | £55,000 | +15.79% | 1,552 |
| UK excluding London | +116 | 54 | £51,250 | +36.67% | 1,559 |
| London | +114 | 48 | £60,000 | -4.00% | 213 |
| Work from Home | +86 | 35 | £60,000 | +60.00% | 994 |
| Midlands | +91 | 18 | £52,500 | +5.00% | 291 |
| North of England | +12 | 13 | £45,000 | - | 353 |
| West Midlands | +58 | 12 | £52,500 | +5.00% | 151 |
| South East | +54 | 10 | £43,750 | +16.67% | 453 |
| North West | -21 | 10 | £45,000 | -16.28% | 182 |
| South West | +90 | 6 | £69,018 | +112.36% | 173 |
| East Midlands | +51 | 6 | £47,500 | -9.52% | 121 |
| East of England | - | 5 | £48,750 | - | 210 |
| Scotland | +119 | 2 | - | - | 73 |
| Yorkshire | +49 | 2 | £48,000 | +81.13% | 132 |
| North East | - | 1 | £50,000 | - | 40 |
A/B Testing
Co-occurring Skills and Capabilities by Category
The follow tables expand on the table above by listing co-occurrences grouped by category. The same employment type, locality and period is covered with up to 20 co-occurrences shown in each of the following categories:
|
|
||||||||||||||||||||||||||||||||||||||||||||||||||||||||||||||||||||||||||||||||||||||||||||||||||||||||||||||||||||||||||||||
|
|
||||||||||||||||||||||||||||||||||||||||||||||||||||||||||||||||||||||||||||||||||||||||||||||||||||||||||||||||||||||||||||||
|
|
||||||||||||||||||||||||||||||||||||||||||||||||||||||||||||||||||||||||||||||||||||||||||||||||||||||||||||||||||||||||||||||
|
|
||||||||||||||||||||||||||||||||||||||||||||||||||||||||||||||||||||||||||||||||||||||||||||||||||||||||||||||||||||||||||||||
|
|
||||||||||||||||||||||||||||||||||||||||||||||||||||||||||||||||||||||||||||||||||||||||||||||||||||||||||||||||||||||||||||||
|
|
||||||||||||||||||||||||||||||||||||||||||||||||||||||||||||||||||||||||||||||||||||||||||||||||||||||||||||||||||||||||||||||
|
|
||||||||||||||||||||||||||||||||||||||||||||||||||||||||||||||||||||||||||||||||||||||||||||||||||||||||||||||||||||||||||||||
|
|
||||||||||||||||||||||||||||||||||||||||||||||||||||||||||||||||||||||||||||||||||||||||||||||||||||||||||||||||||||||||||||||
|
|
||||||||||||||||||||||||||||||||||||||||||||||||||||||||||||||||||||||||||||||||||||||||||||||||||||||||||||||||||||||||||||||
