Budgeting
UK

The following table provides summary statistics for permanent job vacancies with a requirement for Budgeting skills. Included is a benchmarking guide to the salaries offered in vacancies that have cited Budgeting over the 6 months to 9 May 2024 with a comparison to the same period in the previous 2 years.

6 months to
9 May 2024
Same period 2023 Same period 2022
Rank 304 522 594
Rank change year-on-year +218 +72 -14
Permanent jobs citing Budgeting 942 541 817
As % of all permanent jobs advertised in the UK 0.95% 0.53% 0.52%
As % of the Processes & Methodologies category 1.11% 0.56% 0.54%
Number of salaries quoted 345 346 428
10th Percentile £33,000 £35,000 £41,250
25th Percentile £42,500 £48,000 £50,938
Median annual salary (50th Percentile) £54,900 £65,000 £65,000
Median % change year-on-year -15.54% - +13.04%
75th Percentile £72,500 £87,500 £120,000
90th Percentile £91,400 £160,000 £162,500
UK excluding London median annual salary £53,500 £55,000 £53,112
% change year-on-year -2.73% +3.55% +1.17%

All Process and Methodology Skills
UK

Budgeting is in the Processes and Methodologies category. The following table is for comparison with the above and provides summary statistics for all permanent job vacancies with a requirement for process or methodology skills.

Permanent vacancies with a requirement for process or methodology skills 84,809 96,894 150,102
As % of all permanent jobs advertised in the UK 85.57% 95.61% 95.67%
Number of salaries quoted 59,843 56,945 82,179
10th Percentile £29,000 £34,000 £33,500
25th Percentile £40,000 £45,000 £43,750
Median annual salary (50th Percentile) £55,000 £61,180 £60,000
Median % change year-on-year -10.10% +1.97% +9.09%
75th Percentile £72,500 £81,250 £80,000
90th Percentile £92,500 £100,000 £96,550
UK excluding London median annual salary £50,000 £55,000 £52,500
% change year-on-year -9.09% +4.76% +9.38%

Budgeting
Job Vacancy Trend

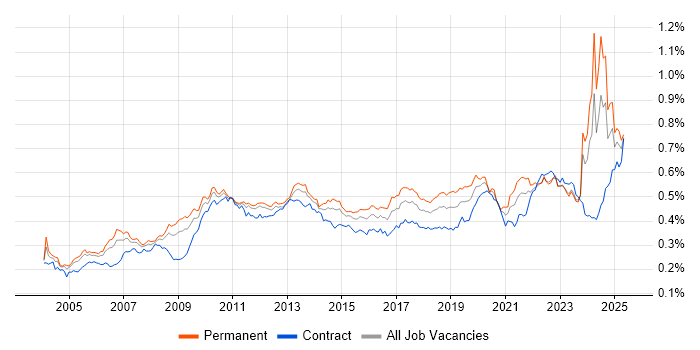
Job postings citing Budgeting as a proportion of all IT jobs advertised.

Job vacancy trend for Budgeting in the UK

Budgeting
Salary Trend

3-month moving average salary quoted in jobs citing Budgeting.

Salary trend for Budgeting in the UK

Budgeting
Salary Histogram

Salary distribution for jobs citing Budgeting over the 6 months to 9 May 2024.

Salary histogram for Budgeting in the UK

Budgeting
Top 18 Job Locations

The table below looks at the demand and provides a guide to the median salaries quoted in IT jobs citing Budgeting within the UK over the 6 months to 9 May 2024. The 'Rank Change' column provides an indication of the change in demand within each location based on the same 6 month period last year.

Location Rank Change
on Same Period
Last Year
Matching
Permanent
IT Job Ads
Median Salary
Past 6 Months
Median Salary
% Change
on Same Period
Last Year
Live
Jobs
England +239 882 £54,950 -15.46% 280
UK excluding London +211 566 £53,500 -2.73% 166
Work from Home +243 544 £60,000 -25.00% 97
London +161 351 £70,000 -17.65% 116
South East +129 261 £57,500 +4.55% 42
North of England +101 96 £47,500 -5.00% 49
Midlands +30 78 £53,500 -17.69% 29
North West +45 57 £53,159 +6.32% 30
West Midlands +42 55 £53,500 -11.93% 12
East of England +45 49 £50,000 -33.33% 23
Scotland -35 41 £89,000 +18.67% 9
South West -4 32 £34,500 -34.29% 21
Yorkshire +92 24 £40,000 +3.23% 13
East Midlands -6 23 £48,000 -26.15% 17
North East +9 14 £47,500 +26.67% 7
Wales +11 10 £57,500 +35.29% 1
Northern Ireland +19 2 £43,750 -2.78%
Channel Islands - 1 £85,000 -

Budgeting
Co-occurring Skills and Capabilities by Category

The follow tables expand on the table above by listing co-occurrences grouped by category. The same employment type, locality and period is covered with up to 20 co-occurrences shown in each of the following categories:

Application Platforms
1 12 (1.27%) Confluence
2 11 (1.17%) ArcGIS
2 11 (1.17%) SharePoint
3 4 (0.42%) CMS
3 4 (0.42%) Microsoft Exchange
4 2 (0.21%) Umbraco
5 1 (0.11%) Oracle Service Bus
5 1 (0.11%) Oracle SOA Suite
5 1 (0.11%) WebLogic
5 1 (0.11%) WordPress
Applications
1 495 (52.55%) Microsoft Excel
2 37 (3.93%) Microsoft Office
3 24 (2.55%) Microsoft Project
4 10 (1.06%) AutoCAD
5 8 (0.85%) Microsoft PowerPoint
6 4 (0.42%) Oracle Smart View
7 2 (0.21%) Spreadsheet
Business Applications
1 17 (1.80%) Dynamics CRM
2 6 (0.64%) Elite 3E
3 5 (0.53%) HFM
4 4 (0.42%) Hyperion Planning
4 4 (0.42%) Primavera
5 2 (0.21%) Dynamics NAV
5 2 (0.21%) Oracle Financial Analyzer
5 2 (0.21%) Unit4 Business World
6 1 (0.11%) Dynamics AX
6 1 (0.11%) NetSuite
6 1 (0.11%) Oracle Assets
6 1 (0.11%) Oracle EBS
6 1 (0.11%) Oracle FAH
6 1 (0.11%) Oracle Payables
6 1 (0.11%) Oracle Receivables
6 1 (0.11%) Relativity
6 1 (0.11%) Workday HCM
Cloud Services
1 48 (5.10%) Azure
1 48 (5.10%) Power Platform
2 42 (4.46%) Microsoft 365
3 24 (2.55%) AWS
4 21 (2.23%) SaaS
5 19 (2.02%) Dynamics 365
6 11 (1.17%) IaaS
6 11 (1.17%) OCI
6 11 (1.17%) PaaS
7 7 (0.74%) Entra ID
8 5 (0.53%) Azure DevOps
8 5 (0.53%) OneDrive
9 4 (0.42%) PowerApps
9 4 (0.42%) WhatsApp
10 3 (0.32%) Azure Monitor
10 3 (0.32%) Nutanix
11 2 (0.21%) Asana
11 2 (0.21%) Google Workspace
12 1 (0.11%) Amazon S3
12 1 (0.11%) Cloud Computing
Communications & Networking
1 447 (47.45%) Broadband
2 14 (1.49%) Network Security
3 10 (1.06%) Firewall
4 6 (0.64%) WAN
5 5 (0.53%) LAN
5 5 (0.53%) MPLS
5 5 (0.53%) SNMP
5 5 (0.53%) Wi-Fi
6 3 (0.32%) DNS
6 3 (0.32%) Fibre Channel
6 3 (0.32%) SAN
6 3 (0.32%) TCP/IP
7 2 (0.21%) HTTP
7 2 (0.21%) Internet
7 2 (0.21%) Intranet
7 2 (0.21%) iSCSI
7 2 (0.21%) NAS
7 2 (0.21%) VoIP
7 2 (0.21%) VPN
7 2 (0.21%) Wireless
Database & Business Intelligence
1 47 (4.99%) Power BI
2 12 (1.27%) SQL Server
3 9 (0.96%) Oracle Reports
4 7 (0.74%) Big Data
5 6 (0.64%) SAP HANA
6 5 (0.53%) MySQL
7 4 (0.42%) BusinessObjects
7 4 (0.42%) Tableau
8 3 (0.32%) Data Warehouse
8 3 (0.32%) Hadoop
8 3 (0.32%) SQL Server Reporting Services
9 2 (0.21%) PostgreSQL
10 1 (0.11%) Amazon Redshift
10 1 (0.11%) EDMS
10 1 (0.11%) EDRMS
10 1 (0.11%) GIS
10 1 (0.11%) Looker
10 1 (0.11%) Oracle Database 12c
10 1 (0.11%) Relational Database
10 1 (0.11%) Spatial Data
Development Applications
1 15 (1.59%) JIRA
2 2 (0.21%) Eclipse
General
1 732 (77.71%) Finance
2 657 (69.75%) Social Skills
3 545 (57.86%) Analytical Skills
4 465 (49.36%) Influencing Skills
5 64 (6.79%) Legal
6 54 (5.73%) Organisational Skills
7 53 (5.63%) Marketing
8 50 (5.31%) Inclusion and Diversity
9 42 (4.46%) Law
10 34 (3.61%) Retail
11 32 (3.40%) Presentation Skills
12 24 (2.55%) Manufacturing
13 19 (2.02%) Telecoms
14 15 (1.59%) Public Sector
15 14 (1.49%) Environmental Health
15 14 (1.49%) Pharmaceutical
16 11 (1.17%) Banking
17 10 (1.06%) Billing
17 10 (1.06%) General Ledger
18 8 (0.85%) Games
Job Titles
1 529 (56.16%) Analyst
2 277 (29.41%) Senior
3 234 (24.84%) Senior Analyst
4 143 (15.18%) Financial Analyst
5 139 (14.76%) Commercial Analyst
6 94 (9.98%) Project Manager
7 52 (5.52%) IT Manager
8 30 (3.18%) Senior Manager
9 28 (2.97%) Consultant
10 27 (2.87%) Lead
11 21 (2.23%) Architect
12 18 (1.91%) Services Director
12 18 (1.91%) Solutions Architect
13 13 (1.38%) Senior Project Manager
14 12 (1.27%) Dynamics 365 Architect
14 12 (1.27%) Dynamics 365 Solution Architect
14 12 (1.27%) Head of IT
14 12 (1.27%) Technical Manager
15 11 (1.17%) Senior IT Manager
16 10 (1.06%) Data Analyst
Libraries, Frameworks & Software Standards
1 10 (1.06%) REST
2 8 (0.85%) SOAP
3 5 (0.53%) .NET
3 5 (0.53%) NETCONF
4 3 (0.32%) CSS
4 3 (0.32%) EDI
4 3 (0.32%) HTML
4 3 (0.32%) Oracle Fusion
4 3 (0.32%) Web Services
4 3 (0.32%) YAML
5 2 (0.21%) .NET Core
5 2 (0.21%) Flash
5 2 (0.21%) LDAP
5 2 (0.21%) SAML
5 2 (0.21%) ServiceStack
6 1 (0.11%) ADO
6 1 (0.11%) J2EE
6 1 (0.11%) React
6 1 (0.11%) XML
6 1 (0.11%) XML Messaging
Miscellaneous
1 76 (8.07%) Management Information System
2 30 (3.18%) Self-Motivation
3 16 (1.70%) Data Centre
4 15 (1.59%) Driving Licence
5 14 (1.49%) NHS
6 13 (1.38%) Renewable Energy
6 13 (1.38%) Social Media
7 10 (1.06%) FMCG
8 9 (0.96%) Enterprise Software
8 9 (0.96%) SCADA
9 8 (0.85%) Legacy Systems
10 7 (0.74%) IoT
10 7 (0.74%) Market Risk
11 6 (0.64%) Algorithms
11 6 (0.64%) Cyber Defence
12 5 (0.53%) Cyber Threat
12 5 (0.53%) Greenfield Project
13 4 (0.42%) e-Learning
13 4 (0.42%) Photovoltaics
14 3 (0.32%) Product Ownership
Operating Systems
1 26 (2.76%) Windows
2 9 (0.96%) Windows Server
3 7 (0.74%) Windows Server 2019
4 6 (0.64%) Mac OS
5 4 (0.42%) Windows 10
5 4 (0.42%) Windows Vista
6 2 (0.21%) Linux
6 2 (0.21%) Unix
6 2 (0.21%) Windows Server 2016
7 1 (0.11%) Android
7 1 (0.11%) Apple iOS
7 1 (0.11%) Solaris
Processes & Methodologies
1 560 (59.45%) Budgeting and Forecasting
2 532 (56.48%) Agile
3 527 (55.94%) Decision-Making
4 495 (52.55%) Mentoring
5 457 (48.51%) Business Case
6 453 (48.09%) Actionable Insight
7 194 (20.59%) Project Management
8 115 (12.21%) Problem-Solving
9 94 (9.98%) Budget Management
10 91 (9.66%) Continuous Improvement
11 73 (7.75%) Project Delivery
12 58 (6.16%) Stakeholder Management
13 56 (5.94%) Business Intelligence
14 54 (5.73%) Roadmaps
15 51 (5.41%) Information Security
15 51 (5.41%) Risk Management
16 41 (4.35%) Cybersecurity
16 41 (4.35%) ERP
17 40 (4.25%) Change Management
17 40 (4.25%) Customer Service
Programming Languages
1 34 (3.61%) SQL
2 12 (1.27%) Python
3 7 (0.74%) T-SQL
4 6 (0.64%) Java
4 6 (0.64%) JavaScript
4 6 (0.64%) PowerShell
5 4 (0.42%) R
5 4 (0.42%) VBA
6 3 (0.32%) Bash
7 2 (0.21%) C#
7 2 (0.21%) Perl
7 2 (0.21%) Shell Script
7 2 (0.21%) X++
8 1 (0.11%) AWK
8 1 (0.11%) Bourne shell
8 1 (0.11%) Julia
8 1 (0.11%) Korn
8 1 (0.11%) VB
Qualifications
1 473 (50.21%) ACCA
1 473 (50.21%) CIMA
2 116 (12.31%) Degree
3 19 (2.02%) Security Cleared
4 18 (1.91%) DBS Check
5 13 (1.38%) Master's Degree
5 13 (1.38%) Microsoft Certification
6 11 (1.17%) SC Cleared
7 8 (0.85%) HNC
7 8 (0.85%) PMI Certification
8 7 (0.74%) BPSS Clearance
9 6 (0.64%) Azure Certification
9 6 (0.64%) PMP
9 6 (0.64%) PRINCE2 Certification
10 4 (0.42%) APMP
10 4 (0.42%) Computer Science Degree
10 4 (0.42%) Postgraduate
11 3 (0.32%) ITIL Certification
11 3 (0.32%) RIBA
12 2 (0.21%) HND
Quality Assurance & Compliance
1 40 (4.25%) GDPR
2 24 (2.55%) ISO/IEC 27001
3 23 (2.44%) QA
4 16 (1.70%) PMO
5 14 (1.49%) SLA
6 12 (1.27%) NEBOSH
7 11 (1.17%) NIST
8 8 (0.85%) ITGC
9 7 (0.74%) ISO 9001
9 7 (0.74%) NCSC
10 6 (0.64%) GRC
10 6 (0.64%) NIST 800
11 5 (0.53%) HIPAA
12 4 (0.42%) COSHH
12 4 (0.42%) IEC 62304
12 4 (0.42%) ISO 13485
13 3 (0.32%) Cyber Essentials
14 2 (0.21%) Accessibility
14 2 (0.21%) Actionable Recommendations
14 2 (0.21%) COBIT
System Software
1 14 (1.49%) Active Directory
2 5 (0.53%) Docker
3 3 (0.32%) Hyper-V
3 3 (0.32%) VMware Infrastructure
4 2 (0.21%) NFS
4 2 (0.21%) vSphere
5 1 (0.11%) Virtual Machines
Systems Management
1 9 (0.96%) Terraform
2 8 (0.85%) Microsoft Intune
3 5 (0.53%) Jamf Pro
3 5 (0.53%) Kubernetes
4 4 (0.42%) ZABBIX
5 2 (0.21%) Active Directory Federation Services
6 1 (0.11%) Ansible
6 1 (0.11%) IBM BigFix
6 1 (0.11%) NetBackup
6 1 (0.11%) Oracle Identity Management
6 1 (0.11%) Oracle ZFS
6 1 (0.11%) Red Hat Satellite
6 1 (0.11%) Tivoli
6 1 (0.11%) yum
Vendors
1 544 (57.75%) Microsoft
2 24 (2.55%) SAP
3 18 (1.91%) Oracle
4 15 (1.59%) ServiceNow
5 10 (1.06%) Autodesk
6 9 (0.96%) Hyperion
7 7 (0.74%) Salesforce
7 7 (0.74%) VMware
8 5 (0.53%) Google
9 4 (0.42%) IBM
9 4 (0.42%) Tanium
10 3 (0.32%) Citrix
11 2 (0.21%) Acronis
11 2 (0.21%) Aderant
11 2 (0.21%) Anaplan
11 2 (0.21%) Brocade
11 2 (0.21%) Cisco
11 2 (0.21%) Meraki
11 2 (0.21%) Siebel
11 2 (0.21%) WatchGuard