Senior Development Operations
UK

The median Senior Development Operations salary in the UK is £80,000 per year according to job vacancies posted during the 6 months to 5 December 2023.

The first table below provides salary benchmarking and summary statistics including a comparison to same period in the previous 2 years.

6 months to
5 Dec 2023
Same period 2022 Same period 2021
Rank 401 458 497
Rank change year-on-year +57 +39 -166
Permanent jobs requiring a Senior DevOps 374 863 805
As % of all permanent jobs advertised in the UK 0.70% 0.70% 0.63%
As % of the Job Titles category 0.73% 0.73% 0.66%
Number of salaries quoted 333 548 568
10th Percentile £57,500 £61,250 £60,000
25th Percentile £66,250 £68,750 £67,500
Median annual salary (50th Percentile) £80,000 £82,500 £80,000
Median % change year-on-year -3.03% +3.13% +10.34%
75th Percentile £105,000 £92,500 £91,250
90th Percentile £116,000 £102,500 £100,000
UK excluding London median annual salary £70,576 £80,000 £70,000
% change year-on-year -11.78% +14.29% +16.67%

All Permanent IT Job Vacancies
UK

The following table is for comparison with the above and includes summary statistics for all permanent IT job vacancies. Most job vacancies include a discernible job title that can be normalized. As such, the figures in the second row provide an indication of the number of permanent jobs in our overall sample.

Permanent vacancies in the UK with a recognized job title 50,985 118,425 121,174
% of permanent jobs with a recognized job title 95.43% 95.37% 95.14%
Number of salaries quoted 37,346 74,222 83,417
10th Percentile £31,250 £32,750 £32,000
25th Percentile £42,500 £45,000 £42,500
Median annual salary (50th Percentile) £60,000 £60,000 £57,500
Median % change year-on-year - +4.35% +4.55%
75th Percentile £80,000 £81,250 £77,500
90th Percentile £97,500 £98,750 £95,000
UK excluding London median annual salary £52,500 £52,500 £50,000
% change year-on-year - +5.00% +5.26%

Senior DevOps
Job Vacancy Trend

Job postings that featured Senior DevOps in the job title as a proportion of all IT jobs advertised.
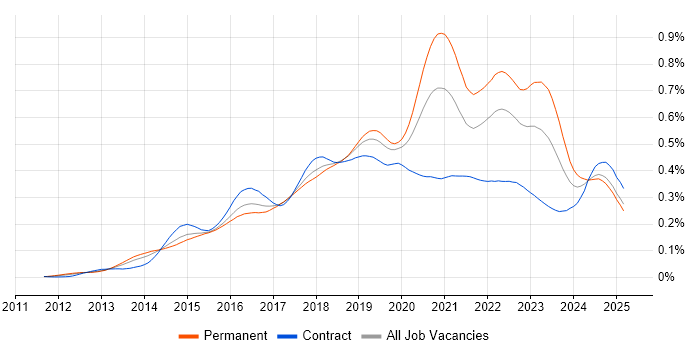
Job vacancy trend for Senior DevOps in the UK

Senior DevOps
Salary Trend

3-month moving average salary quoted in jobs citing Senior DevOps.

Salary trend for Senior DevOps in the UK

Senior DevOps
Salary Histogram

Salary distribution for jobs citing Senior DevOps over the 6 months to 5 December 2023.

Salary histogram for Senior DevOps in the UK

Senior DevOps
Top 16 Job Locations

The table below looks at the demand and provides a guide to the median salaries quoted in IT jobs citing Senior DevOps within the UK over the 6 months to 5 December 2023. The 'Rank Change' column provides an indication of the change in demand within each location based on the same 6 month period last year.

Location Rank Change
on Same Period
Last Year
Matching
Permanent
IT Job Ads
Median Salary
Past 6 Months
Median Salary
% Change
on Same Period
Last Year
Live
Jobs
England +60 335 £84,000 -1.18% 70
Work from Home +120 213 £79,632 -3.48% 31
London +41 197 £90,000 +4.35% 33
UK excluding London +130 154 £70,576 -11.78% 44
North of England +116 52 £72,000 -8.57% 20
Yorkshire +115 30 £71,288 -8.02% 8
South East +113 25 £67,500 -15.63% 13
Midlands +110 25 £67,500 -18.18% 3
South West +83 24 £77,316 +6.64% 2
West Midlands +117 19 £67,500 -18.18% 2
Scotland +56 19 £70,576 -11.78% 2
North West +90 17 £79,632 -8.99% 8
East Midlands +32 6 £70,000 - 1
Wales +16 6 £58,583 -9.87% 2
North East +35 5 £67,500 -10.00% 6
East of England +104 3 £61,750 -31.39% 3

Senior DevOps Skill Set
Top 30 Co-occurring Skills and Capabilities

For the 6 months to 5 December 2023, Senior DevOps job roles required the following skills and capabilities in order of popularity. The figures indicate the absolute number co-occurrences and as a proportion of all permanent job ads featuring Senior DevOps in the job title.

1 374 (100.00%) DevOps
2 253 (67.65%) Terraform
3 209 (55.88%) CI/CD
4 207 (55.35%) Infrastructure as Code
5 197 (52.67%) Kubernetes
6 168 (44.92%) Python
7 161 (43.05%) AWS
8 153 (40.91%) Docker
9 152 (40.64%) Agile
10 151 (40.37%) Ansible
11 133 (35.56%) Azure
12 123 (32.89%) Finance
13 110 (29.41%) Jenkins
14 102 (27.27%) Linux
15 77 (20.59%) Containerisation
16 75 (20.05%) GCP
17 74 (19.79%) Banking
18 73 (19.52%) Bash
18 73 (19.52%) Java
19 66 (17.65%) Mentoring
20 64 (17.11%) PowerShell
21 62 (16.58%) Configuration Management
22 61 (16.31%) Problem-Solving
23 60 (16.04%) Azure DevOps
24 56 (14.97%) Puppet
24 56 (14.97%) Social Skills
25 53 (14.17%) Serverless
26 52 (13.90%) Software Engineering
27 47 (12.57%) Git
28 46 (12.30%) Prometheus

Senior DevOps Skill Set
Co-occurring Skills and Capabilities by Category

The follow tables expand on the table above by listing co-occurrences grouped by category. The same employment type, locality and period is covered with up to 20 co-occurrences shown in each of the following categories:

Application Platforms
1 31 (8.29%) Confluence
2 7 (1.87%) Apache
3 5 (1.34%) nginx
4 4 (1.07%) Apache Airflow
5 3 (0.80%) CMS
6 2 (0.53%) Drupal
7 1 (0.27%) Apache Solr
7 1 (0.27%) Cloud Foundry
7 1 (0.27%) Headless CMS
7 1 (0.27%) IIS
7 1 (0.27%) OpenStack
7 1 (0.27%) WordPress
Business Applications
1 1 (0.27%) Dynamics CRM
1 1 (0.27%) Endur
Cloud Services
1 161 (43.05%) AWS
2 133 (35.56%) Azure
3 75 (20.05%) GCP
4 60 (16.04%) Azure DevOps
5 53 (14.17%) Serverless
6 45 (12.03%) GitHub
7 36 (9.63%) AWS CloudFormation
8 32 (8.56%) Azure AKS
9 29 (7.75%) Datadog
10 28 (7.49%) Azure Monitor
11 22 (5.88%) OpenShift
11 22 (5.88%) SaaS
12 20 (5.35%) Google Kubernetes Engine
13 16 (4.28%) Pulumi
14 14 (3.74%) Amazon EC2
14 14 (3.74%) AWS Lambda
15 13 (3.48%) Amazon S3
16 12 (3.21%) Amazon CloudWatch
16 12 (3.21%) GitHub Actions
17 11 (2.94%) PaaS
Communications & Networking
1 39 (10.43%) Firewall
2 28 (7.49%) F5 BIG-IP GTM
2 28 (7.49%) F5 BIG-IP LTM
3 18 (4.81%) Internet
4 13 (3.48%) DNS
5 8 (2.14%) TCP/IP
6 6 (1.60%) WAN
7 4 (1.07%) IPFIX
7 4 (1.07%) Reverse Proxy
7 4 (1.07%) VPN
8 3 (0.80%) HTTP
8 3 (0.80%) SNMP
8 3 (0.80%) tcpdump
9 2 (0.53%) Converged Networks
9 2 (0.53%) VoIP
10 1 (0.27%) DHCP
10 1 (0.27%) Fibre Channel
10 1 (0.27%) Intrusion Detection
10 1 (0.27%) LAN
10 1 (0.27%) SSL
Database & Business Intelligence
1 16 (4.28%) Apache Cassandra
2 15 (4.01%) MongoDB
3 14 (3.74%) MySQL
4 13 (3.48%) NoSQL
5 12 (3.21%) Big Data
5 12 (3.21%) DynamoDB
6 11 (2.94%) Amazon RDS
6 11 (2.94%) Amazon Redshift
7 10 (2.67%) BigQuery
8 9 (2.41%) SQL Server
9 7 (1.87%) PostgreSQL
10 5 (1.34%) Relational Database
11 4 (1.07%) ArangoDB
11 4 (1.07%) Azure SQL Database
11 4 (1.07%) Elasticsearch
11 4 (1.07%) Hadoop
12 3 (0.80%) Data Lake
12 3 (0.80%) Data Warehouse
13 2 (0.53%) Bigtable
14 1 (0.27%) MariaDB
Development Applications
1 110 (29.41%) Jenkins
2 47 (12.57%) Git
3 39 (10.43%) JIRA
4 34 (9.09%) GitLab
5 29 (7.75%) Bitbucket
6 28 (7.49%) SonarQube
7 26 (6.95%) IBM UrbanCode
8 19 (5.08%) CircleCI
9 18 (4.81%) Sonatype Nexus
9 18 (4.81%) Team Foundation Server
10 15 (4.01%) Artifactory
11 14 (3.74%) TeamCity
12 9 (2.41%) Atlassian Bamboo
12 9 (2.41%) Cucumber
12 9 (2.41%) Maven
12 9 (2.41%) Selenium
13 7 (1.87%) Travis CI
14 6 (1.60%) Octopus Deploy
15 5 (1.34%) Gradle
15 5 (1.34%) Zephyr
General
1 123 (32.89%) Finance
2 74 (19.79%) Banking
3 56 (14.97%) Social Skills
4 45 (12.03%) Retail
5 15 (4.01%) Organisational Skills
6 14 (3.74%) Retail Banking
7 13 (3.48%) Public Sector
8 12 (3.21%) Analytical Skills
8 12 (3.21%) Telecoms
9 9 (2.41%) Electronics
9 9 (2.41%) Inclusion and Diversity
10 8 (2.14%) Marketing
10 8 (2.14%) Tech for Good
11 7 (1.87%) Presentation Skills
12 6 (1.60%) Financial Institution
13 4 (1.07%) Advertising
14 3 (0.80%) Health Technology
14 3 (0.80%) Manufacturing
14 3 (0.80%) Pharmaceutical
15 2 (0.53%) Aviation
Libraries, Frameworks & Software Standards
1 31 (8.29%) .NET
2 28 (7.49%) Spine.js
3 23 (6.15%) ARM Templates
4 16 (4.28%) YAML
5 15 (4.01%) .NET Core
6 14 (3.74%) Elastic Stack
6 14 (3.74%) Kafka
6 14 (3.74%) Node.js
7 10 (2.67%) JSON
8 9 (2.41%) .NET Framework
9 7 (1.87%) Next.js
10 6 (1.60%) React
11 5 (1.34%) LAMP
11 5 (1.34%) REST
12 4 (1.07%) NETCONF
12 4 (1.07%) OpenID
12 4 (1.07%) SAML
12 4 (1.07%) YANG
13 3 (0.80%) Azure Blueprints
13 3 (0.80%) Lightning Web Components
Miscellaneous
1 42 (11.23%) Cloud Native
2 32 (8.56%) Data Centre
3 21 (5.61%) Public Cloud
4 15 (4.01%) Management Information System
5 14 (3.74%) Linux Command Line
5 14 (3.74%) Online Banking
5 14 (3.74%) Robotics
6 12 (3.21%) Greenfield Project
6 12 (3.21%) Product Ownership
7 8 (2.14%) Distributed Systems
7 8 (2.14%) Mobile App
7 8 (2.14%) Self-Motivation
7 8 (2.14%) Virtual Team
8 7 (1.87%) Legacy Applications
8 7 (1.87%) Tandem
9 5 (1.34%) Algorithms
9 5 (1.34%) PKI
9 5 (1.34%) Private Cloud
10 3 (0.80%) Clustering
10 3 (0.80%) Onboarding
Operating Systems
1 102 (27.27%) Linux
2 23 (6.15%) Windows
3 14 (3.74%) Unix
4 6 (1.60%) Ubuntu
5 4 (1.07%) Windows Server
6 3 (0.80%) Debian
6 3 (0.80%) VMS
7 2 (0.53%) CentOS
7 2 (0.53%) Windows Server 2019
8 1 (0.27%) Mac OS
8 1 (0.27%) Red Hat Enterprise Linux
Processes & Methodologies
1 374 (100.00%) DevOps
2 209 (55.88%) CI/CD
3 207 (55.35%) Infrastructure as Code
4 152 (40.64%) Agile
5 77 (20.59%) Containerisation
6 66 (17.65%) Mentoring
7 62 (16.58%) Configuration Management
8 61 (16.31%) Problem-Solving
9 52 (13.90%) Software Engineering
10 40 (10.70%) Microservices
11 37 (9.89%) Cloud Security
12 36 (9.63%) DevSecOps
13 35 (9.36%) Problem Management
14 34 (9.09%) Analytics
15 33 (8.82%) Fintech
15 33 (8.82%) Software Delivery
16 32 (8.56%) SDLC
16 32 (8.56%) Site Reliability Engineering
16 32 (8.56%) Test Automation
17 31 (8.29%) Design Patterns
Programming Languages
1 168 (44.92%) Python
2 73 (19.52%) Bash
2 73 (19.52%) Java
3 64 (17.11%) PowerShell
4 38 (10.16%) SQL
5 34 (9.09%) Groovy
6 32 (8.56%) JavaScript
7 31 (8.29%) Ruby
8 23 (6.15%) C#
9 19 (5.08%) Bicep
9 19 (5.08%) Go
10 12 (3.21%) Shell Script
11 9 (2.41%) Perl
11 9 (2.41%) PHP
12 8 (2.14%) TypeScript
13 6 (1.60%) Scala
14 5 (1.34%) SOQL
15 4 (1.07%) C++
15 4 (1.07%) PL/SQL
16 3 (0.80%) Apex Code
Qualifications
1 36 (9.63%) Security Cleared
2 32 (8.56%) Degree
3 29 (7.75%) SC Cleared
4 20 (5.35%) AWS Certification
5 17 (4.55%) Computer Science Degree
6 15 (4.01%) Azure Certification
7 11 (2.94%) AWS Certified DevOps Engineer
8 9 (2.41%) Master's Degree
8 9 (2.41%) Microsoft Certification
9 7 (1.87%) AWS Certified SysOps Administrator
10 4 (1.07%) BPSS Clearance
10 4 (1.07%) CCNA
10 4 (1.07%) Cisco Certification
10 4 (1.07%) JNCIA
11 2 (0.53%) DV Cleared
11 2 (0.53%) MCSA
11 2 (0.53%) MCSE
11 2 (0.53%) TOGAF Certification
12 1 (0.27%) AWS Certified Solutions Architect
Quality Assurance & Compliance
1 8 (2.14%) ISO/IEC 27001
2 7 (1.87%) QA
3 6 (1.60%) Data Quality
4 4 (1.07%) GDPR
5 3 (0.80%) SLA
6 2 (0.53%) ISO 9001
6 2 (0.53%) NIST
7 1 (0.27%) AUTOSAR
7 1 (0.27%) Cyber Essentials
7 1 (0.27%) ISO/IEC 20000
System Software
1 153 (40.91%) Docker
2 15 (4.01%) VMware Infrastructure
3 9 (2.41%) Active Directory
4 7 (1.87%) Virtual Machines
5 4 (1.07%) Ceph
6 3 (0.80%) VMware ESXi
7 2 (0.53%) vSphere
8 1 (0.27%) Citrix Hypervisor
8 1 (0.27%) Hyper-V
8 1 (0.27%) KVM
8 1 (0.27%) Varnish
Systems Management
1 253 (67.65%) Terraform
2 197 (52.67%) Kubernetes
3 151 (40.37%) Ansible
4 56 (14.97%) Puppet
5 46 (12.30%) Prometheus
6 44 (11.76%) Grafana
7 43 (11.50%) Progress Chef
8 15 (4.01%) Packer
9 14 (3.74%) Nagios
10 10 (2.67%) Istio
11 7 (1.87%) Argo
12 5 (1.34%) Kibana
13 4 (1.07%) Fortio
13 4 (1.07%) Kiali
14 3 (0.80%) Check_MK
14 3 (0.80%) vCenter Server
15 2 (0.53%) Graphite
15 2 (0.53%) HAProxy
15 2 (0.53%) SCOM
16 1 (0.27%) ZABBIX
Vendors
1 34 (9.09%) ServiceNow
2 31 (8.29%) Splunk
3 29 (7.75%) Cisco
3 29 (7.75%) Fortinet
4 28 (7.49%) CheckPoint
4 28 (7.49%) F5
5 24 (6.42%) Microsoft
6 23 (6.15%) Google
7 22 (5.88%) New Relic
7 22 (5.88%) VMware
8 21 (5.61%) IBM
9 19 (5.08%) Veracode
10 13 (3.48%) SaltStack
11 12 (3.21%) Dynatrace
12 8 (2.14%) Salesforce
13 7 (1.87%) Oracle
13 7 (1.87%) Synopsys
14 4 (1.07%) Apple
14 4 (1.07%) Atlassian
15 3 (0.80%) Adobe