Go Jobs with Work from Home Options

Go (Golang)
UK > Work from Home

The table below provides summary statistics for permanent job vacancies with an option to work from home (WFH) and a requirement for Go skills. Included is a benchmarking guide to the salaries offered in vacancies that have cited Go over the 6 months to 4 May 2024 with a comparison to the same period in the previous 2 years.

6 months to
4 May 2024
Same period 2023 Same period 2022
Rank 272 115 80
Rank change year-on-year -157 -35 +39
Permanent jobs citing Go 393 1,253 2,935
As % of all permanent jobs with a WFH option 1.16% 2.95% 4.32%
As % of the Programming Languages category 2.86% 6.02% 7.35%
Number of salaries quoted 283 579 1,773
10th Percentile £48,750 £56,219 £51,750
25th Percentile £53,750 £66,250 £65,000
Median annual salary (50th Percentile) £75,000 £80,000 £80,000
Median % change year-on-year -6.25% - +14.29%
75th Percentile £100,000 £105,000 £95,000
90th Percentile £118,750 £120,000 £105,000
UK median annual salary £75,000 £80,000 £80,000
% change year-on-year -6.25% - +14.29%

All Programming Languages
Work from Home

Go is in the Programming Languages category. The following table is for comparison with the above and provides summary statistics for all permanent job vacancies with a WFH option and a requirement for coding skills.

Permanent vacancies with a requirement for coding skills 13,743 20,831 39,918
As % of all permanent jobs with a WFH option 40.69% 49.12% 58.73%
Number of salaries quoted 11,386 15,327 24,000
10th Percentile £38,750 £41,000 £37,500
25th Percentile £46,250 £50,000 £46,250
Median annual salary (50th Percentile) £60,000 £65,000 £62,500
Median % change year-on-year -7.69% +4.00% +13.64%
75th Percentile £78,750 £85,000 £81,250
90th Percentile £100,000 £105,000 £95,000
UK median annual salary £60,000 £65,000 £62,500
% change year-on-year -7.69% +4.00% +13.64%

Go
Trend for Jobs with a WFH Option

Job vacancies with a work from home option citing Go as a proportion of all IT jobs advertised.
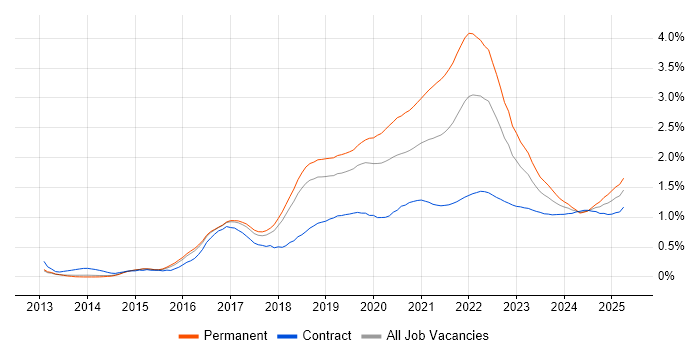
Go trend for jobs with a WFH option

Go
Salary Trend for Jobs with a WFH Option

3-month moving average salary quoted in job vacancies with a work from home option citing Go.

Go salary trend for jobs with a WFH option

Go
Salary Histogram for Jobs with a WFH Option

Salary distribution for jobs with a work from home option citing Go over the 6 months to 4 May 2024.

Go salary histogram for jobs with a WFH option

Go
Co-occurring Skills and Capabilities with WFH Options by Category

The follow tables expand on the table above by listing co-occurrences grouped by category. The same employment type, locality and period is covered with up to 20 co-occurrences shown in each of the following categories:

Application Platforms
1 37 (9.41%) Apache Spark
2 36 (9.16%) Apache Airflow
3 11 (2.80%) Apache
4 7 (1.78%) Confluence
5 5 (1.27%) nginx
6 3 (0.76%) CloudStack
6 3 (0.76%) Jupyter
7 2 (0.51%) SharePoint
8 1 (0.25%) JBoss
8 1 (0.25%) Tomcat
Cloud Services
1 198 (50.38%) AWS
2 108 (27.48%) GCP
3 84 (21.37%) Azure
4 82 (20.87%) Serverless
5 52 (13.23%) GitHub
6 41 (10.43%) SaaS
7 37 (9.41%) Snowflake
8 36 (9.16%) dbt
9 31 (7.89%) Amazon S3
10 30 (7.63%) GitHub Actions
11 25 (6.36%) Amazon SQS
11 25 (6.36%) Azure DevOps
12 24 (6.11%) Slack
13 23 (5.85%) AWS Lambda
13 23 (5.85%) Google Docs
13 23 (5.85%) Lucidchart
13 23 (5.85%) Miro
14 11 (2.80%) Azure AKS
15 10 (2.54%) Azure Monitor
15 10 (2.54%) Datadog
Communications & Networking
1 5 (1.27%) AMQP
1 5 (1.27%) Network Security
2 3 (0.76%) iSCSI
3 2 (0.51%) Broadband
3 2 (0.51%) HTTP
3 2 (0.51%) TCP/IP
4 1 (0.25%) Anycast
4 1 (0.25%) BGP
4 1 (0.25%) DNS
4 1 (0.25%) Firewall
4 1 (0.25%) Internet
4 1 (0.25%) SSL
Database & Business Intelligence
1 86 (21.88%) Relational Database
2 75 (19.08%) PostgreSQL
3 73 (18.58%) Big Data
4 44 (11.20%) Data Lake
4 44 (11.20%) Redis
5 41 (10.43%) RDBMS
6 40 (10.18%) Amazon Athena
6 40 (10.18%) Elasticsearch
7 36 (9.16%) Apache Arrow
7 36 (9.16%) Dremio
7 36 (9.16%) Oracle Database
8 33 (8.40%) MySQL
9 30 (7.63%) Hadoop
10 23 (5.85%) Scylla
11 16 (4.07%) BigQuery
12 13 (3.31%) NoSQL
13 12 (3.05%) SQL Server
14 11 (2.80%) Azure SQL Database
15 10 (2.54%) Flink
15 10 (2.54%) MongoDB
Development Applications
1 111 (28.24%) Git
2 36 (9.16%) JDeveloper
3 27 (6.87%) Jenkins
4 14 (3.56%) GitLab
5 9 (2.29%) JIRA
6 7 (1.78%) Team Foundation Server
7 6 (1.53%) Oracle Forms
8 5 (1.27%) Maven
8 5 (1.27%) Selenium
8 5 (1.27%) SonarQube
9 4 (1.02%) JUnit
10 2 (0.51%) Octopus Deploy
10 2 (0.51%) Sonatype Nexus
10 2 (0.51%) TeamCity
11 1 (0.25%) Bitbucket
11 1 (0.25%) CircleCI
11 1 (0.25%) Cucumber
11 1 (0.25%) Gatling
11 1 (0.25%) Spinnaker
11 1 (0.25%) Vagrant
General
1 117 (29.77%) Finance
2 112 (28.50%) Social Skills
3 33 (8.40%) Inclusion and Diversity
4 23 (5.85%) Retail
5 21 (5.34%) Banking
6 17 (4.33%) Marketing
7 13 (3.31%) Games
8 11 (2.80%) French Language
8 11 (2.80%) Public Sector
9 9 (2.29%) Analytical Skills
9 9 (2.29%) Law
10 8 (2.04%) Legal
11 7 (1.78%) Publishing
12 5 (1.27%) Tech for Good
13 4 (1.02%) Influencing Skills
14 3 (0.76%) Advertising
14 3 (0.76%) Telecoms
15 1 (0.25%) iGaming
15 1 (0.25%) Spanish Language
15 1 (0.25%) Welsh Language
Job Titles
1 128 (32.57%) Developer
2 111 (28.24%) Software Engineer
3 80 (20.36%) Senior
4 46 (11.70%) Senior Developer
5 45 (11.45%) AWS Engineer
6 42 (10.69%) Site Reliability Engineer
7 41 (10.43%) Site Engineer
8 37 (9.41%) Ruby Engineer
9 36 (9.16%) Big Data Engineer
10 33 (8.40%) DevOps Engineer
11 31 (7.89%) Principal Engineer
12 30 (7.63%) Lead
13 25 (6.36%) Full Stack Developer
14 24 (6.11%) Principal Software Engineer
15 18 (4.58%) Senior Software Engineer
16 17 (4.33%) Software Developer
17 16 (4.07%) Cloud Engineer
17 16 (4.07%) Platform Engineer
18 15 (3.82%) Azure Engineer
18 15 (3.82%) Senior Full Stack Developer
Libraries, Frameworks & Software Standards
1 93 (23.66%) Kafka
2 87 (22.14%) Node.js
3 77 (19.59%) gRPC
4 70 (17.81%) React
5 63 (16.03%) GraphQL
6 56 (14.25%) Web Services
7 44 (11.20%) RabbitMQ
8 42 (10.69%) REST
9 36 (9.16%) Protocol Buffers
10 35 (8.91%) CSS
10 35 (8.91%) HTML
11 26 (6.62%) RESTful
12 15 (3.82%) .NET
13 12 (3.05%) CSS3
13 12 (3.05%) HTML5
13 12 (3.05%) jQuery
13 12 (3.05%) Laravel
13 12 (3.05%) OAuth
13 12 (3.05%) Symfony
14 10 (2.54%) Swagger
Miscellaneous
1 44 (11.20%) Data Structures
2 42 (10.69%) Algorithms
3 39 (9.92%) Hedge funds
4 37 (9.41%) Clustering
5 25 (6.36%) Distributed Systems
6 24 (6.11%) Greenfield Project
7 20 (5.09%) Onboarding
8 17 (4.33%) Cloud Native
9 13 (3.31%) Product Ownership
9 13 (3.31%) Virtual Team
10 12 (3.05%) Legacy Systems
10 12 (3.05%) Linux Command Line
11 11 (2.80%) Blog
12 10 (2.54%) Blockchain
12 10 (2.54%) Public Cloud
13 7 (1.78%) Data Centre
14 6 (1.53%) Digital Currency
14 6 (1.53%) IoT
15 5 (1.27%) Cyberattack
15 5 (1.27%) Private Cloud
Operating Systems
1 39 (9.92%) Linux
2 13 (3.31%) Windows
3 6 (1.53%) Android
4 5 (1.27%) Mac OS
4 5 (1.27%) Unix
4 5 (1.27%) VMS
5 4 (1.02%) Apple iOS
5 4 (1.02%) Red Hat Enterprise Linux
6 3 (0.76%) CentOS
6 3 (0.76%) SUSE
6 3 (0.76%) SUSE Linux Enterprise Server
7 2 (0.51%) Ubuntu
8 1 (0.25%) Debian
8 1 (0.25%) Embedded Linux
8 1 (0.25%) Windows 10
8 1 (0.25%) Windows Server
8 1 (0.25%) Windows Server 2019
Processes & Methodologies
1 171 (43.51%) Software Engineering
2 164 (41.73%) DevOps
3 119 (30.28%) CI/CD
4 118 (30.03%) Problem-Solving
5 115 (29.26%) Microservices
6 112 (28.50%) Agile
6 112 (28.50%) Continuous Integration
7 77 (19.59%) TDD
8 71 (18.07%) Code Quality
9 66 (16.79%) Open Source
10 57 (14.50%) Containerisation
11 53 (13.49%) Site Reliability Engineering
12 50 (12.72%) Design Patterns
13 43 (10.94%) Full Stack Development
13 43 (10.94%) Infrastructure as Code
13 43 (10.94%) Unit Testing
14 41 (10.43%) High Availability
15 40 (10.18%) Asset Management
15 40 (10.18%) Clean Code
16 39 (9.92%) Investment Management
Programming Languages
1 240 (61.07%) Python
2 206 (52.42%) Java
3 165 (41.98%) JavaScript
4 89 (22.65%) Bash
5 57 (14.50%) Ruby
6 49 (12.47%) TypeScript
7 44 (11.20%) C#
8 39 (9.92%) Perl
9 36 (9.16%) Scala
10 34 (8.65%) SQL
11 27 (6.87%) PHP
12 23 (5.85%) Rust
13 18 (4.58%) PowerShell
14 16 (4.07%) C
15 10 (2.54%) Groovy
16 9 (2.29%) Kotlin
17 7 (1.78%) C++
18 5 (1.27%) Shell Script
19 4 (1.02%) Lua
20 2 (0.51%) Objective-C
Qualifications
1 40 (10.18%) Security Cleared
2 32 (8.14%) Degree
3 30 (7.63%) SC Cleared
4 21 (5.34%) BPSS Clearance
5 9 (2.29%) Azure Certification
5 9 (2.29%) Computer Science Degree
6 7 (1.78%) Master's Degree
7 3 (0.76%) Microsoft Certification
8 2 (0.51%) PhD
9 1 (0.25%) AWS Certification
9 1 (0.25%) AWS Certified Cloud Practitioner
9 1 (0.25%) AWS Certified Solutions Architect
9 1 (0.25%) DV Cleared
9 1 (0.25%) MCP
9 1 (0.25%) Numerate Degree
Quality Assurance & Compliance
1 51 (12.98%) QA
2 20 (5.09%) Accessibility
3 6 (1.53%) PCI DSS
4 1 (0.25%) ISO 9001
4 1 (0.25%) ISO/IEC 27001
4 1 (0.25%) SEPA
4 1 (0.25%) WCAG
System Software
1 138 (35.11%) Docker
2 7 (1.78%) Virtual Machines
3 3 (0.76%) Ceph
3 3 (0.76%) Gluster
3 3 (0.76%) KVM
3 3 (0.76%) oVirt
4 1 (0.25%) Active Directory
4 1 (0.25%) Hyper-V
4 1 (0.25%) Microsoft Virtual Server
4 1 (0.25%) Virtual Servers
4 1 (0.25%) VMware ESXi
Systems Management
1 153 (38.93%) Kubernetes
2 95 (24.17%) Terraform
3 59 (15.01%) Prometheus
4 42 (10.69%) Ansible
5 23 (5.85%) Progress Chef
6 22 (5.60%) Grafana
7 19 (4.83%) Puppet
8 13 (3.31%) Kibana
9 7 (1.78%) Argo
10 5 (1.27%) Docker Swarm
10 5 (1.27%) Rancher
11 4 (1.02%) Single Sign-On
12 3 (0.76%) Graylog
12 3 (0.76%) Observium
12 3 (0.76%) ZABBIX
13 2 (0.51%) Istio
13 2 (0.51%) Rundeck
14 1 (0.25%) Consul
14 1 (0.25%) Packer
14 1 (0.25%) Salt
Vendors
1 47 (11.96%) Oracle
2 44 (11.20%) Google
3 24 (6.11%) Dell
4 12 (3.05%) Microsoft
5 9 (2.29%) New Relic
6 8 (2.04%) SaltStack
7 7 (1.78%) Splunk
7 7 (1.78%) VMware
8 6 (1.53%) Teradata
9 4 (1.02%) YouTube
10 3 (0.76%) CrowdStrike
10 3 (0.76%) PagerDuty
11 2 (0.51%) LogicMonitor
11 2 (0.51%) Red Hat
11 2 (0.51%) Spotify
12 1 (0.25%) Dynatrace
12 1 (0.25%) Ivanti
12 1 (0.25%) Rollbar
12 1 (0.25%) StreamSets
12 1 (0.25%) Sybase