Proactive Monitoring Job Trends

Proactive Monitoring
UK

The table below provides summary statistics and salary benchmarking for jobs requiring Proactive Monitoring skills. It covers permanent job vacancies from the 6 months leading up to 16 November 2025, with comparisons to the same periods in the previous two years.

6 months to
16 Nov 2025
Same period 2024 Same period 2023
Rank 465 514 474
Rank change year-on-year +49 -40 +198
Permanent jobs citing Proactive Monitoring 207 246 267
As % of all permanent jobs in the UK 0.39% 0.36% 0.50%
As % of the Processes & Methodologies category 0.46% 0.44% 0.53%
Number of salaries quoted 101 146 223
10th Percentile £27,250 £36,875 £26,250
25th Percentile £40,500 £42,000 £35,000
Median annual salary (50th Percentile) £50,000 £45,723 £49,329
Median % change year-on-year +9.36% -7.31% +6.66%
75th Percentile £63,750 £67,875 £63,750
90th Percentile £82,500 £77,250 £82,500
UK excluding London median annual salary £46,080 £45,000 £45,000
% change year-on-year +2.40% - +12.50%

All Process and Methodology Skills
UK

Proactive Monitoring falls under the Processes and Methodologies category. For comparison with the information above, the following table provides summary statistics for all permanent job vacancies requiring process or methodology skills.

Permanent vacancies with a requirement for process or methodology skills 45,350 56,347 49,907
As % of all permanent jobs advertised in the UK 86.07% 83.11% 93.80%
Number of salaries quoted 27,263 29,385 38,254
10th Percentile £28,250 £34,112 £32,500
25th Percentile £35,750 £45,000 £43,750
Median annual salary (50th Percentile) £55,000 £60,000 £60,000
Median % change year-on-year -8.33% - -
75th Percentile £75,000 £79,600 £80,000
90th Percentile £95,000 £97,500 £98,750
UK excluding London median annual salary £47,500 £54,714 £52,500
% change year-on-year -13.18% +4.22% -

Proactive Monitoring
Job Vacancy Trend

Historical trend showing the proportion of permanent IT job postings citing Proactive Monitoring relative to all permanent IT jobs advertised.
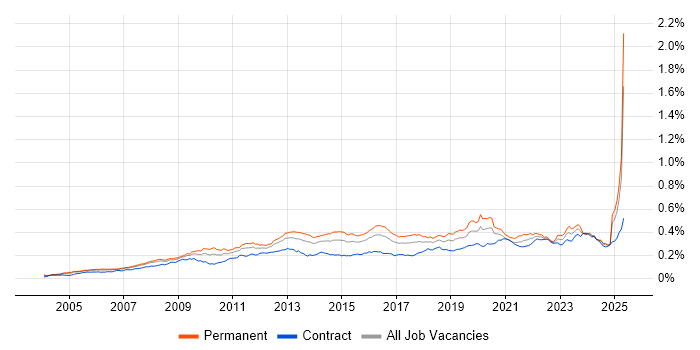
Proactive Monitoring job vacancy trend in the UK

Proactive Monitoring
Salary Trend

Salary distribution trend for jobs in the UK citing Proactive Monitoring.

Salary distribution trend for jobs in the UK citing Proactive Monitoring

Proactive Monitoring
Salary Histogram

Salary distribution for jobs citing Proactive Monitoring over the 6 months to 16 November 2025.

Salary histogram for Proactive Monitoring in the UK

Proactive Monitoring
Top 17 Job Locations

The table below looks at the demand and provides a guide to the median salaries quoted in IT jobs citing Proactive Monitoring within the UK over the 6 months to 16 November 2025. The 'Rank Change' column provides an indication of the change in demand within each location based on the same 6 month period last year.

Location Rank Change
on Same Period
Last Year
Matching
Permanent
IT Job Ads
Median Salary
Past 6 Months
Median Salary
% Change
on Same Period
Last Year
Live
Jobs
England +44 186 £47,500 +5.04% 121
UK excluding London +98 163 £46,080 +2.40% 92
South East +47 55 £45,500 +1.15% 24
Work from Home +57 54 £57,500 +18.18% 50
London +3 32 £80,000 +18.52% 43
North of England +10 29 £46,500 +3.33% 21
South West +50 27 £52,500 +16.67% 8
Midlands +55 26 £33,000 -50.38% 18
West Midlands +58 22 £41,000 -43.45% 11
East of England +29 16 £46,160 -12.08% 9
Yorkshire +4 16 £45,750 +1.67% 7
North West +26 10 £47,500 +1.60% 13
Scotland +3 6 £67,500 +31.71% 11
East Midlands +20 4 £26,500 -47.00% 7
North East +8 3 - - 1
Northern Ireland - 3 £55,000 - 2
Wales +11 1 - - 1

Proactive Monitoring
Co-Occurring Skills & Capabilities by Category

The following tables expand on the one above by listing co-occurrences grouped by category. They cover the same employment type, locality and period, with up to 20 co-occurrences shown in each category:

Application Platforms
1 18 (8.70%) SharePoint
2 9 (4.35%) Microsoft Exchange
3 7 (3.38%) Anypoint
3 7 (3.38%) IIS
4 1 (0.48%) Appian
4 1 (0.48%) Cloud Foundry
4 1 (0.48%) Confluence
4 1 (0.48%) HCL Notes
4 1 (0.48%) WordPress
Applications
1 13 (6.28%) Microsoft Excel
2 7 (3.38%) Spreadsheet
3 4 (1.93%) Microsoft Office
4 3 (1.45%) Microsoft PowerPoint
5 1 (0.48%) Adobe Illustrator
5 1 (0.48%) MS Visio
5 1 (0.48%) Photoshop
Business Applications
1 6 (2.90%) Shopify
2 4 (1.93%) Oracle ERP
3 1 (0.48%) Dynamics AX
3 1 (0.48%) NetSuite
3 1 (0.48%) SAP S/4HANA
Cloud Services
1 89 (43.00%) Azure
2 50 (24.15%) Microsoft 365
3 42 (20.29%) AWS
4 33 (15.94%) Power Platform
5 18 (8.70%) Azure Monitor
6 15 (7.25%) GCP
7 14 (6.76%) Azure Data Factory
8 13 (6.28%) Azure Synapse Analytics
8 13 (6.28%) Power Automate
9 12 (5.80%) Entra ID
10 8 (3.86%) PowerApps
10 8 (3.86%) SaaS
11 7 (3.38%) Azure DevOps
11 7 (3.38%) Azure Storage
11 7 (3.38%) Boomi
11 7 (3.38%) iPaaS
11 7 (3.38%) Workato
12 6 (2.90%) Copilot Studio
13 4 (1.93%) Amazon EC2
14 3 (1.45%) GitHub
Communications & Networking
1 63 (30.43%) Firewall
2 31 (14.98%) WAN
3 21 (10.14%) DNS
3 21 (10.14%) LAN
4 20 (9.66%) DHCP
4 20 (9.66%) LTE
4 20 (9.66%) VSAT
5 19 (9.18%) VPN
6 18 (8.70%) Wireless
7 16 (7.73%) Network Security
8 10 (4.83%) 802.11
8 10 (4.83%) SD-WAN
8 10 (4.83%) TCP/IP
8 10 (4.83%) Wi-Fi
9 9 (4.35%) SAN
9 9 (4.35%) SSL
9 9 (4.35%) VLAN
10 8 (3.86%) Internet
11 5 (2.42%) NAS
12 4 (1.93%) WLAN
Database & Business Intelligence
1 31 (14.98%) Power BI
2 23 (11.11%) SQL Server
3 15 (7.25%) SQL Server Reporting Services
4 14 (6.76%) Azure SQL Database
5 7 (3.38%) Relational Database
6 6 (2.90%) Oracle Database
7 3 (1.45%) Couchbase
7 3 (1.45%) DynamoDB
7 3 (1.45%) NoSQL
7 3 (1.45%) Power Query
7 3 (1.45%) Redis
7 3 (1.45%) SQL Server Integration Services
8 2 (0.97%) Metadata
8 2 (0.97%) SQL Server Analysis Services
9 1 (0.48%) Amazon RDS
9 1 (0.48%) Data Lake
9 1 (0.48%) MongoDB
9 1 (0.48%) Parquet
9 1 (0.48%) SAP HANA
9 1 (0.48%) SSDT
Development Applications
1 6 (2.90%) JIRA
2 2 (0.97%) Git
3 1 (0.48%) Browser DevTools
3 1 (0.48%) Cucumber
3 1 (0.48%) Cypress.io
3 1 (0.48%) Jasmine
3 1 (0.48%) Jenkins
3 1 (0.48%) Sonatype Nexus
3 1 (0.48%) Visual Studio
General
1 111 (53.62%) Social Skills
2 58 (28.02%) Finance
3 42 (20.29%) Analytical Skills
4 28 (13.53%) Law
5 26 (12.56%) Legal
6 23 (11.11%) Inclusion and Diversity
7 13 (6.28%) Presentation Skills
8 12 (5.80%) Manufacturing
9 11 (5.31%) Aerospace
9 11 (5.31%) Electronics
10 10 (4.83%) Automotive
10 10 (4.83%) Billing
10 10 (4.83%) Marketing
11 7 (3.38%) Financial Institution
12 6 (2.90%) Telecoms
13 4 (1.93%) Back Office
13 4 (1.93%) Police
14 3 (1.45%) French Language
14 3 (1.45%) Organisational Skills
14 3 (1.45%) Public Sector
Job Titles
1 52 (25.12%) Support Engineer
2 44 (21.26%) Technical Support
3 40 (19.32%) Technical Engineer
3 40 (19.32%) Technical Support Engineer
4 33 (15.94%) Senior
5 25 (12.08%) Infrastructure Engineer
6 13 (6.28%) Senior Manager
7 12 (5.80%) Business Manager
7 12 (5.80%) Insight Manager
8 11 (5.31%) Cybersecurity Specialist
8 11 (5.31%) Lead
9 10 (4.83%) Analyst
9 10 (4.83%) Security Specialist
10 8 (3.86%) Cloud Engineer
10 8 (3.86%) Integration Engineer
11 7 (3.38%) Development Engineer
11 7 (3.38%) IT Engineer
11 7 (3.38%) Network Engineer
11 7 (3.38%) Software Engineer
11 7 (3.38%) Support Analyst
Libraries, Frameworks & Software Standards
1 13 (6.28%) Hugging Face
1 13 (6.28%) LangChain
1 13 (6.28%) PyTorch
1 13 (6.28%) TensorFlow
2 12 (5.80%) REST
3 11 (5.31%) Web Services
4 10 (4.83%) 802.1X
5 6 (2.90%) JSON
5 6 (2.90%) SOAP
5 6 (2.90%) XML
6 5 (2.42%) CSS
6 5 (2.42%) HTML
6 5 (2.42%) RESTful
7 4 (1.93%) AngularJS
7 4 (1.93%) Kafka
7 4 (1.93%) ModSecurity
8 3 (1.45%) Memcached
8 3 (1.45%) Middleware
8 3 (1.45%) SAML
8 3 (1.45%) Spring
Miscellaneous
1 24 (11.59%) Data Centre
2 12 (5.80%) Analytical Mindset
3 10 (4.83%) Renewable Energy
4 9 (4.35%) Driving Licence
5 8 (3.86%) Onboarding
6 7 (3.38%) CMDB
7 6 (2.90%) Low-Code
8 5 (2.42%) Security Posture
9 4 (1.93%) Management Information System
9 4 (1.93%) Self-Motivation
10 3 (1.45%) Cloud Native
10 3 (1.45%) Data Structures
10 3 (1.45%) Distributed Systems
10 3 (1.45%) e-Learning
10 3 (1.45%) Hybrid Cloud
10 3 (1.45%) Virtual Team
10 3 (1.45%) Web Conferencing
11 2 (0.97%) Cyber Kill Chain
11 2 (0.97%) Enterprise Software
12 1 (0.48%) Legacy Systems
Operating Systems
1 56 (27.05%) Windows
2 22 (10.63%) Windows Server
3 10 (4.83%) Linux
3 10 (4.83%) Unix
4 4 (1.93%) AIX
5 3 (1.45%) Mac OS
6 2 (0.97%) Windows Server 2016
7 1 (0.48%) Check Point GAiA
7 1 (0.48%) VMS
7 1 (0.48%) Windows 10
7 1 (0.48%) Windows 7
7 1 (0.48%) Windows Server 2003
7 1 (0.48%) Windows Server 2019
Processes & Methodologies
1 82 (39.61%) Problem-Solving
2 81 (39.13%) Continuous Improvement
3 44 (21.26%) ITIL
4 41 (19.81%) Change Management
5 37 (17.87%) Customer Service
6 36 (17.39%) High Availability
6 36 (17.39%) Incident Management
7 35 (16.91%) Business Intelligence
8 34 (16.43%) Agile
9 33 (15.94%) AI
10 32 (15.46%) Service Delivery
11 31 (14.98%) Stakeholder Engagement
12 29 (14.01%) Service Management
13 28 (13.53%) Cybersecurity
13 28 (13.53%) SIEM
14 27 (13.04%) Infrastructure Engineering
14 27 (13.04%) Roadmaps
15 25 (12.08%) Incident Response
16 23 (11.11%) Decision-Making
17 22 (10.63%) Collaborative Working
Programming Languages
1 50 (24.15%) SQL
2 26 (12.56%) PowerShell
3 18 (8.70%) Python
4 17 (8.21%) Data Analysis Expressions
5 14 (6.76%) C#
6 12 (5.80%) JavaScript
7 9 (4.35%) Java
8 6 (2.90%) Kusto Query Language
9 5 (2.42%) Shell Script
10 4 (1.93%) Bash
10 4 (1.93%) Scala
10 4 (1.93%) T-SQL
11 3 (1.45%) Kotlin
12 2 (0.97%) Go
13 1 (0.48%) Bicep
13 1 (0.48%) TypeScript
Qualifications
1 38 (18.36%) Degree
2 31 (14.98%) Cisco Certification
3 29 (14.01%) Security Cleared
4 26 (12.56%) CCNA
5 24 (11.59%) SC Cleared
6 20 (9.66%) JNCIA
7 18 (8.70%) Computer Science Degree
8 17 (8.21%) Master's Degree
9 12 (5.80%) Six Sigma Green Belt
10 10 (4.83%) CCNP
10 10 (4.83%) GCSC
11 8 (3.86%) Microsoft Certification
12 4 (1.93%) DV Cleared
13 3 (1.45%) CISM
14 2 (0.97%) CCSA
14 2 (0.97%) CISA
14 2 (0.97%) GCFA
14 2 (0.97%) GCIA
14 2 (0.97%) GCIH
14 2 (0.97%) ITIL Foundation Certificate
Quality Assurance & Compliance
1 15 (7.25%) SLA
2 14 (6.76%) GDPR
3 12 (5.80%) Actionable Recommendations
4 7 (3.38%) ISO/IEC 27001
5 4 (1.93%) NIST
6 3 (1.45%) SOC 2
7 2 (0.97%) COBIT
8 1 (0.48%) Accessibility
8 1 (0.48%) California Consumer Privacy Act
8 1 (0.48%) Data Quality
8 1 (0.48%) GRC
8 1 (0.48%) WCAG
System Software
1 30 (14.49%) VMware Infrastructure
2 20 (9.66%) Active Directory
3 13 (6.28%) Hyper-V
4 9 (4.35%) Virtual Machines
5 7 (3.38%) Docker
5 7 (3.38%) Virtual Servers
5 7 (3.38%) VMware ESXi
5 7 (3.38%) vSphere
6 1 (0.48%) Virtual Desktop
Systems Management
1 15 (7.25%) Grafana
2 14 (6.76%) Prometheus
2 14 (6.76%) Terraform
3 12 (5.80%) Microsoft Intune
4 10 (4.83%) Kubernetes
5 7 (3.38%) vCenter Server
6 4 (1.93%) Single Sign-On
7 3 (1.45%) Ansible
7 3 (1.45%) Netcool
8 2 (0.97%) NetBackup
8 2 (0.97%) Suricata
9 1 (0.48%) Cisco CUCM
9 1 (0.48%) Control-M
9 1 (0.48%) CSIRT
9 1 (0.48%) FortiGate
9 1 (0.48%) Kibana
9 1 (0.48%) Microsoft Clustering
9 1 (0.48%) Oracle Enterprise Manager
9 1 (0.48%) Progress Chef
9 1 (0.48%) Puppet
Vendors
1 56 (27.05%) Microsoft
2 31 (14.98%) VMware
3 28 (13.53%) Cisco
4 20 (9.66%) Dell
5 17 (8.21%) Oracle
6 14 (6.76%) Freshdesk
6 14 (6.76%) Juniper
7 13 (6.28%) McAfee
7 13 (6.28%) OpenAI
7 13 (6.28%) ServiceNow
8 11 (5.31%) IBM
9 10 (4.83%) SAP
10 9 (4.35%) SolarWinds
11 7 (3.38%) Epicor
11 7 (3.38%) Infor
11 7 (3.38%) Informatica
11 7 (3.38%) Software AG
11 7 (3.38%) Talend
11 7 (3.38%) TIBCO
11 7 (3.38%) Workday