Strategic Roadmap Jobs with Hybrid/Remote/WFH Options

Strategic Roadmaps
UK > Work from Home

The table below provides summary statistics for permanent remote or hybrid work requiring Strategic Roadmap skills. It includes a benchmarking guide to the annual salaries offered in vacancies that cited Strategic Roadmap over the 6 months leading up to 28 May 2025, comparing them to the same period in the previous two years.

6 months to
28 May 2025
Same period 2024 Same period 2023
Rank 371 158 163
Rank change year-on-year -213 +5 +153
Permanent jobs citing Strategic Roadmap 102 699 886
As % of all permanent jobs with a WFH option 0.55% 2.04% 2.21%
As % of the Processes & Methodologies category 0.58% 2.26% 2.31%
Number of salaries quoted 64 164 349
10th Percentile £61,625 £43,000 £56,988
25th Percentile £69,563 £62,500 £62,500
Median annual salary (50th Percentile) £85,000 £77,500 £75,000
Median % change year-on-year +9.68% +3.33% -
75th Percentile £122,188 £93,750 £97,500
90th Percentile £140,000 £120,000 £115,000
UK median annual salary £75,000 £77,500 £80,000
% change year-on-year -3.23% -3.13% +6.67%

All Process and Methodology Skills
Work from Home

Strategic Roadmap falls under the Processes and Methodologies category. For comparison with the information above, the following table provides summary statistics for all permanent job vacancies with remote or hybrid options requiring process or methodology skills.

Permanent vacancies with a requirement for process or methodology skills 17,498 30,975 38,433
As % of all permanent jobs with a WFH option 93.97% 90.61% 96.05%
Number of salaries quoted 9,196 23,429 26,704
10th Percentile £27,250 £33,750 £37,500
25th Percentile £42,500 £42,500 £47,500
Median annual salary (50th Percentile) £58,000 £57,500 £62,500
Median % change year-on-year +0.87% -8.00% +4.17%
75th Percentile £77,500 £75,000 £82,500
90th Percentile £102,500 £95,000 £100,000
UK median annual salary £57,500 £55,000 £61,000
% change year-on-year +4.55% -9.84% +1.67%

Strategic Roadmap
Trend for Jobs with a WFH Option

Job vacancies with remote working options citing Strategic Roadmap as a proportion of all IT jobs advertised.
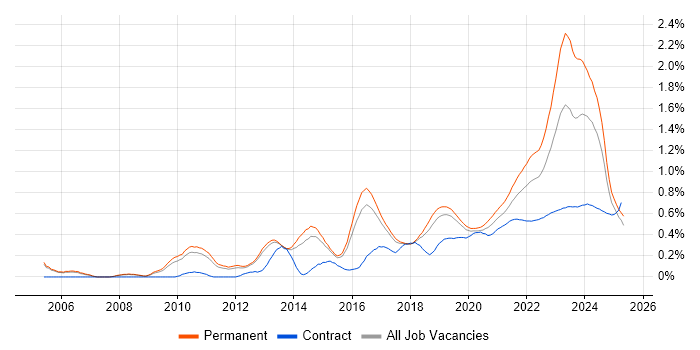
Strategic Roadmap trend for jobs with Hybrid/Remote/WFH options

Strategic Roadmap
Salary Trend for Jobs with a WFH Option

3-month moving average salary quoted in job vacancies with remote working options citing Strategic Roadmap.

Strategic Roadmap salary trend for jobs with a WFH option

Strategic Roadmap
Salary Histogram for Jobs with a WFH Option

Salary distribution for jobs with remote working options citing Strategic Roadmap over the 6 months to 28 May 2025.

Strategic Roadmap salary histogram for jobs with a WFH option

Strategic Roadmap
Co-occurring Skills and Capabilities with WFH Options by Category

The follow tables expand on the table above by listing co-occurrences grouped by category. The same employment type, locality and period is covered with up to 20 co-occurrences shown in each of the following categories:

Application Platforms
1 7 (6.86%) CMS
2 5 (4.90%) Apache Spark
3 4 (3.92%) Microsoft Exchange
4 2 (1.96%) WebSphere
5 1 (0.98%) Confluence
5 1 (0.98%) Oracle Workflow
5 1 (0.98%) Umbraco
Applications
1 3 (2.94%) Microsoft Project
2 1 (0.98%) Trello
Business Applications
1 1 (0.98%) Oracle EBS
1 1 (0.98%) Oracle EBS R12
1 1 (0.98%) Oracle Procure-to-Pay
1 1 (0.98%) Salesforce CRM
1 1 (0.98%) SAP S/4HANA
Cloud Services
1 13 (12.75%) Azure
2 9 (8.82%) AWS
3 6 (5.88%) GitHub
3 6 (5.88%) Google Analytics
4 4 (3.92%) Amazon EC2
4 4 (3.92%) AWS Lambda
4 4 (3.92%) Serverless
5 3 (2.94%) Amazon S3
5 3 (2.94%) Amazon SageMaker
5 3 (2.94%) PaaS
5 3 (2.94%) SaaS
6 2 (1.96%) Amazon ECS
6 2 (1.96%) AWS Fargate
6 2 (1.96%) Azure DevOps
7 1 (0.98%) Amazon EKS
7 1 (0.98%) Azure Data Factory
7 1 (0.98%) Dynamics 365
7 1 (0.98%) Google Docs
7 1 (0.98%) Power Platform
7 1 (0.98%) Slack
Communications & Networking
1 9 (8.82%) LAN
1 9 (8.82%) WAN
2 3 (2.94%) Firewall
2 3 (2.94%) VPN
3 2 (1.96%) Network Security
Database & Business Intelligence
1 3 (2.94%) Amazon Athena
1 3 (2.94%) Data Lake
1 3 (2.94%) Data Warehouse
1 3 (2.94%) Parquet
1 3 (2.94%) PostgreSQL
1 3 (2.94%) Spark SQL
1 3 (2.94%) Tableau
2 2 (1.96%) Big Data
2 2 (1.96%) Geospatial Data
2 2 (1.96%) Hadoop
3 1 (0.98%) NoSQL
3 1 (0.98%) Oracle Database
3 1 (0.98%) SQL Server
Development Applications
1 4 (3.92%) Git
1 4 (3.92%) GitLab
2 3 (2.94%) JIRA
3 2 (1.96%) Jenkins
3 2 (1.96%) Oracle Forms
3 2 (1.96%) TeamCity
General
1 38 (37.25%) Finance
2 23 (22.55%) Social Skills
3 18 (17.65%) Banking
3 18 (17.65%) Inclusion and Diversity
4 17 (16.67%) Marketing
5 16 (15.69%) Analytical Skills
6 13 (12.75%) Influencing Skills
7 6 (5.88%) Publishing
8 5 (4.90%) Presentation Skills
9 4 (3.92%) Legal
10 3 (2.94%) Retail
11 2 (1.96%) Manufacturing
11 2 (1.96%) Public Sector
11 2 (1.96%) Telecoms
12 1 (0.98%) Cantonese Language
12 1 (0.98%) Health Technology
12 1 (0.98%) Mandarin Language
12 1 (0.98%) Military
Job Titles
1 18 (17.65%) Lead
2 17 (16.67%) Architect
3 12 (11.76%) Product Manager
4 11 (10.78%) Senior
5 10 (9.80%) Enterprise Architect
6 9 (8.82%) Digital Product Manager
7 7 (6.86%) Product Owner
7 7 (6.86%) Senior Manager
8 6 (5.88%) Engineering Manager
8 6 (5.88%) Software Engineering Manager
8 6 (5.88%) Software Manager
9 4 (3.92%) Business Manager
9 4 (3.92%) IAM Specialist
9 4 (3.92%) Service Manager
9 4 (3.92%) Solutions Architect
10 3 (2.94%) Analyst
10 3 (2.94%) Data Manager
10 3 (2.94%) Head of Security
10 3 (2.94%) Relationships Manager
10 3 (2.94%) Software Engineer
Libraries, Frameworks & Software Standards
1 6 (5.88%) CSS
1 6 (5.88%) HTML
2 5 (4.90%) .NET
2 5 (4.90%) PySpark
3 3 (2.94%) XGBoost
4 2 (1.96%) ADO
4 2 (1.96%) J2EE
4 2 (1.96%) Java EE
4 2 (1.96%) Kafka
4 2 (1.96%) React
5 1 (0.98%) .NET Core
5 1 (0.98%) AngularJS
5 1 (0.98%) AWS CDK
5 1 (0.98%) Elastic Stack
5 1 (0.98%) Middleware
5 1 (0.98%) Oracle Fusion
5 1 (0.98%) Vue
Miscellaneous
1 13 (12.75%) Product Ownership
2 9 (8.82%) Virtual Team
3 8 (7.84%) Hybrid Cloud
4 7 (6.86%) Reinsurance
4 7 (6.86%) Self-Motivation
5 6 (5.88%) Marketing Technology
6 4 (3.92%) e-Learning
7 2 (1.96%) Cyber Threat
7 2 (1.96%) Data Fabric
7 2 (1.96%) Enterprise Software
7 2 (1.96%) Management Information System
7 2 (1.96%) Onboarding
7 2 (1.96%) Operational Technology
7 2 (1.96%) SWIFT Messaging Network
8 1 (0.98%) CCTV
8 1 (0.98%) Cloud Native
8 1 (0.98%) Enterprise Cloud
8 1 (0.98%) Femtech
8 1 (0.98%) Legacy Systems
8 1 (0.98%) SCADA
Operating Systems
1 6 (5.88%) Linux
1 6 (5.88%) zOS
2 4 (3.92%) Windows
2 4 (3.92%) Windows Server
3 2 (1.96%) Unix
Processes & Methodologies
1 102 (100.00%) Roadmaps
2 32 (31.37%) Agile
3 24 (23.53%) Business Strategy
4 23 (22.55%) Continuous Improvement
5 19 (18.63%) Problem-Solving
6 18 (17.65%) Strategic Planning
7 14 (13.73%) Stakeholder Management
8 12 (11.76%) DevOps
9 11 (10.78%) Analytics
9 11 (10.78%) Collaborative Working
9 11 (10.78%) Cybersecurity
9 11 (10.78%) Project Management
9 11 (10.78%) User Experience
10 10 (9.80%) Customer Experience
10 10 (9.80%) Decision-Making
10 10 (9.80%) Enterprise Architecture
10 10 (9.80%) Infrastructure as Code
10 10 (9.80%) Product Roadmap
10 10 (9.80%) Product Strategy
10 10 (9.80%) Software Engineering
Programming Languages
1 21 (20.59%) Python
2 8 (7.84%) SQL
3 4 (3.92%) Java
3 4 (3.92%) Perl
3 4 (3.92%) PHP
4 3 (2.94%) Bicep
5 2 (1.96%) Bash
5 2 (1.96%) Ruby
5 2 (1.96%) Scala
6 1 (0.98%) TypeScript
Qualifications
1 14 (13.73%) Degree
2 7 (6.86%) Security Cleared
3 4 (3.92%) BPSS Clearance
3 4 (3.92%) CISM
3 4 (3.92%) CISSP
4 3 (2.94%) Azure Certification
4 3 (2.94%) Computer Science Degree
4 3 (2.94%) DBS Check
4 3 (2.94%) SC Cleared
5 2 (1.96%) AWS Certification
5 2 (1.96%) CCIE
5 2 (1.96%) CCNP
5 2 (1.96%) CISA
5 2 (1.96%) Cisco Certification
5 2 (1.96%) CRISC
5 2 (1.96%) JNCIE
5 2 (1.96%) JNCIP
5 2 (1.96%) Master's Degree
6 1 (0.98%) DV Cleared
6 1 (0.98%) ISSAP
Quality Assurance & Compliance
1 6 (5.88%) Sarbanes-Oxley
2 5 (4.90%) NIST
3 4 (3.92%) Accessibility
3 4 (3.92%) Cyber Essentials
3 4 (3.92%) GDPR
3 4 (3.92%) PCI DSS
4 3 (2.94%) Cyber Essentials PLUS
4 3 (2.94%) ISO/IEC 27001
5 2 (1.96%) Data Quality
5 2 (1.96%) HIPAA
5 2 (1.96%) NIST 800
6 1 (0.98%) PMO
6 1 (0.98%) QA
6 1 (0.98%) SLA
6 1 (0.98%) SOC 2
System Software
1 2 (1.96%) Docker
2 1 (0.98%) Virtual Desktop
2 1 (0.98%) Virtual Machines
Systems Management
1 12 (11.76%) Terraform
2 10 (9.80%) Ansible
3 2 (1.96%) Kubernetes
3 2 (1.96%) Progress Chef
3 2 (1.96%) Puppet
4 1 (0.98%) CASB
4 1 (0.98%) Grafana
4 1 (0.98%) Prometheus
Vendors
1 8 (7.84%) Aruba
1 8 (7.84%) Cisco
1 8 (7.84%) Fortinet
1 8 (7.84%) Mellanox
1 8 (7.84%) NVIDIA
1 8 (7.84%) Palo Alto
2 7 (6.86%) Google
2 7 (6.86%) Microsoft
3 6 (5.88%) Databricks
3 6 (5.88%) IBM
4 5 (4.90%) Salesforce
5 4 (3.92%) Oracle
5 4 (3.92%) SAP
6 2 (1.96%) Cloudera
7 1 (0.98%) CA Agile Central
7 1 (0.98%) Concur
7 1 (0.98%) Foundry
7 1 (0.98%) Juniper
7 1 (0.98%) Palantir
7 1 (0.98%) Revolut