JavaScript Jobs in England

JavaScript (including ECMAScript)
UK > England

The table below provides summary statistics for permanent job vacancies advertised in England requiring JavaScript skills. It includes a benchmarking guide to the annual salaries offered in vacancies that cited JavaScript over the 6 months leading up to 16 September 2024, comparing them to the same period in the previous two years.

6 months to
16 Sep 2024
Same period 2023 Same period 2022
Rank 18 17 14
Rank change year-on-year -1 -3 -7
Permanent jobs citing JavaScript 5,462 5,490 19,746
As % of all permanent jobs advertised in England 7.56% 9.64% 15.08%
As % of the Programming Languages category 25.14% 23.70% 30.46%
Number of salaries quoted 3,465 4,714 10,099
10th Percentile £36,250 £40,000 £37,500
25th Percentile £46,250 £48,750 £46,250
Median annual salary (50th Percentile) £65,000 £65,000 £60,000
Median % change year-on-year - +8.33% +9.09%
75th Percentile £93,750 £83,750 £82,500
90th Percentile £130,000 £110,000 £98,750
UK median annual salary £62,500 £65,000 £60,000
% change year-on-year -3.85% +8.33% +9.09%

All Programming Languages
England

JavaScript falls under the Programming Languages category. For comparison with the information above, the following table provides summary statistics for all permanent job vacancies requiring coding skills in England.

Permanent vacancies with a requirement for coding skills 21,724 23,167 64,825
As % of all permanent jobs advertised in England 30.09% 40.69% 49.52%
Number of salaries quoted 13,610 18,325 36,407
10th Percentile £37,500 £40,000 £37,500
25th Percentile £47,500 £50,000 £46,750
Median annual salary (50th Percentile) £62,500 £65,000 £64,000
Median % change year-on-year -3.85% +1.56% +6.67%
75th Percentile £85,000 £85,000 £85,000
90th Percentile £110,000 £110,000 £103,750
UK median annual salary £61,500 £65,000 £62,500
% change year-on-year -5.38% +4.00% +8.70%

JavaScript
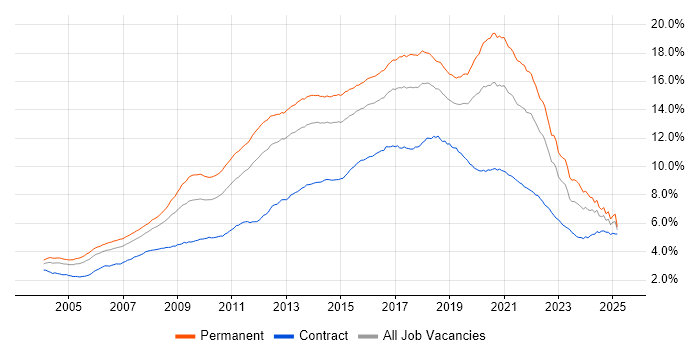
Job Vacancy Trend in England

Job postings citing JavaScript as a proportion of all IT jobs advertised in England.

Job vacancy trend for JavaScript in England

JavaScript
Salary Trend in England

3-month moving average salary quoted in jobs citing JavaScript in England.

Salary trend for JavaScript in England

JavaScript
Salary Histogram in England

Salary distribution for jobs citing JavaScript in England over the 6 months to 16 September 2024.

Salary histogram for JavaScript in England

JavaScript
Job Locations in England

The table below looks at the demand and provides a guide to the median salaries quoted in IT jobs citing JavaScript within the England region over the 6 months to 16 September 2024. The 'Rank Change' column provides an indication of the change in demand within each location based on the same 6 month period last year.

Location Rank Change
on Same Period
Last Year
Matching
Permanent
IT Job Ads
Median Salary
Past 6 Months
Median Salary
% Change
on Same Period
Last Year
Live
Jobs
London -5 1,928 £90,000 +12.50% 641
South East -6 1,052 £55,000 -8.33% 245
North of England -4 956 £55,000 - 294
Midlands -2 638 £50,000 -13.04% 222
South West +11 520 £53,918 -1.97% 157
North West -5 510 £52,500 -4.55% 167
West Midlands -4 356 £52,500 -4.55% 146
Yorkshire -3 331 £55,000 - 89
East of England +22 313 £57,500 -4.17% 119
East Midlands -1 280 £47,500 -18.10% 75
North East +5 115 £60,000 +9.09% 41
JavaScript
UK

JavaScript
Co-occurring Skills and Capabilities in England by Category

The follow tables expand on the table above by listing co-occurrences grouped by category. The same employment type, locality and period is covered with up to 20 co-occurrences shown in each of the following categories:

Application Platforms
1 619 (11.33%) Apache
2 609 (11.15%) Apache Airflow
3 176 (3.22%) CMS
4 152 (2.78%) WordPress
5 81 (1.48%) Confluence
5 81 (1.48%) nginx
6 75 (1.37%) SharePoint
7 48 (0.88%) IIS
8 47 (0.86%) ArcGIS
9 45 (0.82%) Umbraco
10 42 (0.77%) GeoServer
11 33 (0.60%) Camunda
12 27 (0.49%) Apache Spark
12 27 (0.49%) Drupal
13 26 (0.48%) WinCC
14 20 (0.37%) Moodle
14 20 (0.37%) Tomcat
15 16 (0.29%) Headless CMS
16 15 (0.27%) NServiceBus
17 13 (0.24%) Apache Solr
Applications
1 48 (0.88%) Adobe XD
2 45 (0.82%) Photoshop
3 44 (0.81%) Microsoft Office
4 42 (0.77%) Microsoft Excel
5 41 (0.75%) Simulink
6 26 (0.48%) Sketch
7 19 (0.35%) Adobe Illustrator
8 15 (0.27%) Adobe Creative Suite
9 13 (0.24%) RoboHelp
10 11 (0.20%) InVision
11 9 (0.16%) Chatbot
12 8 (0.15%) MS Visio
13 7 (0.13%) Elementor
13 7 (0.13%) MadCap Flare
14 6 (0.11%) Acrobat
14 6 (0.11%) Fireworks
15 5 (0.092%) Microsoft PowerPoint
16 4 (0.073%) Zeplin
17 3 (0.055%) InDesign
17 3 (0.055%) Spreadsheet
Business Applications
1 104 (1.90%) Dynamics CRM
2 39 (0.71%) Magento
3 34 (0.62%) SDL Web 8
4 30 (0.55%) Ripple
4 30 (0.55%) Shopify
5 13 (0.24%) Salesforce CRM
6 11 (0.20%) SAP ERP
7 9 (0.16%) Oracle EBS
7 9 (0.16%) SAP SD
8 6 (0.11%) Adobe Campaign
9 5 (0.092%) Dynamics NAV
9 5 (0.092%) Fidessa
9 5 (0.092%) Payment Gateway
10 4 (0.073%) NetSuite
11 3 (0.055%) Oracle Cash Management
11 3 (0.055%) Remedy ITSM
11 3 (0.055%) Sage X3
12 2 (0.037%) Oracle BPM
12 2 (0.037%) SAP MII
12 2 (0.037%) Workfront
Cloud Services
1 1,709 (31.29%) AWS
2 1,592 (29.15%) Azure
3 568 (10.40%) Snowflake
4 566 (10.36%) dbt
5 547 (10.01%) GCP
6 389 (7.12%) Azure DevOps
7 373 (6.83%) GitHub
8 312 (5.71%) Serverless
9 280 (5.13%) Power Platform
10 254 (4.65%) SaaS
11 253 (4.63%) IBM Cloud
12 169 (3.09%) Azure Service Bus
13 164 (3.00%) Dynamics 365
14 156 (2.86%) Azure Functions
15 149 (2.73%) Azure Logic Apps
16 148 (2.71%) PowerApps
17 147 (2.69%) Power Automate
18 139 (2.54%) Amazon EKS
19 137 (2.51%) Amazon ECS
20 115 (2.11%) Amazon EC2
Communications & Networking
1 66 (1.21%) Internet
2 44 (0.81%) HTTP
3 27 (0.49%) DNS
3 27 (0.49%) TCP/IP
4 23 (0.42%) Wireless
5 17 (0.31%) Wi-Fi
6 15 (0.27%) AMQP
7 14 (0.26%) RS-485
8 12 (0.22%) Network Security
9 11 (0.20%) Broadband
9 11 (0.20%) MQTT
9 11 (0.20%) SSL
10 10 (0.18%) HTTPS
10 10 (0.18%) VPN
11 8 (0.15%) 3G
11 8 (0.15%) 4G
11 8 (0.15%) Firewall
11 8 (0.15%) Wireshark
12 7 (0.13%) RS-232
13 6 (0.11%) DHCP
Database & Business Intelligence
1 649 (11.88%) SQL Server
2 568 (10.40%) Data Lake
3 566 (10.36%) Amazon Athena
4 563 (10.31%) Apache Arrow
4 563 (10.31%) Dremio
5 547 (10.01%) Apache Ignite
6 475 (8.70%) MySQL
7 448 (8.20%) PostgreSQL
8 434 (7.95%) NoSQL
9 361 (6.61%) MongoDB
10 333 (6.10%) Relational Database
11 200 (3.66%) DB2
12 139 (2.54%) Power BI
13 98 (1.79%) Big Data
14 90 (1.65%) Elasticsearch
15 69 (1.26%) GIS
16 52 (0.95%) SQL Server Reporting Services
17 43 (0.79%) Redis
18 42 (0.77%) QGIS
19 41 (0.75%) Azure SQL Database
Development Applications
1 875 (16.02%) Git
2 264 (4.83%) JIRA
3 167 (3.06%) Jenkins
4 129 (2.36%) Visual Studio
5 124 (2.27%) Selenium
6 122 (2.23%) Cypress.io
7 108 (1.98%) GitLab
8 85 (1.56%) TeamCity
9 69 (1.26%) webpack
10 52 (0.95%) Bitbucket
11 51 (0.93%) NUnit
12 50 (0.92%) Moq
13 49 (0.90%) Team Foundation Server
14 46 (0.84%) Octopus Deploy
15 44 (0.81%) gulp
16 40 (0.73%) Vagrant
17 38 (0.70%) Maven
18 37 (0.68%) Cucumber
19 34 (0.62%) SpecFlow
20 33 (0.60%) SonarQube
General
1 1,110 (20.32%) Finance
2 1,108 (20.29%) Social Skills
3 654 (11.97%) Banking
4 642 (11.75%) Front Office
5 551 (10.09%) Investment Banking
6 395 (7.23%) Public Sector
7 322 (5.90%) Analytical Skills
8 293 (5.36%) Marketing
9 282 (5.16%) Inclusion and Diversity
10 215 (3.94%) Multimedia
11 169 (3.09%) Law
12 159 (2.91%) Legal
13 134 (2.45%) Retail
14 125 (2.29%) Games
15 65 (1.19%) Automotive
16 56 (1.03%) Manufacturing
17 52 (0.95%) Advertising
18 51 (0.93%) Telecoms
19 44 (0.81%) Tech for Good
20 41 (0.75%) Aerospace
Job Titles
1 3,116 (57.05%) Developer
2 1,206 (22.08%) Senior
3 1,103 (20.19%) Software Engineer
4 653 (11.96%) Senior Developer
5 538 (9.85%) Lead
6 535 (9.79%) Full-Stack Developer
7 516 (9.45%) .NET Developer
8 415 (7.60%) Web Developer
9 412 (7.54%) Software Developer
10 389 (7.12%) Senior Software Engineer
11 337 (6.17%) AWS Engineer
12 314 (5.75%) C# Developer
13 289 (5.29%) Front-End Developer (Client-Side Developer)
14 288 (5.27%) PHP Developer
15 284 (5.20%) Java Engineer
16 276 (5.05%) Full-Stack Engineer
17 275 (5.03%) Python Engineer
18 268 (4.91%) Java Software Engineer
19 260 (4.76%) Python Software Engineer
20 253 (4.63%) AWS Software Engineer
Libraries, Frameworks & Software Standards
1 2,392 (43.79%) HTML
2 2,325 (42.57%) CSS
3 1,990 (36.43%) React
4 1,739 (31.84%) .NET
5 1,151 (21.07%) AngularJS
6 786 (14.39%) Node.js
7 743 (13.60%) ASP.NET
8 646 (11.83%) Vue
9 640 (11.72%) gRPC
10 629 (11.52%) HTML5
11 604 (11.06%) Protocol Buffers
12 573 (10.49%) REST
13 546 (10.00%) jQuery
14 543 (9.94%) Web Services
15 526 (9.63%) NumPy
16 521 (9.54%) Pandas
17 511 (9.36%) SciPy
18 464 (8.50%) RESTful
19 455 (8.33%) CSS3
20 417 (7.63%) .NET Framework
Miscellaneous
1 611 (11.19%) Hedge funds
2 608 (11.13%) Fixed Income
3 568 (10.40%) Derivative
4 550 (10.07%) Foreign Exchange (FX)
5 548 (10.03%) Equities
6 309 (5.66%) Blockchain
7 277 (5.07%) Algorithms
8 256 (4.69%) Hybrid Cloud
9 255 (4.67%) Data Structures
10 195 (3.57%) Greenfield Project
11 163 (2.98%) Product Ownership
12 160 (2.93%) e-Learning
13 149 (2.73%) Self-Motivation
14 135 (2.47%) Mobile App
15 125 (2.29%) Cloud Native
16 102 (1.87%) Pricing Data
17 76 (1.39%) Distributed Systems
18 71 (1.30%) IoT
18 71 (1.30%) Legacy Systems
19 67 (1.23%) Low-Code
Operating Systems
1 591 (10.82%) Linux
2 360 (6.59%) Windows
3 334 (6.11%) Android
4 271 (4.96%) Apple iOS
5 70 (1.28%) Ubuntu
6 66 (1.21%) CentOS
7 60 (1.10%) Red Hat Enterprise Linux
8 38 (0.70%) Unix
9 16 (0.29%) Debian
10 13 (0.24%) Embedded Linux
11 11 (0.20%) VMS
12 10 (0.18%) Windows Server
13 6 (0.11%) Solaris
14 4 (0.073%) AIX
15 2 (0.037%) Alpine Linux
15 2 (0.037%) Rocky
16 1 (0.018%) Kali Linux
16 1 (0.018%) VxWorks
16 1 (0.018%) Windows 7
16 1 (0.018%) Windows Server 2012
Processes & Methodologies
1 2,238 (40.97%) Agile
2 1,715 (31.40%) Software Engineering
3 1,634 (29.92%) Full-Stack Development
4 967 (17.70%) Web Development
5 959 (17.56%) DevOps
6 866 (15.85%) Problem-Solving
7 731 (13.38%) Asset Management
8 684 (12.52%) User Experience
9 666 (12.19%) MVC
10 654 (11.97%) Artificial Intelligence
11 652 (11.94%) Computer Science
12 544 (9.96%) CI/CD
13 536 (9.81%) Front End Development
14 498 (9.12%) Mentoring
15 492 (9.01%) Investment Management
16 486 (8.90%) OO
17 461 (8.44%) Scrum
18 460 (8.42%) Microservices
19 447 (8.18%) OOP
20 425 (7.78%) Design Patterns
Programming Languages
1 1,901 (34.80%) C#
2 1,779 (32.57%) Python
3 1,695 (31.03%) TypeScript
4 1,521 (27.85%) SQL
5 1,415 (25.91%) Java
6 650 (11.90%) PHP
7 259 (4.74%) C++
8 153 (2.80%) T-SQL
9 132 (2.42%) Go
10 115 (2.11%) C
11 88 (1.61%) PowerShell
12 69 (1.26%) Rust
13 68 (1.24%) Ruby
14 67 (1.23%) Kotlin
15 59 (1.08%) Bash
16 55 (1.01%) VB.NET
17 44 (0.81%) VB
18 33 (0.60%) Lua
19 32 (0.59%) Solidity
20 30 (0.55%) Haskell
Qualifications
1 901 (16.50%) Degree
2 430 (7.87%) Security Cleared
3 360 (6.59%) Computer Science Degree
4 292 (5.35%) SC Cleared
5 149 (2.73%) DV Cleared
6 73 (1.34%) Master's Degree
7 31 (0.57%) Azure Certification
8 27 (0.49%) Microsoft Certification
9 22 (0.40%) Numerate Degree
10 18 (0.33%) AWS Certification
11 17 (0.31%) ISTQB
11 17 (0.31%) ITIL Certification
12 15 (0.27%) ITIL Foundation Certificate
13 14 (0.26%) PhD
14 7 (0.13%) PMI Certification
14 7 (0.13%) PMP
15 6 (0.11%) BPSS Clearance
16 5 (0.092%) CISSP
16 5 (0.092%) PCI QSA
17 4 (0.073%) ISEB
Quality Assurance & Compliance
1 269 (4.92%) QA
2 182 (3.33%) Data Quality
3 141 (2.58%) Accessibility
4 44 (0.81%) GDPR
4 44 (0.81%) WCAG
5 31 (0.57%) SLA
6 25 (0.46%) ISO/IEC 27001
7 16 (0.29%) GRC
8 14 (0.26%) IEC 61131
8 14 (0.26%) WAI
9 12 (0.22%) PMO
10 6 (0.11%) ISO 9001
11 5 (0.092%) Cyber Essentials
11 5 (0.092%) NCSC
11 5 (0.092%) PCI DSS
12 4 (0.073%) Def Stans
12 4 (0.073%) EMIR
12 4 (0.073%) HL7
12 4 (0.073%) IEC 61508
12 4 (0.073%) MiFID
System Software
1 559 (10.23%) Docker
2 12 (0.22%) Virtual Machines
3 11 (0.20%) Active Directory
4 7 (0.13%) Hyper-V
4 7 (0.13%) VMware Infrastructure
5 6 (0.11%) Virtual Desktop
6 4 (0.073%) Firmware
7 3 (0.055%) KVM
7 3 (0.055%) VMware ESXi
8 2 (0.037%) Microsoft Virtual Server
8 2 (0.037%) Varnish
8 2 (0.037%) Virtual Servers
9 1 (0.018%) GlusterFS
9 1 (0.018%) OpenAM
9 1 (0.018%) OpenDJ
9 1 (0.018%) vSphere
Systems Management
1 469 (8.59%) Kubernetes
2 254 (4.65%) Terraform
3 93 (1.70%) Ansible
4 68 (1.24%) Single Sign-On
5 67 (1.23%) Prometheus
6 30 (0.55%) Grafana
7 26 (0.48%) Puppet
8 14 (0.26%) Kibana
9 11 (0.20%) cPanel
9 11 (0.20%) Progress Chef
10 9 (0.16%) Istio
11 8 (0.15%) MIIS
12 6 (0.11%) Active Directory Federation Services
13 5 (0.092%) Nagios
14 4 (0.073%) Plesk
15 3 (0.055%) Docker Swarm
16 2 (0.037%) HP Quality Center
16 2 (0.037%) Matomo
16 2 (0.037%) Rancher
16 2 (0.037%) RSA Archer
Vendors
1 536 (9.81%) Microsoft
2 284 (5.20%) Red Hat
3 258 (4.72%) IBM
4 195 (3.57%) Google
5 138 (2.53%) ServiceNow
6 132 (2.42%) Adobe
7 126 (2.31%) Oracle
8 72 (1.32%) Bloomberg
9 65 (1.19%) Reuters
10 59 (1.08%) Salesforce
11 46 (0.84%) ESRI
12 40 (0.73%) Atlassian
12 40 (0.73%) Xilinx
13 36 (0.66%) OpenAI
14 32 (0.59%) SAP
15 29 (0.53%) Xamarin
16 26 (0.48%) Siemens
17 22 (0.40%) F5
18 19 (0.35%) Splunk
19 16 (0.29%) Cognizant