Penetration Testing Jobs

Penetration Testing
UK

The table below provides summary statistics for permanent job vacancies requiring Penetration Testing skills. It includes a benchmarking guide to the annual salaries offered in vacancies that cited Penetration Testing over the 6 months leading up to 29 May 2025, comparing them to the same period in the previous two years.

6 months to
29 May 2025
Same period 2024 Same period 2023
Rank 481 460 477
Rank change year-on-year -21 +17 +86
Permanent jobs citing Penetration Testing 238 511 599
As % of all permanent jobs advertised in the UK 0.43% 0.50% 0.62%
As % of the Processes & Methodologies category 0.46% 0.59% 0.64%
Number of salaries quoted 179 403 408
10th Percentile £41,750 £38,797 £43,668
25th Percentile £56,375 £48,750 £50,015
Median annual salary (50th Percentile) £67,500 £65,000 £65,000
Median % change year-on-year +3.85% - +2.87%
75th Percentile £83,750 £82,500 £89,063
90th Percentile £95,000 £95,000 £103,750
UK excluding London median annual salary £67,500 £57,500 £55,000
% change year-on-year +17.39% +4.55% -8.33%

All Process and Methodology Skills
UK

Penetration Testing falls under the Processes and Methodologies category. For comparison with the information above, the following table provides summary statistics for all permanent job vacancies requiring process or methodology skills.

Permanent vacancies with a requirement for process or methodology skills 51,417 86,448 93,028
As % of all permanent jobs advertised in the UK 93.74% 84.24% 95.56%
Number of salaries quoted 25,323 60,550 54,986
10th Percentile £29,000 £29,250 £34,000
25th Percentile £41,250 £40,000 £45,000
Median annual salary (50th Percentile) £57,500 £55,000 £61,000
Median % change year-on-year +4.55% -9.84% +1.67%
75th Percentile £75,000 £72,500 £81,250
90th Percentile £97,500 £92,500 £100,000
UK excluding London median annual salary £51,564 £50,000 £55,000
% change year-on-year +3.13% -9.09% +4.76%

Penetration Testing
Job Vacancy Trend

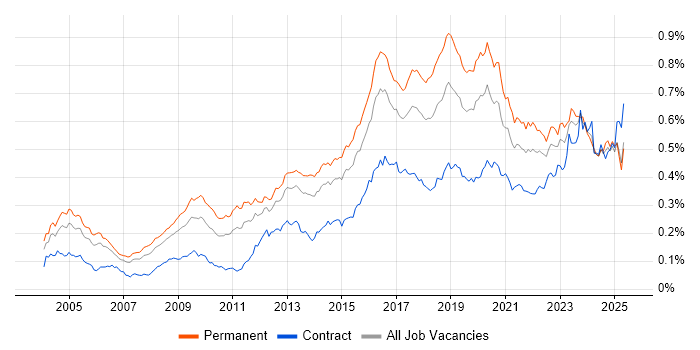
Job postings citing Penetration Testing as a proportion of all IT jobs advertised.

Job vacancy trend for Penetration Testing in the UK

Penetration Testing
Salary Trend

3-month moving average salary quoted in jobs citing Penetration Testing.

Salary trend for Penetration Testing in the UK

Penetration Testing
Salary Histogram

Salary distribution for jobs citing Penetration Testing over the 6 months to 29 May 2025.

Salary histogram for Penetration Testing in the UK

Penetration Testing
Top 17 Job Locations

The table below looks at the demand and provides a guide to the median salaries quoted in IT jobs citing Penetration Testing within the UK over the 6 months to 29 May 2025. The 'Rank Change' column provides an indication of the change in demand within each location based on the same 6 month period last year.

Location Rank Change
on Same Period
Last Year
Matching
Permanent
IT Job Ads
Median Salary
Past 6 Months
Median Salary
% Change
on Same Period
Last Year
Live
Jobs
England -9 220 £67,500 +3.85% 330
UK excluding London +95 130 £67,500 +17.39% 238
London -7 96 £72,500 -3.33% 138
Work from Home -6 74 £75,500 +25.83% 175
South East +72 38 £70,000 +60.00% 66
North of England +31 35 £61,000 +1.67% 43
Midlands +40 33 £67,500 +22.73% 32
West Midlands +56 30 £67,500 +22.73% 21
North West -9 20 £61,000 +1.67% 23
Yorkshire +57 11 £55,000 +24.29% 16
Scotland +121 7 £70,000 +16.67% 11
South West +76 7 £67,500 +5.88% 45
Northern Ireland - 6 £76,092 - 19
North East - 4 £72,692 - 4
East Midlands +14 3 £40,000 -38.46% 10
Wales +45 2 £75,574 -16.03% 6
East of England +36 2 - - 21

Penetration Testing
Co-occurring Skills and Capabilities by Category

The follow tables expand on the table above by listing co-occurrences grouped by category. The same employment type, locality and period is covered with up to 20 co-occurrences shown in each of the following categories:

Application Platforms
1 2 (0.84%) TPMS
2 1 (0.42%) Confluence
2 1 (0.42%) SharePoint
Applications
1 1 (0.42%) Microsoft Excel
1 1 (0.42%) Microsoft Office
Cloud Services
1 49 (20.59%) Azure
2 31 (13.03%) AWS
3 27 (11.34%) Microsoft 365
4 13 (5.46%) Entra ID
5 10 (4.20%) GCP
6 9 (3.78%) PaaS
7 8 (3.36%) Azure Sentinel
8 7 (2.94%) SaaS
9 6 (2.52%) Google Workspace
10 5 (2.10%) IaaS
11 3 (1.26%) AWS KMS
11 3 (1.26%) Cloud Computing
11 3 (1.26%) Power Platform
11 3 (1.26%) Serverless
12 2 (0.84%) Amazon GuardDuty
12 2 (0.84%) AWS CloudTrail
12 2 (0.84%) Azure AKS
12 2 (0.84%) Azure Data Factory
12 2 (0.84%) Azure DevOps
12 2 (0.84%) Azure Monitor
Communications & Networking
1 43 (18.07%) Firewall
2 39 (16.39%) Network Security
3 20 (8.40%) Wi-Fi
4 14 (5.88%) Bluetooth
5 12 (5.04%) 5G
6 11 (4.62%) LTE
7 10 (4.20%) TCP/IP
8 9 (3.78%) VLAN
8 9 (3.78%) VPN
8 9 (3.78%) Wireless
8 9 (3.78%) Wireshark
9 8 (3.36%) BGP
9 8 (3.36%) HTTP
9 8 (3.36%) OSPF
10 7 (2.94%) DNS
10 7 (2.94%) Spanning Tree
11 6 (2.52%) SSL
12 5 (2.10%) WAN
13 4 (1.68%) HTTPS
13 4 (1.68%) Intrusion Detection
Database & Business Intelligence
1 3 (1.26%) Power BI
2 1 (0.42%) Amazon RDS
2 1 (0.42%) Elasticsearch
2 1 (0.42%) PostgreSQL
Development Applications
1 20 (8.40%) JIRA
2 19 (7.98%) Selenium
3 12 (5.04%) Burp Suite
3 12 (5.04%) Metasploit
4 3 (1.26%) AppScan
5 2 (0.84%) Git
5 2 (0.84%) GitLab
5 2 (0.84%) Jenkins
5 2 (0.84%) Postman
5 2 (0.84%) REST Assured
5 2 (0.84%) SoapUI
6 1 (0.42%) Cypress.io
6 1 (0.42%) JMeter
6 1 (0.42%) JUnit
6 1 (0.42%) LoadRunner
6 1 (0.42%) TestRail
General
1 85 (35.71%) Social Skills
2 39 (16.39%) Finance
3 31 (13.03%) Analytical Skills
4 30 (12.61%) Inclusion and Diversity
5 18 (7.56%) Legal
6 13 (5.46%) Electronics
7 12 (5.04%) Law
8 8 (3.36%) Influencing Skills
8 8 (3.36%) Mandarin Language
9 6 (2.52%) Banking
9 6 (2.52%) Telecoms
10 4 (1.68%) Aerospace
10 4 (1.68%) Manufacturing
10 4 (1.68%) Organisational Skills
11 3 (1.26%) Automotive
11 3 (1.26%) Pharmaceutical
12 2 (0.84%) Games
12 2 (0.84%) Military
12 2 (0.84%) Public Sector
13 1 (0.42%) Retail
Job Titles
1 63 (26.47%) Lead
2 30 (12.61%) Analyst
2 30 (12.61%) Security Engineer
3 28 (11.76%) Senior
4 22 (9.24%) Architect
4 22 (9.24%) Security Analyst
4 22 (9.24%) Security Architect
4 22 (9.24%) Tester
5 21 (8.82%) Infrastructure Engineer
6 20 (8.40%) Penetration Tester
7 18 (7.56%) Automation Engineer
7 18 (7.56%) Validation Engineer
8 15 (6.30%) Security Specialist
9 13 (5.46%) Security Manager
10 11 (4.62%) Cybersecurity Specialist
10 11 (4.62%) Lead Infrastructure Engineer
11 8 (3.36%) IT Analyst
11 8 (3.36%) Lead Security Architect
11 8 (3.36%) Principal Architect
11 8 (3.36%) Principal Security Architect
Libraries, Frameworks & Software Standards
1 2 (0.84%) Azure Blueprints
1 2 (0.84%) PyTorch
1 2 (0.84%) REST
1 2 (0.84%) scikit-learn
1 2 (0.84%) TensorFlow
2 1 (0.42%) AngularJS
2 1 (0.42%) EDI
2 1 (0.42%) Elastic Stack
2 1 (0.42%) JWT
2 1 (0.42%) Node.js
2 1 (0.42%) OAuth
2 1 (0.42%) OAuth2
2 1 (0.42%) pytest
2 1 (0.42%) SAML
2 1 (0.42%) Web Services
2 1 (0.42%) YAML
Miscellaneous
1 34 (14.29%) Security Posture
2 32 (13.45%) Management Information System
3 21 (8.82%) Operational Technology
4 19 (7.98%) SCADA
5 15 (6.30%) IoT
6 14 (5.88%) Mobile App
7 13 (5.46%) Cyber Threat
8 11 (4.62%) NB-IoT
9 10 (4.20%) Data Centre
9 10 (4.20%) Security Operations Centre
10 6 (2.52%) Cloud Native
10 6 (2.52%) Onboarding
10 6 (2.52%) Public Cloud
10 6 (2.52%) Self-Motivation
11 5 (2.10%) Cyber Security Posture
12 4 (1.68%) Cyber Defence
12 4 (1.68%) Embedded Systems
12 4 (1.68%) Virtual Team
13 3 (1.26%) Cyberattack
13 3 (1.26%) Greenfield Project
Operating Systems
1 33 (13.87%) Windows
2 24 (10.08%) Linux
3 20 (8.40%) Windows Server
4 6 (2.52%) CentOS
4 6 (2.52%) Ubuntu
5 5 (2.10%) Android
5 5 (2.10%) Apple iOS
6 4 (1.68%) Kali Linux
7 3 (1.26%) Windows 10
8 2 (0.84%) VMS
8 2 (0.84%) Windows Server 2016
8 2 (0.84%) Windows Server 2019
Processes & Methodologies
1 150 (63.03%) Cybersecurity
2 74 (31.09%) Information Security
3 70 (29.41%) Incident Response
4 64 (26.89%) Vulnerability Management
5 47 (19.75%) Mentoring
5 47 (19.75%) Security Testing
5 47 (19.75%) SIEM
6 43 (18.07%) Computer Science
7 42 (17.65%) Risk Management
7 42 (17.65%) Vulnerability Assessment
8 37 (15.55%) Test Automation
9 32 (13.45%) Cloud Security
9 32 (13.45%) Security Architecture
10 28 (11.76%) Application Security
10 28 (11.76%) Problem-Solving
10 28 (11.76%) Red Team
11 27 (11.34%) Vulnerability Scanning
12 26 (10.92%) Security Management
13 25 (10.50%) Risk Assessment
14 24 (10.08%) Validation
Programming Languages
1 31 (13.03%) Python
2 28 (11.76%) PowerShell
3 22 (9.24%) Bash
4 7 (2.94%) Java
5 4 (1.68%) C
5 4 (1.68%) C++
5 4 (1.68%) JavaScript
5 4 (1.68%) Kotlin
5 4 (1.68%) Objective-C
5 4 (1.68%) SQL
6 3 (1.26%) C#
6 3 (1.26%) Go
6 3 (1.26%) Kusto Query Language
7 2 (0.84%) Ruby
8 1 (0.42%) Perl
Qualifications
1 69 (28.99%) Degree
2 41 (17.23%) CISSP
3 37 (15.55%) Security Cleared
4 36 (15.13%) SC Cleared
5 26 (10.92%) CREST Certified
6 22 (9.24%) CISM
7 20 (8.40%) ISTQB
7 20 (8.40%) OSCP
8 18 (7.56%) CEH
8 18 (7.56%) CompTIA Security+
9 17 (7.14%) Network+ Certification
10 12 (5.04%) Cisco Certification
11 9 (3.78%) CCNA
11 9 (3.78%) CCNP
11 9 (3.78%) Computer Science Degree
12 8 (3.36%) CCSAS
12 8 (3.36%) Master's Degree
12 8 (3.36%) Microsoft Certification
13 7 (2.94%) CISA
13 7 (2.94%) GIAC
Quality Assurance & Compliance
1 62 (26.05%) ISO/IEC 27001
2 54 (22.69%) NIST
3 19 (7.98%) GDPR
3 19 (7.98%) NCSC
4 14 (5.88%) Cyber Essentials
4 14 (5.88%) PCI DSS
5 11 (4.62%) QA
6 7 (2.94%) Cyber Essentials PLUS
7 6 (2.52%) Accessibility
7 6 (2.52%) GRC
8 5 (2.10%) NIST 800
9 4 (1.68%) Actionable Recommendations
9 4 (1.68%) Sarbanes-Oxley
9 4 (1.68%) SLA
9 4 (1.68%) SOC 2
10 2 (0.84%) ISO/IEC 17025
10 2 (0.84%) ISO/IEC 27002 (supersedes ISO/IEC 17799)
10 2 (0.84%) JTAG
11 1 (0.42%) COBIT
11 1 (0.42%) ISO/IEC 27005
System Software
1 29 (12.18%) Active Directory
2 19 (7.98%) VMware Infrastructure
3 11 (4.62%) vSphere
4 3 (1.26%) Hyper-V
5 2 (0.84%) Docker
5 2 (0.84%) Virtual Machines
6 1 (0.42%) Firmware
Systems Management
1 18 (7.56%) Terraform
2 14 (5.88%) Microsoft Intune
3 11 (4.62%) Ansible
3 11 (4.62%) Puppet
3 11 (4.62%) Single Sign-On
4 10 (4.20%) Kubernetes
4 10 (4.20%) Nessus
5 6 (2.52%) Jamf Pro
6 3 (1.26%) Nmap
6 3 (1.26%) QRadar
7 2 (0.84%) CASB
7 2 (0.84%) Istio
7 2 (0.84%) linkerd
8 1 (0.42%) Active Directory Federation Services
8 1 (0.42%) Argo
8 1 (0.42%) FortiGate
8 1 (0.42%) Grafana
8 1 (0.42%) Kibana
8 1 (0.42%) OpenVAS
8 1 (0.42%) Prometheus
Vendors
1 68 (28.57%) Microsoft
2 24 (10.08%) Cisco
3 20 (8.40%) VMware
4 12 (5.04%) Google
5 10 (4.20%) Palo Alto
6 7 (2.94%) Juniper
7 6 (2.52%) Meraki
7 6 (2.52%) Red Hat
8 3 (1.26%) Trustwave
9 2 (0.84%) Checkmarx
9 2 (0.84%) Dell
9 2 (0.84%) EMC
9 2 (0.84%) F5
9 2 (0.84%) Fortinet
9 2 (0.84%) LogRhythm
9 2 (0.84%) Qualys
9 2 (0.84%) SonicWALL
9 2 (0.84%) Splunk
10 1 (0.42%) Monzo
10 1 (0.42%) Tenable