Scaled Agile Framework (SAFe)
UK

The following table provides summary statistics for permanent job vacancies with a requirement for Scaled Agile Framework skills. Included is a benchmarking guide to the salaries offered in vacancies that have cited Scaled Agile Framework over the 6 months to 28 November 2023 with a comparison to the same period in the previous 2 years.

6 months to
28 Nov 2023
Same period 2022 Same period 2021
Rank 304 255 323
Rank change year-on-year -49 +68 +55
Permanent jobs citing Scaled Agile Framework 547 1,838 1,428
As % of all permanent jobs advertised in the UK 1.01% 1.46% 1.11%
As % of the Processes & Methodologies category 1.07% 1.53% 1.17%
Number of salaries quoted 226 588 771
10th Percentile £48,454 £46,926 £48,900
25th Percentile £55,000 £56,250 £56,250
Median annual salary (50th Percentile) £71,500 £72,500 £72,500
Median % change year-on-year -1.38% - +20.83%
75th Percentile £87,500 £92,500 £90,000
90th Percentile £112,500 £107,875 £102,500
UK excluding London median annual salary £67,500 £60,000 £65,000
% change year-on-year +12.50% -7.69% +8.33%

All Process and Methodology Skills
UK

Scaled Agile Framework is in the Processes and Methodologies category. The following table is for comparison with the above and provides summary statistics for all permanent job vacancies with a requirement for process or methodology skills.

Permanent vacancies with a requirement for process or methodology skills 51,121 120,104 122,523
As % of all permanent jobs advertised in the UK 94.09% 95.72% 95.43%
Number of salaries quoted 36,956 73,203 81,032
10th Percentile £32,500 £34,313 £32,500
25th Percentile £43,750 £45,000 £42,500
Median annual salary (50th Percentile) £60,000 £60,000 £59,000
Median % change year-on-year - +1.69% +7.27%
75th Percentile £80,000 £81,250 £77,500
90th Percentile £98,750 £100,000 £95,000
UK excluding London median annual salary £52,500 £53,000 £50,000
% change year-on-year -0.94% +6.00% +4.17%

Scaled Agile Framework
Job Vacancy Trend

Job postings citing Scaled Agile Framework as a proportion of all IT jobs advertised.
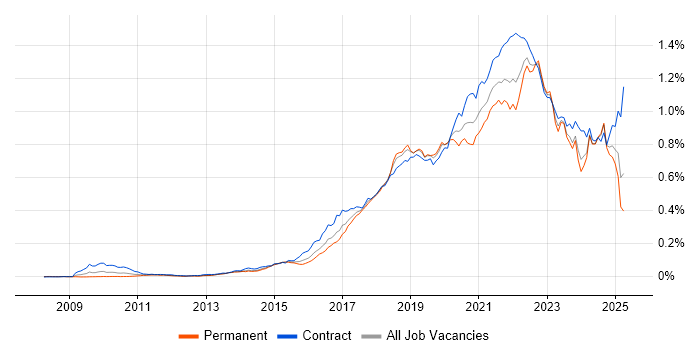
Job vacancy trend for Scaled Agile Framework in the UK

Scaled Agile Framework
Salary Trend

3-month moving average salary quoted in jobs citing Scaled Agile Framework.

Salary trend for Scaled Agile Framework in the UK

Scaled Agile Framework
Salary Histogram

Salary distribution for jobs citing Scaled Agile Framework over the 6 months to 28 November 2023.

Salary histogram for Scaled Agile Framework in the UK

Scaled Agile Framework
Top 17 Job Locations

The table below looks at the demand and provides a guide to the median salaries quoted in IT jobs citing Scaled Agile Framework within the UK over the 6 months to 28 November 2023. The 'Rank Change' column provides an indication of the change in demand within each location based on the same 6 month period last year.

Location Rank Change
on Same Period
Last Year
Matching
Permanent
IT Job Ads
Median Salary
Past 6 Months
Median Salary
% Change
on Same Period
Last Year
Live
Jobs
England -67 456 £72,000 -0.69% 139
UK excluding London -47 351 £67,500 +12.50% 81
Work from Home -30 267 £70,000 - 93
London -50 153 £85,000 +6.25% 61
North of England -34 98 £58,750 -5.24% 11
South East +55 93 £73,750 +22.92% 33
South West +43 52 £70,000 +12.00% 17
Yorkshire +94 48 £57,500 +1.77% 5
North West -52 46 £62,500 -21.88% 4
Midlands -22 42 £62,500 +13.64% 15
Scotland +43 36 £60,000 -50.00% 1
West Midlands -29 26 £62,000 +18.10% 15
East Midlands +41 16 £70,000 +16.67%
East of England +6 13 £55,000 -15.38% 3
Northern Ireland +46 11 £50,000 -
Wales +11 9 - - 1
North East +30 3 £52,500 +5.00% 2

Scaled Agile Framework
Co-occurring Skills and Capabilities by Category

The follow tables expand on the table above by listing co-occurrences grouped by category. The same employment type, locality and period is covered with up to 20 co-occurrences shown in each of the following categories:

Application Platforms
1 51 (9.32%) Confluence
2 15 (2.74%) SharePoint
3 8 (1.46%) Apache
4 6 (1.10%) Apache Spark
5 3 (0.55%) Moodle
6 2 (0.37%) CMS
6 2 (0.37%) nginx
7 1 (0.18%) Apache Solr
Applications
1 9 (1.65%) Microsoft Excel
1 9 (1.65%) Microsoft PowerPoint
2 8 (1.46%) MS Visio
3 7 (1.28%) Microsoft Office
4 6 (1.10%) Microsoft Project
5 2 (0.37%) Trello
6 1 (0.18%) Siemens NX
Business Applications
1 9 (1.65%) Dynamics CRM
2 3 (0.55%) Endur
2 3 (0.55%) Oracle EBS
2 3 (0.55%) Oracle Financials
2 3 (0.55%) Teamcenter
3 2 (0.37%) OpenLink RightAngle
3 2 (0.37%) Oracle ERP
4 1 (0.18%) SAP CRM
4 1 (0.18%) SAP S/4HANA
Cloud Services
1 215 (39.31%) Azure
2 153 (27.97%) AWS
3 54 (9.87%) SaaS
4 53 (9.69%) GCP
5 51 (9.32%) Azure DevOps
6 43 (7.86%) IaaS
6 43 (7.86%) PaaS
7 17 (3.11%) AWS CloudFormation
7 17 (3.11%) Serverless
8 13 (2.38%) Microsoft 365
9 9 (1.65%) OpenShift
10 8 (1.46%) AWS Lambda
10 8 (1.46%) GitHub
10 8 (1.46%) Power Platform
11 7 (1.28%) Cloud Computing
12 5 (0.91%) Amazon EKS
12 5 (0.91%) Azure Cosmos DB
12 5 (0.91%) Snowflake
13 4 (0.73%) Azure API Management
14 3 (0.55%) Salesforce Einstein
Communications & Networking
1 5 (0.91%) AMQP
2 4 (0.73%) SAN
3 3 (0.55%) Kerberos
4 2 (0.37%) Firewall
4 2 (0.37%) Network Security
5 1 (0.18%) 5G
5 1 (0.18%) Internet
5 1 (0.18%) Intranet
Database & Business Intelligence
1 81 (14.81%) Data Warehouse
2 13 (2.38%) SQL Server
3 12 (2.19%) InfluxDB
4 8 (1.46%) Relational Database
5 7 (1.28%) Big Data
5 7 (1.28%) Hadoop
6 5 (0.91%) Cloudera CDH
7 4 (0.73%) Data Vault
7 4 (0.73%) Delta Lake
7 4 (0.73%) NoSQL
7 4 (0.73%) PostgreSQL
8 3 (0.55%) Data Lake
8 3 (0.55%) Enterprise Data Warehouse
8 3 (0.55%) MySQL
9 2 (0.37%) Azure SQL Database
9 2 (0.37%) BigQuery
9 2 (0.37%) Metadata
9 2 (0.37%) MongoDB
9 2 (0.37%) Power BI
9 2 (0.37%) Redis
Development Applications
1 80 (14.63%) JIRA
2 39 (7.13%) Selenium
3 35 (6.40%) Git
4 34 (6.22%) Robot Framework
5 31 (5.67%) Jenkins
6 25 (4.57%) GitLab
7 12 (2.19%) SonarQube
8 8 (1.46%) TestRail
9 6 (1.10%) Bitbucket
10 4 (0.73%) CircleCI
11 2 (0.37%) GoogleTest
11 2 (0.37%) Maven
11 2 (0.37%) Sonatype Nexus
11 2 (0.37%) Spinnaker
11 2 (0.37%) Subversion
11 2 (0.37%) Team Foundation Server
11 2 (0.37%) TeamCity
12 1 (0.18%) Apache Continuum
12 1 (0.18%) git-flow
General
1 129 (23.58%) Social Skills
2 86 (15.72%) Finance
3 57 (10.42%) Analytical Skills
4 55 (10.05%) Inclusion and Diversity
5 27 (4.94%) Retail
6 26 (4.75%) Banking
7 25 (4.57%) Public Sector
8 19 (3.47%) Presentation Skills
9 17 (3.11%) Marketing
10 14 (2.56%) Influencing Skills
10 14 (2.56%) Legal
11 13 (2.38%) Aviation
12 7 (1.28%) Automotive
13 6 (1.10%) Investment Banking
13 6 (1.10%) Law
14 5 (0.91%) Aerospace
15 4 (0.73%) Manufacturing
15 4 (0.73%) Organisational Skills
15 4 (0.73%) Telecoms
16 3 (0.55%) Electronics
Job Titles
1 128 (23.40%) Senior
2 114 (20.84%) Architect
3 94 (17.18%) Solutions Architect
4 78 (14.26%) Analyst
4 78 (14.26%) Senior Architect
5 73 (13.35%) Lead
5 73 (13.35%) Senior Solutions Architect
6 50 (9.14%) DevOps Engineer
7 45 (8.23%) Project Manager
8 40 (7.31%) Business Analyst
9 24 (4.39%) Applications Engineer
9 24 (4.39%) Developer
9 24 (4.39%) Solutions Analyst
10 21 (3.84%) Product Owner
11 18 (3.29%) Scrum Master
12 16 (2.93%) Software Engineer
13 14 (2.56%) Consultant
13 14 (2.56%) Senior Manager
13 14 (2.56%) Technical Leader
14 13 (2.38%) Azure Engineer
Libraries, Frameworks & Software Standards
1 17 (3.11%) REST
2 15 (2.74%) Node.js
2 15 (2.74%) React
3 14 (2.56%) Kafka
4 13 (2.38%) .NET
4 13 (2.38%) Elastic Stack
5 12 (2.19%) Spring Boot
6 11 (2.01%) YAML
7 10 (1.83%) Spring
8 9 (1.65%) ADO
8 9 (1.65%) Next.js
8 9 (1.65%) RabbitMQ
9 8 (1.46%) AngularJS
9 8 (1.46%) Jest
10 7 (1.28%) gRPC
10 7 (1.28%) JSON
11 6 (1.10%) GraphQL
11 6 (1.10%) React Native
11 6 (1.10%) Web Services
12 5 (0.91%) HTML
Miscellaneous
1 92 (16.82%) Cloud Native
2 88 (16.09%) Product Ownership
3 76 (13.89%) Data Structures
4 61 (11.15%) Public Cloud
5 25 (4.57%) Client/Server
6 20 (3.66%) Self-Motivation
7 16 (2.93%) Mobile App
8 15 (2.74%) Distributed Systems
9 12 (2.19%) Onboarding
10 10 (1.83%) IoT
11 8 (1.46%) PMI
12 7 (1.28%) Low-Code
12 7 (1.28%) Management Information System
13 4 (0.73%) Reinsurance
14 3 (0.55%) CMDB
15 2 (0.37%) Blockchain
15 2 (0.37%) Data Centre
15 2 (0.37%) Greenfield Project
16 1 (0.18%) Hybrid Cloud
16 1 (0.18%) Virtual Team
Operating Systems
1 47 (8.59%) Linux
2 41 (7.50%) Windows
3 29 (5.30%) Red Hat Enterprise Linux
4 24 (4.39%) Windows Server
5 13 (2.38%) Apple iOS
6 12 (2.19%) Android
7 5 (0.91%) CentOS
7 5 (0.91%) Debian
7 5 (0.91%) Ubuntu
8 2 (0.37%) QNX Neutrino
8 2 (0.37%) Unix
Processes & Methodologies
1 539 (98.54%) Agile
2 308 (56.31%) Scrum
3 188 (34.37%) Actionable Insight
4 166 (30.35%) DevOps
5 137 (25.05%) TOGAF
6 122 (22.30%) Kanban
7 99 (18.10%) Roadmaps
8 98 (17.92%) Business Case
9 92 (16.82%) Enterprise Architecture
10 87 (15.90%) Software Delivery
11 84 (15.36%) Presales
12 81 (14.81%) Design Patterns
13 72 (13.16%) Conceptual Models
14 69 (12.61%) Business Analysis
15 67 (12.25%) Stakeholder Management
16 65 (11.88%) CI/CD
16 65 (11.88%) Containerisation
17 61 (11.15%) DevSecOps
17 61 (11.15%) Microservices
18 59 (10.79%) Infrastructure as Code
Programming Languages
1 93 (17.00%) Python
2 52 (9.51%) Bash
3 45 (8.23%) PowerShell
4 41 (7.50%) Java
5 24 (4.39%) C#
5 24 (4.39%) VBScript
6 21 (3.84%) JavaScript
6 21 (3.84%) SQL
7 9 (1.65%) TypeScript
8 6 (1.10%) C++
9 4 (0.73%) Apex Code
10 2 (0.37%) C
10 2 (0.37%) Delphi
10 2 (0.37%) R
10 2 (0.37%) Scala
11 1 (0.18%) Go
11 1 (0.18%) JCL
11 1 (0.18%) MATLAB
11 1 (0.18%) Perl
11 1 (0.18%) Swift
Qualifications
1 118 (21.57%) Security Cleared
2 76 (13.89%) TOGAF Certification
3 65 (11.88%) Degree
4 64 (11.70%) SC Cleared
5 50 (9.14%) DV Cleared
6 18 (3.29%) PMI Certification
7 15 (2.74%) Computer Science Degree
8 12 (2.19%) PMP
9 11 (2.01%) Master's Degree
10 10 (1.83%) ISTQB
11 8 (1.46%) BPSS Clearance
12 7 (1.28%) ISTQB Foundation Certification
13 6 (1.10%) Azure Certification
14 5 (0.91%) APMP
15 3 (0.55%) CEH
15 3 (0.55%) CITP
15 3 (0.55%) GIAC
15 3 (0.55%) MBCS
15 3 (0.55%) OSCP
15 3 (0.55%) PRINCE2 Practitioner
Quality Assurance & Compliance
1 37 (6.76%) QA
2 12 (2.19%) COBIT
3 11 (2.01%) PMO
4 7 (1.28%) ISO/IEC 20000
5 6 (1.10%) Data Quality
6 3 (0.55%) ISO 20022
6 3 (0.55%) P3O
7 1 (0.18%) GxP
7 1 (0.18%) Sarbanes-Oxley
System Software
1 38 (6.95%) Active Directory
2 33 (6.03%) Docker
3 27 (4.94%) VMware Infrastructure
4 7 (1.28%) IAG
5 4 (0.73%) Firmware
6 3 (0.55%) Embedded Firmware
6 3 (0.55%) Virtual Desktop
7 1 (0.18%) Apache Flume
7 1 (0.18%) HDFS
Systems Management
1 84 (15.36%) Kubernetes
2 64 (11.70%) Terraform
3 57 (10.42%) Ansible
4 12 (2.19%) Grafana
4 12 (2.19%) Prometheus
5 5 (0.91%) Puppet
6 4 (0.73%) NetBackup
6 4 (0.73%) WSUS
7 1 (0.18%) Apache Ranger
7 1 (0.18%) Control-M
7 1 (0.18%) Hadoop YARN
7 1 (0.18%) Oozie
7 1 (0.18%) SCCM
7 1 (0.18%) SysTrack
Vendors
1 58 (10.60%) Oracle
2 31 (5.67%) Microsoft
2 31 (5.67%) VMware
3 23 (4.20%) Salesforce
4 19 (3.47%) ServiceNow
5 9 (1.65%) Google
6 8 (1.46%) Atlassian
7 7 (1.28%) Informatica
7 7 (1.28%) Siebel
8 6 (1.10%) Apple
8 6 (1.10%) Databricks
8 6 (1.10%) SAP
9 5 (0.91%) Red Hat
9 5 (0.91%) SaltStack
10 4 (0.73%) Cadence
10 4 (0.73%) Cisco
10 4 (0.73%) F5
10 4 (0.73%) Fortinet
10 4 (0.73%) McAfee
10 4 (0.73%) Siemens