API Integration Jobs with Hybrid/Remote/WFH Options

API Integration
UK > Work from Home

The table below provides summary statistics for permanent remote or hybrid work requiring API Integration skills. It includes a benchmarking guide to the annual salaries offered in vacancies that cited API Integration over the 6 months leading up to 2 May 2025, comparing them to the same period in the previous two years.

6 months to
2 May 2025
Same period 2024 Same period 2023
Rank 285 420 530
Rank change year-on-year +135 +110 -109
Permanent jobs citing API Integration 130 172 142
As % of all permanent jobs with a WFH option 0.87% 0.51% 0.33%
As % of the Processes & Methodologies category 0.93% 0.55% 0.35%
Number of salaries quoted 114 156 113
10th Percentile £45,000 £44,375 £44,152
25th Percentile £47,666 £49,875 £52,000
Median annual salary (50th Percentile) £60,000 £63,750 £67,500
Median % change year-on-year -5.88% -5.56% -20.59%
75th Percentile £81,875 £82,500 £92,500
90th Percentile £83,750 £91,250 £102,000
UK median annual salary £75,000 £55,000 £65,000
% change year-on-year +36.36% -15.38% -13.33%

All Process and Methodology Skills
Work from Home

API Integration falls under the Processes and Methodologies category. For comparison with the information above, the following table provides summary statistics for all permanent job vacancies with remote or hybrid options requiring process or methodology skills.

Permanent vacancies with a requirement for process or methodology skills 13,938 31,020 41,026
As % of all permanent jobs with a WFH option 93.13% 91.65% 96.09%
Number of salaries quoted 9,733 23,575 28,496
10th Percentile £30,000 £33,800 £37,500
25th Percentile £45,000 £42,500 £47,500
Median annual salary (50th Percentile) £60,000 £57,500 £62,500
Median % change year-on-year +4.35% -8.00% +4.17%
75th Percentile £77,500 £75,000 £82,500
90th Percentile £102,500 £95,000 £100,000
UK median annual salary £57,500 £55,000 £61,500
% change year-on-year +4.55% -10.57% +2.50%

API Integration
Trend for Jobs with a WFH Option

Job vacancies with remote working options citing API Integration as a proportion of all IT jobs advertised.
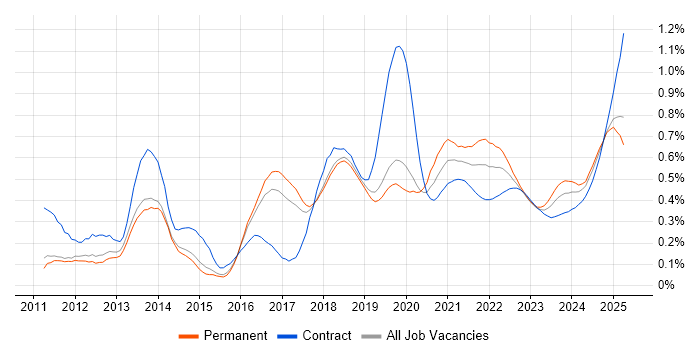
API Integration trend for jobs with Hybrid/Remote/WFH options

API Integration
Salary Trend for Jobs with a WFH Option

3-month moving average salary quoted in job vacancies with remote working options citing API Integration.

API Integration salary trend for jobs with a WFH option

API Integration
Salary Histogram for Jobs with a WFH Option

Salary distribution for jobs with remote working options citing API Integration over the 6 months to 2 May 2025.

API Integration salary histogram for jobs with a WFH option

API Integration
Co-occurring Skills and Capabilities with WFH Options by Category

The follow tables expand on the table above by listing co-occurrences grouped by category. The same employment type, locality and period is covered with up to 20 co-occurrences shown in each of the following categories:

Application Platforms
1 3 (2.31%) OpenEdge
2 2 (1.54%) CMS
3 1 (0.77%) IIS
3 1 (0.77%) Umbraco
Applications
1 3 (2.31%) Microsoft Excel
2 2 (1.54%) Microsoft Office
3 1 (0.77%) Microsoft PowerPoint
3 1 (0.77%) MS Visio
Business Applications
1 12 (9.23%) Oracle EBS
2 5 (3.85%) Dynamics CRM
2 5 (3.85%) NetSuite
3 2 (1.54%) Shopify
4 1 (0.77%) Elite 3E
4 1 (0.77%) Magento
Cloud Services
1 65 (50.00%) Azure
2 44 (33.85%) Azure DevOps
3 26 (20.00%) Azure Service Bus
4 24 (18.46%) Azure Cosmos DB
4 24 (18.46%) SonarCloud
5 20 (15.38%) AWS
6 15 (11.54%) Microsoft 365
7 9 (6.92%) Azure Logic Apps
8 8 (6.15%) Power Platform
8 8 (6.15%) SaaS
9 6 (4.62%) Entra ID
10 4 (3.08%) Azure Key Vault
10 4 (3.08%) GitHub
10 4 (3.08%) Microsoft Purview
10 4 (3.08%) PowerApps
11 3 (2.31%) Apigee
12 2 (1.54%) GCP
12 2 (1.54%) GitHub Copilot
12 2 (1.54%) Serverless
12 2 (1.54%) Slack
Communications & Networking
1 8 (6.15%) HTTP
2 6 (4.62%) VPN
3 4 (3.08%) HTTPS
4 2 (1.54%) Firewall
4 2 (1.54%) Network Security
5 1 (0.77%) DNS
5 1 (0.77%) TCP/IP
Database & Business Intelligence
1 24 (18.46%) Elasticsearch
2 20 (15.38%) SQL Server
3 9 (6.92%) PostgreSQL
4 8 (6.15%) MongoDB
5 6 (4.62%) MySQL
6 4 (3.08%) Power BI
7 2 (1.54%) Azure SQL Database
7 2 (1.54%) NoSQL
7 2 (1.54%) Relational Database
7 2 (1.54%) SQL Server Integration Services
7 2 (1.54%) Tableau
8 1 (0.77%) Amazon Aurora
8 1 (0.77%) Amazon RDS
8 1 (0.77%) DynamoDB
8 1 (0.77%) FileMaker
8 1 (0.77%) Oracle Database
8 1 (0.77%) Power Query
8 1 (0.77%) SQL Server Reporting Services
Development Applications
1 52 (40.00%) Git
2 32 (24.62%) Visual Studio
3 24 (18.46%) MSBuild
3 24 (18.46%) Octopus Deploy
3 24 (18.46%) Team Foundation Server
4 8 (6.15%) JUnit
4 8 (6.15%) NUnit
5 6 (4.62%) JIRA
5 6 (4.62%) Mocha
6 4 (3.08%) WiX
7 3 (2.31%) Postman
7 3 (2.31%) webpack
8 2 (1.54%) Babel
8 2 (1.54%) Bitbucket
8 2 (1.54%) git-flow
8 2 (1.54%) SQL Server Management Studio (SSMS)
8 2 (1.54%) Visual Studio Code
8 2 (1.54%) Xcode
9 1 (0.77%) CircleCI
9 1 (0.77%) Oracle APEX
General
1 32 (24.62%) Retail
2 31 (23.85%) Social Skills
3 25 (19.23%) Finance
4 21 (16.15%) Banking
5 18 (13.85%) Legal
6 15 (11.54%) Inclusion and Diversity
7 10 (7.69%) Analytical Skills
8 7 (5.38%) Documentation Skills
9 6 (4.62%) Aerospace
9 6 (4.62%) Public Sector
10 3 (2.31%) Law
11 2 (1.54%) Investment Banking
11 2 (1.54%) Marketing
12 1 (0.77%) Financial Institution
12 1 (0.77%) French Language
Job Titles
1 46 (35.38%) Developer
2 26 (20.00%) Architect
3 24 (18.46%) Technical Architect
4 18 (13.85%) .NET Developer
5 17 (13.08%) Graduate
6 13 (10.00%) C# Developer
7 11 (8.46%) Senior
8 10 (7.69%) Lead
9 9 (6.92%) Senior Developer
10 8 (6.15%) React Developer
11 7 (5.38%) Full-Stack Developer
11 7 (5.38%) Systems Engineer
12 6 (4.62%) Applications Developer
12 6 (4.62%) C# .NET Developer
12 6 (4.62%) Lead Systems Engineer
12 6 (4.62%) Project Engineer
12 6 (4.62%) Project Leader
12 6 (4.62%) Senior .NET Developer
13 5 (3.85%) Azure Developer
13 5 (3.85%) Front-End Developer (Client-Side Developer)
Libraries, Frameworks & Software Standards
1 65 (50.00%) .NET
2 50 (38.46%) REST
3 33 (25.38%) ASP.NET
3 33 (25.38%) HTML
4 32 (24.62%) CSS
5 30 (23.08%) JSON
5 30 (23.08%) XML
6 25 (19.23%) Bootstrap
7 24 (18.46%) gRPC
8 20 (15.38%) React
9 16 (12.31%) .NET Framework
9 16 (12.31%) Node.js
10 14 (10.77%) Jest
11 13 (10.00%) Entity Framework
12 11 (8.46%) RESTful
12 11 (8.46%) SOAP
13 10 (7.69%) .NET Core
13 10 (7.69%) Kafka
13 10 (7.69%) Web Services
14 8 (6.15%) AngularJS
Miscellaneous
1 20 (15.38%) Mobile App
2 17 (13.08%) Hackathon
2 17 (13.08%) Learning Management System
3 6 (4.62%) Security Operations Centre
3 6 (4.62%) Security Posture
4 4 (3.08%) Self-Motivation
4 4 (3.08%) Wiki
5 3 (2.31%) Clustering
5 3 (2.31%) Legacy Code
5 3 (2.31%) NHS
5 3 (2.31%) Virtual Team
6 2 (1.54%) Cyber Threat
6 2 (1.54%) Data Protection Act
6 2 (1.54%) Legacy Systems
7 1 (0.77%) Digital Media
7 1 (0.77%) Foreign Exchange (FX)
7 1 (0.77%) Low-Code
7 1 (0.77%) Management Information System
7 1 (0.77%) Replication
7 1 (0.77%) SWIFT Messaging Network
Operating Systems
1 9 (6.92%) Linux
2 5 (3.85%) Windows
3 4 (3.08%) Mac OS
3 4 (3.08%) Windows 10
4 3 (2.31%) Android
4 3 (2.31%) Apple iOS
4 3 (2.31%) Solaris
5 2 (1.54%) Unix
6 1 (0.77%) Windows Server
6 1 (0.77%) Windows Server 2008
6 1 (0.77%) Windows Server 2019
Processes & Methodologies
1 77 (59.23%) DevOps
2 61 (46.92%) Problem-Solving
3 53 (40.77%) Agile
4 39 (30.00%) API Development
5 34 (26.15%) Design Patterns
5 34 (26.15%) Microservices
6 31 (23.85%) MVC
7 29 (22.31%) Code Quality
8 28 (21.54%) CI/CD
9 27 (20.77%) Performance Optimisation
10 24 (18.46%) Artificial Intelligence
10 24 (18.46%) Data Encryption
10 24 (18.46%) Event-Driven
10 24 (18.46%) Event-Driven Architecture
10 24 (18.46%) Performance Testing
10 24 (18.46%) Software Engineering
10 24 (18.46%) Technical Leadership
11 23 (17.69%) Cybersecurity
12 20 (15.38%) Containerisation
12 20 (15.38%) Fintech
Programming Languages
1 74 (56.92%) C#
2 59 (45.38%) JavaScript
3 43 (33.08%) SQL
4 25 (19.23%) Python
5 24 (18.46%) Java
6 19 (14.62%) Kotlin
7 8 (6.15%) TypeScript
8 7 (5.38%) Bash
8 7 (5.38%) PowerShell
9 4 (3.08%) C++
10 3 (2.31%) OpenEdge ABL
10 3 (2.31%) Perl
10 3 (2.31%) Progress 4GL
11 2 (1.54%) Kusto Query Language
11 2 (1.54%) PHP
11 2 (1.54%) Swift
11 2 (1.54%) T-SQL
11 2 (1.54%) VB
12 1 (0.77%) VB.NET
12 1 (0.77%) VBA
Qualifications
1 23 (17.69%) Degree
2 17 (13.08%) Master's Degree
2 17 (13.08%) PhD
3 14 (10.77%) SC Cleared
3 14 (10.77%) Security Cleared
4 6 (4.62%) Azure Certification
5 2 (1.54%) CEH
5 2 (1.54%) CISM
5 2 (1.54%) CISSP
5 2 (1.54%) Computer Science Degree
5 2 (1.54%) GIAC
5 2 (1.54%) ISSAP
5 2 (1.54%) Microsoft Certification
5 2 (1.54%) SANS
6 1 (0.77%) Numerate Degree
Quality Assurance & Compliance
1 29 (22.31%) GDPR
2 6 (4.62%) Def Stans
3 3 (2.31%) Sarbanes-Oxley
4 2 (1.54%) COBIT
4 2 (1.54%) Cyber Essentials
4 2 (1.54%) Cyber Essentials PLUS
4 2 (1.54%) ISO/IEC 27001
4 2 (1.54%) NIST
4 2 (1.54%) PCI DSS
4 2 (1.54%) QA
4 2 (1.54%) SOC 2
5 1 (0.77%) Accessibility
5 1 (0.77%) Data Quality
System Software
1 37 (28.46%) Docker
2 6 (4.62%) Active Directory
Systems Management
1 12 (9.23%) Kubernetes
2 4 (3.08%) Ansible
2 4 (3.08%) Microsoft Intune
3 1 (0.77%) Red Hat Satellite
3 1 (0.77%) Terraform
Vendors
1 49 (37.69%) Microsoft
2 20 (15.38%) IBM
3 18 (13.85%) Google
4 16 (12.31%) Oracle
5 8 (6.15%) Okta
6 6 (4.62%) VMware
7 3 (2.31%) Progress
7 3 (2.31%) Red Hat
8 2 (1.54%) MuleSoft
9 1 (0.77%) Cognos
9 1 (0.77%) Databricks
9 1 (0.77%) Intapp
9 1 (0.77%) Salesforce