Active Directory Jobs in England

Microsoft Active Directory
UK > England

The table below provides summary statistics for permanent job vacancies advertised in England requiring Active Directory skills. It includes a benchmarking guide to the annual salaries offered in vacancies that cited Active Directory over the 6 months leading up to 29 May 2025, comparing them to the same period in the previous two years.

6 months to
29 May 2025
Same period 2024 Same period 2023
Rank 51 27 46
Rank change year-on-year -24 +19 +28
Permanent jobs citing Active Directory 2,401 5,499 5,049
As % of all permanent jobs advertised in England 4.95% 6.19% 5.83%
As % of the System Software category 41.66% 51.32% 37.25%
Number of salaries quoted 1,632 4,408 4,229
10th Percentile £26,250 £24,500 £25,420
25th Percentile £29,750 £28,250 £30,500
Median annual salary (50th Percentile) £39,000 £37,500 £40,000
Median % change year-on-year +4.00% -6.25% -
75th Percentile £52,500 £52,500 £57,250
90th Percentile £73,000 £65,000 £72,500
UK median annual salary £39,000 £37,500 £40,000
% change year-on-year +4.00% -6.25% -

All System Software Skills
England

Active Directory falls under the System Software category. For comparison with the information above, the following table provides summary statistics for all permanent job vacancies requiring system software skills in England.

Permanent vacancies with a requirement for system software skills 5,763 10,715 13,556
As % of all permanent jobs advertised in England 11.87% 12.06% 15.66%
Number of salaries quoted 3,297 8,571 9,101
10th Percentile £27,900 £26,250 £27,750
25th Percentile £35,750 £32,500 £37,500
Median annual salary (50th Percentile) £52,500 £50,000 £55,000
Median % change year-on-year +5.00% -9.09% -
75th Percentile £77,500 £67,500 £77,500
90th Percentile £97,500 £86,250 £95,000
UK median annual salary £54,000 £50,000 £55,000
% change year-on-year +8.00% -9.09% -0.90%

Active Directory
Job Vacancy Trend in England

Job postings citing Active Directory as a proportion of all IT jobs advertised in England.
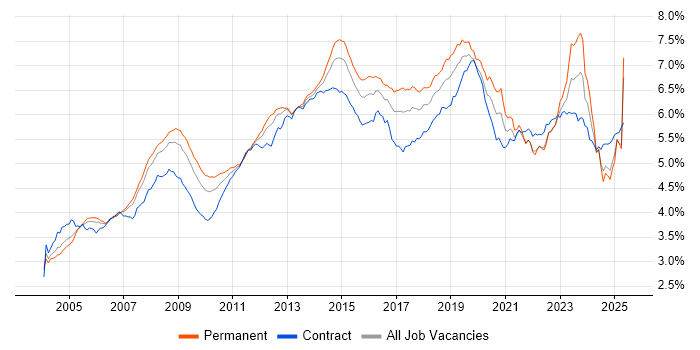
Job vacancy trend for Active Directory in England

Active Directory
Salary Trend in England

3-month moving average salary quoted in jobs citing Active Directory in England.

Salary trend for Active Directory in England

Active Directory
Salary Histogram in England

Salary distribution for jobs citing Active Directory in England over the 6 months to 29 May 2025.

Salary histogram for Active Directory in England

Active Directory
Job Locations in England

The table below looks at the demand and provides a guide to the median salaries quoted in IT jobs citing Active Directory within the England region over the 6 months to 29 May 2025. The 'Rank Change' column provides an indication of the change in demand within each location based on the same 6 month period last year.

Location Rank Change
on Same Period
Last Year
Matching
Permanent
IT Job Ads
Median Salary
Past 6 Months
Median Salary
% Change
on Same Period
Last Year
Live
Jobs
London -15 706 £50,000 - 329
North of England -64 404 £31,000 -11.43% 498
South East -35 381 £40,000 +6.67% 697
Midlands -13 378 £32,500 -2.99% 403
East of England -25 244 £32,500 +4.84% 332
West Midlands -11 222 £35,000 +1.82% 202
Yorkshire +1 220 £30,000 -7.69% 195
South West -23 166 £32,500 -13.33% 284
East Midlands -24 156 £31,500 -3.08% 176
North West -130 134 £37,500 - 233
North East -15 50 £32,000 -3.03% 76
Active Directory
UK

Active Directory
Co-occurring Skills and Capabilities in England by Category

The follow tables expand on the table above by listing co-occurrences grouped by category. The same employment type, locality and period is covered with up to 20 co-occurrences shown in each of the following categories:

Application Platforms
1 558 (23.24%) Microsoft Exchange
2 354 (14.74%) SharePoint
3 62 (2.58%) IIS
4 16 (0.67%) Confluence
5 14 (0.58%) Exchange Server 2013
6 12 (0.50%) Tomcat
7 11 (0.46%) IBM Domino
7 11 (0.46%) Skype for Business
8 9 (0.37%) Apache
8 9 (0.37%) Exchange Server 2010
9 5 (0.21%) Liferay
9 5 (0.21%) nginx
10 4 (0.17%) Blackberry Enterprise Server
11 3 (0.12%) Exchange Server 2007
11 3 (0.12%) Office Communications Server
11 3 (0.12%) SharePoint Server
11 3 (0.12%) WordPress
12 2 (0.083%) BizTalk Server
12 2 (0.083%) WebSphere
12 2 (0.083%) WebSphere Application Server
Applications
1 283 (11.79%) Microsoft Office
2 91 (3.79%) Microsoft Excel
3 36 (1.50%) Microsoft PowerPoint
4 10 (0.42%) MS Visio
5 7 (0.29%) Chatbot
5 7 (0.29%) Mozilla Thunderbird
6 5 (0.21%) Adobe Creative Suite
7 2 (0.083%) Acrobat
7 2 (0.083%) AutoCAD
8 1 (0.042%) Microsoft Project
8 1 (0.042%) Revit
8 1 (0.042%) Sketch
Business Applications
1 22 (0.92%) Dynamics NAV
2 7 (0.29%) SAP Business One
2 7 (0.29%) SAP ERP
3 6 (0.25%) Elite 3E
3 6 (0.25%) Sage 50
4 4 (0.17%) Carpe Diem
4 4 (0.17%) Fidessa
4 4 (0.17%) Sage 200
5 3 (0.12%) Dynamics CRM
6 2 (0.083%) Oracle EBS
7 1 (0.042%) assyst
7 1 (0.042%) Dynamics GP
7 1 (0.042%) Eikon
7 1 (0.042%) NetSuite
7 1 (0.042%) Oracle Applications
7 1 (0.042%) Oracle ERP
7 1 (0.042%) Oracle Payables
7 1 (0.042%) PeopleSoft HCM
7 1 (0.042%) Remedy ITSM
7 1 (0.042%) SAP S/4HANA
Cloud Services
1 1,231 (51.27%) Microsoft 365
2 1,086 (45.23%) Azure
3 623 (25.95%) Entra ID
4 288 (12.00%) AWS
5 161 (6.71%) OneDrive
6 99 (4.12%) Serverless
7 89 (3.71%) AWS Lambda
8 61 (2.54%) Mimecast
9 47 (1.96%) Power Platform
10 43 (1.79%) SaaS
11 42 (1.75%) Google Workspace
11 42 (1.75%) IaaS
12 38 (1.58%) Cloud Computing
13 32 (1.33%) PaaS
14 31 (1.29%) GCP
15 28 (1.17%) Microsoft Copilot
15 28 (1.17%) Power Automate
16 27 (1.12%) Dynamics 365
17 24 (1.00%) Azure Monitor
17 24 (1.00%) Nutanix
Communications & Networking
1 568 (23.66%) Firewall
2 437 (18.20%) DNS
3 346 (14.41%) DHCP
4 299 (12.45%) Broadband
5 275 (11.45%) WAN
6 260 (10.83%) LAN
7 232 (9.66%) VPN
8 173 (7.21%) VLAN
9 168 (7.00%) TCP/IP
10 146 (6.08%) VoIP
11 119 (4.96%) SSL
12 117 (4.87%) SAN
13 113 (4.71%) Wi-Fi
14 92 (3.83%) SSH
15 87 (3.62%) Wireless
16 76 (3.17%) Network Security
17 59 (2.46%) Remote Desktop
18 49 (2.04%) NAS
19 48 (2.00%) Cisco IOS
20 45 (1.87%) SD-WAN
Database & Business Intelligence
1 127 (5.29%) SQL Server
2 54 (2.25%) Amazon RDS
3 26 (1.08%) Power BI
4 17 (0.71%) PostgreSQL
5 12 (0.50%) Azure SQL Database
6 10 (0.42%) Data Warehouse
7 6 (0.25%) NoSQL
8 5 (0.21%) Azure SQL Data Warehouse
9 3 (0.12%) Metadata
9 3 (0.12%) MySQL
9 3 (0.12%) Oracle Database
10 2 (0.083%) Data Lake
10 2 (0.083%) EDMS
10 2 (0.083%) HDInsight
10 2 (0.083%) MongoDB
10 2 (0.083%) Oracle Reports
10 2 (0.083%) SQL Server Reporting Services
10 2 (0.083%) Star Schema
10 2 (0.083%) Tableau
11 1 (0.042%) Amazon QuickSight
Development Applications
1 42 (1.75%) JIRA
2 25 (1.04%) Jenkins
3 22 (0.92%) Git
4 14 (0.58%) Vagrant
5 10 (0.42%) Sonatype Nexus
6 7 (0.29%) Bitbucket Server
6 7 (0.29%) GitLab
7 3 (0.12%) Artifactory
7 3 (0.12%) Atlassian Bamboo
7 3 (0.12%) Bitbucket
8 2 (0.083%) Metasploit
8 2 (0.083%) Octopus Deploy
9 1 (0.042%) Selenium
9 1 (0.042%) Spinnaker
9 1 (0.042%) TeamCity
9 1 (0.042%) TestRail
9 1 (0.042%) Visual Studio
9 1 (0.042%) Visual Studio Code
9 1 (0.042%) WiX
9 1 (0.042%) YouTrack
General
1 1,063 (44.27%) Social Skills
2 225 (9.37%) Finance
3 164 (6.83%) Analytical Skills
4 119 (4.96%) Law
5 108 (4.50%) Inclusion and Diversity
6 102 (4.25%) Retail
7 91 (3.79%) Legal
8 67 (2.79%) Organisational Skills
9 58 (2.42%) Manufacturing
10 53 (2.21%) Public Sector
11 37 (1.54%) Banking
12 35 (1.46%) Telecoms
13 28 (1.17%) Automotive
14 21 (0.87%) Games
14 21 (0.87%) German Language
15 18 (0.75%) Advertising
16 16 (0.67%) Documentation Skills
17 15 (0.62%) Presentation Skills
18 11 (0.46%) Marketing
19 10 (0.42%) Aerospace
Job Titles
1 572 (23.82%) Support Engineer
2 526 (21.91%) IT Support
3 406 (16.91%) Analyst
4 261 (10.87%) IT Engineer
5 249 (10.37%) Support Analyst
6 227 (9.45%) 2nd Line Support
7 222 (9.25%) Infrastructure Engineer
8 170 (7.08%) IT Analyst
9 165 (6.87%) Senior
10 153 (6.37%) IT Support Engineer
11 135 (5.62%) IT Support Analyst
12 123 (5.12%) Cloud Engineer
13 120 (5.00%) Desktop Support
14 109 (4.54%) 1st Line Support
15 100 (4.16%) DevOps Engineer
16 95 (3.96%) Infrastructure Support
17 92 (3.83%) Service Analyst
18 91 (3.79%) 3rd Line Support
19 89 (3.71%) Administrator
20 87 (3.62%) Service Desk Analyst
Libraries, Frameworks & Software Standards
1 85 (3.54%) Web Services
2 82 (3.42%) RESTful
3 28 (1.17%) SailPoint
4 22 (0.92%) SAML
5 20 (0.83%) LDAP
6 15 (0.62%) JSON
7 12 (0.50%) REST
8 11 (0.46%) XML
8 11 (0.46%) YAML
9 10 (0.42%) SOAP
10 8 (0.33%) OAuth
10 8 (0.33%) React
11 7 (0.29%) CSS
11 7 (0.29%) EDI
11 7 (0.29%) HTML
12 6 (0.25%) .NET
13 5 (0.21%) 802.1X
13 5 (0.21%) OpenID
14 4 (0.17%) ARM Templates
15 3 (0.12%) Elastic Stack
Miscellaneous
1 173 (7.21%) Onboarding
2 163 (6.79%) Management Information System
3 129 (5.37%) PKI
4 127 (5.29%) Driving Licence
5 91 (3.79%) Cyber Threat
6 82 (3.42%) Cyberattack
7 73 (3.04%) NHS
8 70 (2.92%) Operational Technology
9 67 (2.79%) Data Centre
10 57 (2.37%) CCTV
11 55 (2.29%) Self-Motivation
12 53 (2.21%) Clustering
13 45 (1.87%) Video Conferencing
14 32 (1.33%) iPhone
15 29 (1.21%) Data Protection Act
16 28 (1.17%) Enterprise Software
16 28 (1.17%) Social Media
16 28 (1.17%) Virtual Team
17 27 (1.12%) Replication
18 24 (1.00%) Public Cloud
Operating Systems
1 1,721 (71.68%) Windows
2 719 (29.95%) Windows Server
3 382 (15.91%) Windows 10
4 270 (11.25%) Windows Server 2012
5 248 (10.33%) Linux
6 146 (6.08%) Mac OS
7 134 (5.58%) Windows Server 2016
8 112 (4.66%) Windows Server 2019
9 93 (3.87%) Android
10 83 (3.46%) Apple iOS
11 45 (1.87%) Mac OS X
12 39 (1.62%) Windows 7
13 33 (1.37%) VMS
14 29 (1.21%) Unix
15 24 (1.00%) Ubuntu
16 14 (0.58%) Windows Server 2008
17 11 (0.46%) Red Hat Enterprise Linux
18 9 (0.37%) CentOS
18 9 (0.37%) Windows 8
19 8 (0.33%) AIX
Processes & Methodologies
1 560 (23.32%) Problem-Solving
2 460 (19.16%) Customer Service
3 440 (18.33%) ITIL
4 357 (14.87%) Cybersecurity
5 268 (11.16%) Infrastructure Engineering
6 250 (10.41%) Coaching
7 235 (9.79%) Proactive Monitoring
8 228 (9.50%) Proactive Maintenance
9 215 (8.95%) Broadcast Engineering
9 215 (8.95%) Post-Production
9 215 (8.95%) Procure-to-Pay
10 163 (6.79%) DevOps
11 153 (6.37%) Identity Management
12 145 (6.04%) Roadmaps
13 144 (6.00%) Disaster Recovery
14 143 (5.96%) Mentoring
15 139 (5.79%) Continuous Improvement
16 132 (5.50%) ITSM
17 120 (5.00%) Incident Management
18 113 (4.71%) Service Delivery
Programming Languages
1 435 (18.12%) PowerShell
2 203 (8.45%) Python
3 175 (7.29%) SQL
4 37 (1.54%) Bash
5 24 (1.00%) Java
6 19 (0.79%) JavaScript
7 13 (0.54%) Groovy
8 12 (0.50%) Shell Script
9 9 (0.37%) Perl
9 9 (0.37%) VBA
10 5 (0.21%) Bicep
10 5 (0.21%) C#
11 4 (0.17%) VB
12 3 (0.12%) Progress 4GL
12 3 (0.12%) Ruby
12 3 (0.12%) T-SQL
12 3 (0.12%) VBScript
13 2 (0.083%) Kusto Query Language
13 2 (0.083%) PHP
13 2 (0.083%) PL/SQL
Qualifications
1 590 (24.57%) Degree
2 257 (10.70%) Microsoft Certification
3 162 (6.75%) Security Cleared
4 121 (5.04%) DBS Check
5 90 (3.75%) SC Cleared
6 86 (3.58%) Cisco Certification
7 84 (3.50%) Azure Certification
8 82 (3.42%) A+ Certification
9 77 (3.21%) DV Cleared
10 67 (2.79%) CCNA
11 60 (2.50%) MCSA
12 52 (2.17%) Network+ Certification
13 50 (2.08%) MCSE
14 47 (1.96%) Computer Science Degree
15 37 (1.54%) CCNP
15 37 (1.54%) MCP
16 30 (1.25%) VMware Certified Professional (VCP)
17 29 (1.21%) ITIL Foundation Certificate
18 26 (1.08%) AWS Certification
18 26 (1.08%) ITIL Certification
Quality Assurance & Compliance
1 185 (7.71%) SLA
2 142 (5.91%) ISO/IEC 27001
3 107 (4.46%) NIST
4 61 (2.54%) GDPR
5 41 (1.71%) Cyber Essentials
6 14 (0.58%) Cyber Essentials PLUS
7 9 (0.37%) PCI DSS
8 7 (0.29%) QA
9 6 (0.25%) HIPAA
10 5 (0.21%) ISO 9001
10 5 (0.21%) Software Quality Assurance
11 3 (0.12%) COBIT
11 3 (0.12%) Data Quality
11 3 (0.12%) ISO 14001
11 3 (0.12%) ISO 22301
11 3 (0.12%) NCSC
11 3 (0.12%) Sarbanes-Oxley
12 2 (0.083%) GRC
12 2 (0.083%) ISO/IEC 27002 (supersedes ISO/IEC 17799)
12 2 (0.083%) SOC 2
System Software
1 380 (15.83%) VMware Infrastructure
2 246 (10.25%) Hyper-V
3 91 (3.79%) VMware ESXi
4 78 (3.25%) Virtual Desktop
5 76 (3.17%) Virtual Servers
6 52 (2.17%) Virtual Machines
7 50 (2.08%) vSphere
8 44 (1.83%) Docker
9 31 (1.29%) XenApp
10 27 (1.12%) Terminal Services
11 17 (0.71%) BitLocker
12 9 (0.37%) Firmware
12 9 (0.37%) Microsoft App-V
13 7 (0.29%) DFS Replication
14 5 (0.21%) Microsoft Virtual Server
14 5 (0.21%) VMware NSX
15 4 (0.17%) EMC RecoverPoint
15 4 (0.17%) ISA Server
15 4 (0.17%) VMware Workstation
15 4 (0.17%) XenDesktop
Systems Management
1 468 (19.49%) Microsoft Intune
2 165 (6.87%) SCCM
3 157 (6.54%) Terraform
4 81 (3.37%) Ansible
5 76 (3.17%) Single Sign-On
6 53 (2.21%) Kubernetes
7 50 (2.08%) Active Directory Federation Services
8 36 (1.50%) vCenter Server
9 34 (1.42%) Jamf Pro
10 32 (1.33%) WSUS
11 27 (1.12%) SCOM
12 19 (0.79%) Puppet
13 16 (0.67%) NetBackup
13 16 (0.67%) Prometheus
14 14 (0.58%) AirWatch
14 14 (0.58%) vMotion
15 12 (0.50%) Grafana
15 12 (0.50%) Nagios
16 11 (0.46%) FortiGate
17 9 (0.37%) SmoothWall
Vendors
1 1,584 (65.97%) Microsoft
2 509 (21.20%) VMware
3 298 (12.41%) Cisco
4 223 (9.29%) Sun
5 170 (7.08%) Citrix
6 144 (6.00%) Apple
7 130 (5.41%) Meraki
8 116 (4.83%) Veeam
9 111 (4.62%) ServiceNow
10 87 (3.62%) Thales
11 69 (2.87%) HP
12 65 (2.71%) Google
13 57 (2.37%) Okta
14 54 (2.25%) Dell
15 48 (2.00%) Fortinet
16 38 (1.58%) Sophos
17 35 (1.46%) SonicWALL
18 32 (1.33%) Palo Alto
18 32 (1.33%) SAP
19 31 (1.29%) SolarWinds