Performance Metrics Jobs in England

Performance Metrics
UK > England

The table below provides summary statistics for permanent job vacancies advertised in England requiring Performance Metrics skills. It includes a benchmarking guide to the annual salaries offered in vacancies that cited Performance Metrics over the 6 months leading up to 28 May 2025, comparing them to the same period in the previous two years.

6 months to
28 May 2025
Same period 2024 Same period 2023
Rank 268 403 669
Rank change year-on-year +135 +266 +48
Permanent jobs citing Performance Metrics 577 522 255
As % of all permanent jobs advertised in England 1.19% 0.59% 0.29%
As % of the Processes & Methodologies category 1.27% 0.70% 0.31%
Number of salaries quoted 250 226 98
10th Percentile £38,550 £32,250 £41,250
25th Percentile £45,628 £42,500 £45,000
Median annual salary (50th Percentile) £50,818 £57,500 £54,625
Median % change year-on-year -11.62% +5.26% -15.96%
75th Percentile £70,938 £78,750 £72,500
90th Percentile £95,000 £88,388 £79,125
UK median annual salary £51,159 £55,000 £55,000
% change year-on-year -6.98% - -15.38%

All Process and Methodology Skills
England

Performance Metrics falls under the Processes and Methodologies category. For comparison with the information above, the following table provides summary statistics for all permanent job vacancies requiring process or methodology skills in England.

Permanent vacancies with a requirement for process or methodology skills 45,477 74,482 83,229
As % of all permanent jobs advertised in England 94.01% 84.24% 95.56%
Number of salaries quoted 22,533 54,432 49,691
10th Percentile £29,625 £29,000 £34,375
25th Percentile £41,250 £40,000 £46,105
Median annual salary (50th Percentile) £57,500 £55,000 £62,500
Median % change year-on-year +4.55% -12.00% +4.17%
75th Percentile £75,000 £72,500 £82,500
90th Percentile £98,695 £93,750 £102,500
UK median annual salary £57,500 £55,000 £61,000
% change year-on-year +4.55% -9.84% +1.67%

Performance Metrics
Job Vacancy Trend in England

Job postings citing Performance Metrics as a proportion of all IT jobs advertised in England.
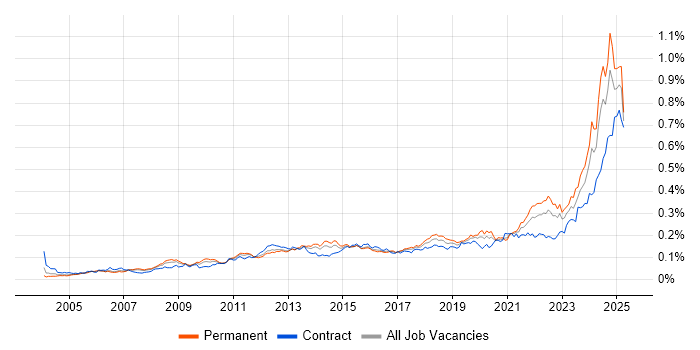
Job vacancy trend for Performance Metrics in England

Performance Metrics
Salary Trend in England

3-month moving average salary quoted in jobs citing Performance Metrics in England.

Salary trend for Performance Metrics in England

Performance Metrics
Salary Histogram in England

Salary distribution for jobs citing Performance Metrics in England over the 6 months to 28 May 2025.

Salary histogram for Performance Metrics in England

Performance Metrics
Job Locations in England

The table below looks at the demand and provides a guide to the median salaries quoted in IT jobs citing Performance Metrics within the England region over the 6 months to 28 May 2025. The 'Rank Change' column provides an indication of the change in demand within each location based on the same 6 month period last year.

Location Rank Change
on Same Period
Last Year
Matching
Permanent
IT Job Ads
Median Salary
Past 6 Months
Median Salary
% Change
on Same Period
Last Year
Live
Jobs
London +161 168 £75,000 -3.23% 545
North of England +84 114 £45,628 +2.72% 369
South East +107 94 £55,000 +29.41% 466
North West +49 94 £45,628 -12.25% 167
East of England +97 72 £47,500 -5.00% 199
Midlands -103 30 £45,000 -10.00% 266
East Midlands +11 19 £42,500 -26.09% 109
Yorkshire +50 15 £30,825 -2.14% 140
West Midlands -78 11 £46,250 -7.50% 140
South West +111 7 - - 140
North East +51 5 £52,500 -34.38% 67
Performance Metrics
UK

Performance Metrics
Co-occurring Skills and Capabilities in England by Category

The follow tables expand on the table above by listing co-occurrences grouped by category. The same employment type, locality and period is covered with up to 20 co-occurrences shown in each of the following categories:

Application Platforms
1 72 (12.48%) SharePoint
2 17 (2.95%) Apache Spark
3 13 (2.25%) CMS
4 7 (1.21%) WordPress
5 6 (1.04%) Confluence
6 3 (0.52%) EPiServer
7 2 (0.35%) Microsoft Exchange
8 1 (0.17%) Apache
Applications
1 39 (6.76%) Microsoft Office
2 24 (4.16%) Microsoft Excel
3 11 (1.91%) Microsoft PowerPoint
4 7 (1.21%) MS Visio
5 4 (0.69%) Microsoft Project
6 3 (0.52%) Chatbot
6 3 (0.52%) Final Cut Pro
7 2 (0.35%) Adobe Premiere
8 1 (0.17%) Adobe Creative Suite
8 1 (0.17%) Camtasia
8 1 (0.17%) Photoshop
Business Applications
1 4 (0.69%) CA PPM
2 3 (0.52%) NetSuite
2 3 (0.52%) Payment Gateway
2 3 (0.52%) Shopify
3 2 (0.35%) Oracle ERP
4 1 (0.17%) Dynamics CRM
4 1 (0.17%) Oracle EBS
Cloud Services
1 248 (42.98%) Azure
2 242 (41.94%) AWS
3 221 (38.30%) AWS Lambda
3 221 (38.30%) GCP
3 221 (38.30%) Serverless
4 50 (8.67%) SaaS
5 25 (4.33%) Microsoft 365
6 18 (3.12%) Google Analytics
7 13 (2.25%) Power Platform
8 10 (1.73%) Entra ID
9 8 (1.39%) Google Ads
9 8 (1.39%) Microsoft Copilot
10 7 (1.21%) Amazon S3
11 6 (1.04%) Amazon EC2
11 6 (1.04%) Smartsheet
12 5 (0.87%) Azure Data Factory
13 3 (0.52%) ChatGPT
13 3 (0.52%) dbt
13 3 (0.52%) Slack
13 3 (0.52%) Stripe
Communications & Networking
1 221 (38.30%) Broadband
2 20 (3.47%) HTTP
3 11 (1.91%) Firewall
4 7 (1.21%) Network Security
5 4 (0.69%) VPN
6 3 (0.52%) DNS
6 3 (0.52%) NAS
6 3 (0.52%) SAN
6 3 (0.52%) SSL
7 2 (0.35%) DHCP
7 2 (0.35%) NetScaler
7 2 (0.35%) TCP/IP
8 1 (0.17%) 3G
8 1 (0.17%) Cisco Firepower
8 1 (0.17%) GPRS
8 1 (0.17%) LTE
8 1 (0.17%) Modbus
8 1 (0.17%) Remote Desktop
8 1 (0.17%) VLAN
8 1 (0.17%) Wireless
Database & Business Intelligence
1 10 (1.73%) Power BI
2 8 (1.39%) Amazon RDS
2 8 (1.39%) Looker
3 7 (1.21%) Data Warehouse
4 5 (0.87%) PostgreSQL
5 4 (0.69%) BigQuery
5 4 (0.69%) MongoDB
5 4 (0.69%) MySQL
5 4 (0.69%) NoSQL
5 4 (0.69%) Relational Database
5 4 (0.69%) SQL Server
5 4 (0.69%) Tableau
6 3 (0.52%) Amazon Redshift
6 3 (0.52%) Mixpanel
6 3 (0.52%) Snowflake Schema
7 2 (0.35%) ClickHouse
7 2 (0.35%) RDBMS
7 2 (0.35%) Redis
7 2 (0.35%) SQL Server Integration Services
8 1 (0.17%) Oracle Reports
Development Applications
1 59 (10.23%) JIRA
2 9 (1.56%) Git
3 7 (1.21%) Jenkins
4 3 (0.52%) Selenium
5 2 (0.35%) Bitbucket
5 2 (0.35%) FitNesse
5 2 (0.35%) GitLab
5 2 (0.35%) Octopus Deploy
5 2 (0.35%) SonarQube
5 2 (0.35%) TeamCity
6 1 (0.17%) Crashlytics
6 1 (0.17%) Xcode
General
1 279 (48.35%) Analytical Skills
2 125 (21.66%) Finance
3 119 (20.62%) Social Skills
4 61 (10.57%) Marketing
5 47 (8.15%) Law
6 34 (5.89%) Manufacturing
7 31 (5.37%) Games
8 25 (4.33%) Retail
9 23 (3.99%) Advertising
9 23 (3.99%) Organisational Skills
10 22 (3.81%) Legal
11 21 (3.64%) Inclusion and Diversity
12 17 (2.95%) Electronics
13 11 (1.91%) Telecoms
14 9 (1.56%) Banking
14 9 (1.56%) Presentation Skills
15 8 (1.39%) Financial Institution
15 8 (1.39%) Pharmaceutical
16 6 (1.04%) Public Sector
17 5 (0.87%) Health Technology
Job Titles
1 297 (51.47%) Senior
2 215 (37.26%) Machine Learning Engineer
3 31 (5.37%) Product Manager
4 28 (4.85%) Analyst
5 25 (4.33%) Project Manager
6 21 (3.64%) Configuration Manager
7 19 (3.29%) Lead
8 17 (2.95%) Developer
8 17 (2.95%) Senior Software Engineer
8 17 (2.95%) Software Engineer
9 14 (2.43%) Architect
9 14 (2.43%) Managed Services Architect
9 14 (2.43%) Solutions Architect
10 13 (2.25%) Business Analyst
10 13 (2.25%) Vendor Manager
11 12 (2.08%) Business Manager
12 11 (1.91%) IT Manager
13 10 (1.73%) E-Commerce Manager
14 9 (1.56%) IT Support
14 9 (1.56%) Service Manager
Libraries, Frameworks & Software Standards
1 16 (2.77%) Kafka
2 10 (1.73%) CSS
2 10 (1.73%) HTML
3 8 (1.39%) RESTful
4 6 (1.04%) React
4 6 (1.04%) WebSockets
5 5 (0.87%) .NET
6 4 (0.69%) FHIR
6 4 (0.69%) XML
7 3 (0.52%) AngularJS
7 3 (0.52%) ASP.NET
8 2 (0.35%) .NET Framework
8 2 (0.35%) ASP.NET MVC
8 2 (0.35%) ASP.NET MVC 4
8 2 (0.35%) Entity Framework
8 2 (0.35%) jQuery
8 2 (0.35%) JSON
8 2 (0.35%) LINQ
8 2 (0.35%) NHibernate
8 2 (0.35%) REST
Miscellaneous
1 239 (41.42%) Self-Motivation
2 31 (5.37%) Social Media
3 28 (4.85%) Product Ownership
4 23 (3.99%) PMI
5 18 (3.12%) FMCG
6 16 (2.77%) Distributed Systems
7 13 (2.25%) Team-Oriented Environment
8 10 (1.73%) Onboarding
9 8 (1.39%) Analytical Mindset
10 7 (1.21%) Management Information System
11 5 (0.87%) Clustering
11 5 (0.87%) Cyber Defence
11 5 (0.87%) Microsoft Licensing
11 5 (0.87%) Mobile App
12 4 (0.69%) CMDB
12 4 (0.69%) Cyber Threat
12 4 (0.69%) Operational Technology
12 4 (0.69%) Security Operations Centre
13 3 (0.52%) Video Editing
13 3 (0.52%) Virtual Team
Operating Systems
1 36 (6.24%) Windows
2 13 (2.25%) Windows Vista
3 5 (0.87%) Windows Server
4 4 (0.69%) Linux
5 3 (0.52%) Android
5 3 (0.52%) Apple iOS
6 2 (0.35%) Mac OS
6 2 (0.35%) Windows 10
7 1 (0.17%) Unix
Processes & Methodologies
1 299 (51.82%) Agile
2 279 (48.35%) Problem-Solving
3 262 (45.41%) Mentoring
4 233 (40.38%) Machine Learning
5 227 (39.34%) Data Science
6 224 (38.82%) CI/CD
7 217 (37.61%) Creative Thinking
8 215 (37.26%) Clean Code
8 215 (37.26%) Personalization
9 111 (19.24%) Continuous Improvement
10 63 (10.92%) Analytics
11 58 (10.05%) Decision-Making
12 55 (9.53%) Roadmaps
13 54 (9.36%) Coaching
14 53 (9.19%) Project Management
15 51 (8.84%) Business Strategy
16 48 (8.32%) Service Delivery
17 47 (8.15%) Product Management
18 45 (7.80%) ITIL
19 44 (7.63%) Customer Service
Programming Languages
1 245 (42.46%) Python
2 221 (38.30%) TypeScript
3 24 (4.16%) SQL
4 17 (2.95%) Scala
5 8 (1.39%) JavaScript
6 7 (1.21%) MATLAB
7 4 (0.69%) T-SQL
8 3 (0.52%) C#
9 2 (0.35%) Java
9 2 (0.35%) PowerShell
10 1 (0.17%) Bash
10 1 (0.17%) Bicep
10 1 (0.17%) C
10 1 (0.17%) Kotlin
10 1 (0.17%) PHP
10 1 (0.17%) PL/SQL
10 1 (0.17%) R
10 1 (0.17%) Shell Script
10 1 (0.17%) Swift
10 1 (0.17%) VBA
Qualifications
1 346 (59.97%) Degree
2 215 (37.26%) PhD
3 63 (10.92%) BPSS Clearance
4 42 (7.28%) Master's Degree
5 28 (4.85%) PMI Certification
6 15 (2.60%) DBS Check
7 12 (2.08%) CISSP
8 9 (1.56%) CISM
8 9 (1.56%) Microsoft Certification
9 8 (1.39%) AWS Certification
9 8 (1.39%) Security Cleared
10 7 (1.21%) AWS Certified Cloud Practitioner
10 7 (1.21%) MBA
11 6 (1.04%) SC Cleared
12 5 (0.87%) Azure Certification
12 5 (0.87%) CBAP
12 5 (0.87%) GIAC
12 5 (0.87%) ITIL Certification
12 5 (0.87%) PMP
13 4 (0.69%) GCIH
Quality Assurance & Compliance
1 19 (3.29%) SLA
2 12 (2.08%) QA
3 11 (1.91%) ISO/IEC 27001
4 7 (1.21%) GDPR
4 7 (1.21%) NIST
4 7 (1.21%) PMO
5 6 (1.04%) Data Quality
6 4 (0.69%) 21 CFR Part 11
6 4 (0.69%) Good Clinical Practice
6 4 (0.69%) P3O
7 3 (0.52%) Actionable Recommendations
7 3 (0.52%) PCI DSS
8 2 (0.35%) Accessibility
9 1 (0.17%) GRC
9 1 (0.17%) MiFID
System Software
1 10 (1.73%) Active Directory
2 7 (1.21%) Docker
3 4 (0.69%) VMware Infrastructure
4 2 (0.35%) Firmware
4 2 (0.35%) Virtual Desktop
4 2 (0.35%) Virtual Machines
4 2 (0.35%) VMware ESXi
5 1 (0.17%) XenApp
5 1 (0.17%) XenDesktop
Systems Management
1 9 (1.56%) Kubernetes
2 2 (0.35%) Control-M
2 2 (0.35%) EnCase
2 2 (0.35%) FTK
2 2 (0.35%) Graylog
2 2 (0.35%) Microsoft Intune
2 2 (0.35%) RSA Security Analytics
2 2 (0.35%) SCCM
2 2 (0.35%) Terraform
3 1 (0.17%) Ansible
3 1 (0.17%) FortiGate
3 1 (0.17%) NetBackup
3 1 (0.17%) Oracle RMAN
3 1 (0.17%) Progress Chef
3 1 (0.17%) Puppet
3 1 (0.17%) ZABBIX
Vendors
1 132 (22.88%) Microsoft
2 40 (6.93%) Google
3 28 (4.85%) SAP
4 16 (2.77%) Apple
5 12 (2.08%) YouTube
6 11 (1.91%) Commvault
7 7 (1.21%) ServiceNow
8 6 (1.04%) Cisco
8 6 (1.04%) HubSpot
8 6 (1.04%) Salesforce
8 6 (1.04%) VMware
9 5 (0.87%) Adobe
10 4 (0.69%) Ahrefs
10 4 (0.69%) Oracle
10 4 (0.69%) Pegasus
10 4 (0.69%) Planview
10 4 (0.69%) Splunk
11 3 (0.52%) Amplitude
11 3 (0.52%) Instagram
11 3 (0.52%) PayPal