Systems Engineer Jobs

System Engineer
UK

The median System Engineer salary in the UK is £50,055 per year, according to job vacancies posted during the 6 months leading to 3 June 2025.

The table below provides salary benchmarking and summary statistics, comparing them to the same period in the previous two years.

6 months to
3 Jun 2025
Same period 2024 Same period 2023
Rank 22 95 304
Rank change year-on-year +73 +209 +130
Permanent jobs requiring a Systems Engineer 4,352 2,823 1,129
As % of all permanent jobs advertised in the UK 7.82% 2.68% 1.19%
As % of the Job Titles category 8.66% 2.83% 1.30%
Number of salaries quoted 2,536 1,803 449
10th Percentile £45,375 £33,000 £32,500
25th Percentile £47,683 £40,000 £40,000
Median annual salary (50th Percentile) £50,055 £50,000 £50,000
Median % change year-on-year +0.11% - -
75th Percentile £60,265 £60,000 £67,500
90th Percentile £70,000 £70,000 £85,000
UK excluding London median annual salary £50,055 £50,000 £45,000
% change year-on-year +0.11% +11.11% -

All Permanent IT Job Vacancies
UK

For comparison with the information above, the following table provides summary statistics for all permanent IT job vacancies. Most job vacancies include a discernible job title that can be normalized. As such, the figures in the second row provide an indication of the number of permanent jobs in our overall sample.

Permanent vacancies in the UK with a recognized job title 50,265 99,846 86,547
% of permanent jobs with a recognized job title 90.36% 94.87% 91.30%
Number of salaries quoted 26,239 70,998 55,960
10th Percentile £28,500 £28,500 £32,500
25th Percentile £40,000 £38,500 £45,000
Median annual salary (50th Percentile) £55,000 £52,500 £60,000
Median % change year-on-year +4.76% -12.50% -
75th Percentile £73,750 £70,000 £80,000
90th Percentile £95,000 £90,000 £100,000
UK excluding London median annual salary £50,967 £50,000 £53,500
% change year-on-year +1.93% -6.54% +6.49%

Systems Engineer
Job Vacancy Trend

Job postings that featured Systems Engineer in the job title as a proportion of all IT jobs advertised.
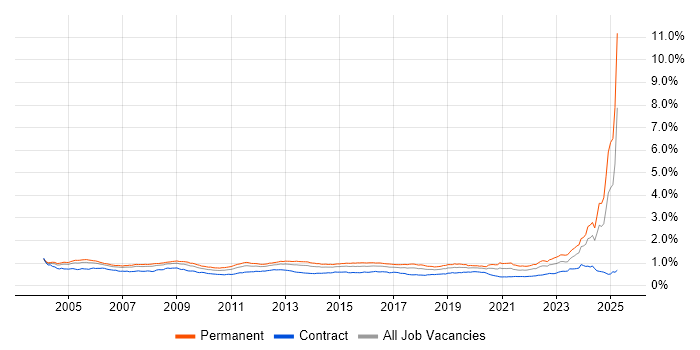
Job vacancy trend for Systems Engineer in the UK

Systems Engineer
Salary Trend

3-month moving average salary quoted in jobs citing Systems Engineer.

Salary trend for Systems Engineer in the UK

Systems Engineer
Salary Histogram

Salary distribution for jobs citing Systems Engineer over the 6 months to 3 June 2025.

Salary histogram for Systems Engineer in the UK

Systems Engineer
Top 17 Job Locations

The table below looks at the demand and provides a guide to the median salaries quoted in IT jobs citing Systems Engineer within the UK over the 6 months to 3 June 2025. The 'Rank Change' column provides an indication of the change in demand within each location based on the same 6 month period last year.

Location Rank Change
on Same Period
Last Year
Matching
Permanent
IT Job Ads
Median Salary
Past 6 Months
Median Salary
% Change
on Same Period
Last Year
Live
Jobs
UK excluding London +65 4,085 £50,055 +0.11% 695
England +63 3,673 £50,055 +0.11% 851
North of England +134 1,438 £50,055 +11.23% 139
North West +121 1,250 £50,055 +0.11% 89
Work from Home +181 1,140 £47,683 -4.63% 441
South East +36 875 £62,000 +24.00% 185
Midlands +49 640 £47,683 -2.69% 122
Scotland +154 462 £58,033 +10.54% 35
South West +22 401 £52,600 -4.36% 120
West Midlands +51 354 £46,250 -7.50% 81
East Midlands +39 285 £47,683 +12.20% 41
Yorkshire +111 176 £47,683 +8.99% 40
East of England -27 151 £47,683 -9.18% 91
Wales +54 114 £62,000 +77.14% 11
London -27 104 £65,000 +18.18% 185
North East +40 12 £55,000 +29.41% 13
Northern Ireland +39 4 - - 9

Systems Engineer Skill Set
Top 30 Co-occurring Skills and Capabilities

For the 6 months to 3 June 2025, Systems Engineer job roles required the following skills and capabilities in order of popularity. The figures indicate the absolute number co-occurrences and as a proportion of all permanent job ads featuring Systems Engineer in the job title.

1 3,380 (77.67%) Systems Engineering
2 3,044 (69.94%) Degree
3 2,729 (62.71%) BPSS Clearance
4 1,559 (35.82%) MATLAB
5 1,440 (33.09%) SysML
6 1,150 (26.42%) Model-Based Systems Engineering
7 1,053 (24.20%) Mathematics
8 929 (21.35%) HND
9 918 (21.09%) HNC
10 865 (19.88%) Agile
11 834 (19.16%) Aerospace
12 791 (18.18%) Simulink
13 778 (17.88%) Validation
14 766 (17.60%) Social Skills
15 764 (17.56%) UML
16 729 (16.75%) Rational DOORS
17 622 (14.29%) Electronics
18 621 (14.27%) MODAF
19 596 (13.69%) Physics
20 578 (13.28%) Cybersecurity
21 576 (13.24%) IBM
22 558 (12.82%) Presentation Skills
23 551 (12.66%) Verification and Validation
24 535 (12.29%) Automotive
25 521 (11.97%) Software Engineering
26 476 (10.94%) Digital Twin
27 466 (10.71%) Technical Leadership
28 447 (10.27%) Signal Processing
29 443 (10.18%) Coaching
30 431 (9.90%) Teamcenter

Systems Engineer Skill Set
Co-occurring Skills and Capabilities by Category

The follow tables expand on the table above by listing co-occurrences grouped by category. The same employment type, locality and period is covered with up to 20 co-occurrences shown in each of the following categories:

Application Platforms
1 19 (0.44%) Confluence
1 19 (0.44%) Microsoft Exchange
1 19 (0.44%) WinCC
2 13 (0.30%) SharePoint
3 4 (0.092%) Apache
3 4 (0.092%) Apache Airflow
4 3 (0.069%) nginx
4 3 (0.069%) OpenStack
5 2 (0.046%) SAS
6 1 (0.023%) FactoryTalk
Applications
1 791 (18.18%) Simulink
2 302 (6.94%) Microsoft Office
3 190 (4.37%) Microsoft Excel
4 178 (4.09%) Microsoft PowerPoint
5 12 (0.28%) EPLAN
6 7 (0.16%) AutoCAD
7 5 (0.11%) Blender
8 3 (0.069%) CATIA
8 3 (0.069%) Chatbot
8 3 (0.069%) MicroStation
9 2 (0.046%) GNU Octave
9 2 (0.046%) MS Visio
10 1 (0.023%) Siemens NX
10 1 (0.023%) SOLIDWORKS
Business Applications
1 431 (9.90%) Teamcenter
2 87 (2.00%) Sparx Enterprise Architect
3 7 (0.16%) Q-Pulse
4 1 (0.023%) C-CURE
Cloud Services
1 51 (1.17%) Azure
2 46 (1.06%) Microsoft 365
3 38 (0.87%) AWS
4 15 (0.34%) Microsoft Purview
5 13 (0.30%) Cloud Computing
6 11 (0.25%) Entra ID
6 11 (0.25%) Google Workspace
6 11 (0.25%) SaaS
7 8 (0.18%) Microsoft Copilot
7 8 (0.18%) OneDrive
8 7 (0.16%) GitHub
9 6 (0.14%) Azure Storage
10 5 (0.11%) Serverless
11 4 (0.092%) CloudBees
11 4 (0.092%) GCP
12 3 (0.069%) Copilot Studio
13 2 (0.046%) IaaS
13 2 (0.046%) Nutanix
13 2 (0.046%) PaaS
14 1 (0.023%) Google App Engine
Communications & Networking
1 151 (3.47%) Broadband
2 29 (0.67%) DNS
3 27 (0.62%) DHCP
3 27 (0.62%) Ethernet
4 25 (0.57%) Profibus
5 24 (0.55%) Software-Defined Radio
6 23 (0.53%) Wireshark
7 22 (0.51%) Modbus
7 22 (0.51%) TCP/IP
8 18 (0.41%) Firewall
9 14 (0.32%) VLAN
10 13 (0.30%) WLAN
11 12 (0.28%) RS-485
12 11 (0.25%) BGP
12 11 (0.25%) OSPF
12 11 (0.25%) WAN
12 11 (0.25%) Wireless
13 9 (0.21%) SD-WAN
14 8 (0.18%) SAN
15 6 (0.14%) VoIP
Database & Business Intelligence
1 20 (0.46%) MySQL
2 16 (0.37%) Relational Database
3 9 (0.21%) SQL Server
4 7 (0.16%) MongoDB
5 5 (0.11%) QGIS
6 4 (0.092%) Amazon QuickSight
7 2 (0.046%) Geospatial Data
7 2 (0.046%) GIS
8 1 (0.023%) Amazon RDS
8 1 (0.023%) Azure SQL Database
Development Applications
1 729 (16.75%) Rational DOORS
2 28 (0.64%) Git
3 22 (0.51%) JIRA
4 16 (0.37%) Bitbucket
5 8 (0.18%) ClearCase
6 5 (0.11%) Jenkins
7 2 (0.046%) LabVIEW
8 1 (0.023%) ClearQuest
8 1 (0.023%) Eclipse
8 1 (0.023%) Maven
8 1 (0.023%) Rational Rhapsody
8 1 (0.023%) Sonatype Nexus
General
1 834 (19.16%) Aerospace
2 766 (17.60%) Social Skills
3 622 (14.29%) Electronics
4 558 (12.82%) Presentation Skills
5 535 (12.29%) Automotive
6 225 (5.17%) Avionics
7 154 (3.54%) Aeronautics
7 154 (3.54%) Telecoms
8 95 (2.18%) Finance
9 82 (1.88%) Manufacturing
10 64 (1.47%) Influencing Skills
11 50 (1.15%) Law
12 46 (1.06%) Analytical Skills
13 32 (0.74%) Military
14 31 (0.71%) Aviation
15 28 (0.64%) Retail
16 26 (0.60%) Inclusion and Diversity
17 17 (0.39%) Legal
18 15 (0.34%) Organisational Skills
19 12 (0.28%) Public Sector
Libraries, Frameworks & Software Standards
1 18 (0.41%) .NET
2 14 (0.32%) XML
3 8 (0.18%) Flash
4 7 (0.16%) Kafka
4 7 (0.16%) XSD
5 4 (0.092%) CSS
5 4 (0.092%) HTML
5 4 (0.092%) JSON
6 3 (0.069%) Node.js
6 3 (0.069%) OpenCL
6 3 (0.069%) YAML
7 2 (0.046%) Middleware
7 2 (0.046%) REST
8 1 (0.023%) 802.1X
8 1 (0.023%) Django
8 1 (0.023%) LDAP
8 1 (0.023%) Node-RED
8 1 (0.023%) Web Services
Miscellaneous
1 429 (9.86%) Algorithms
2 95 (2.18%) Management Information System
3 69 (1.59%) Product Ownership
4 52 (1.19%) SCADA
5 50 (1.15%) Operational Technology
6 48 (1.10%) FMCG
6 48 (1.10%) Manufacturing Execution System
7 33 (0.76%) e-Learning
8 25 (0.57%) FPGA
9 24 (0.55%) Data Centre
10 19 (0.44%) Self-Motivation
11 11 (0.25%) Renewable Energy
11 11 (0.25%) Smartphone
12 10 (0.23%) CCTV
13 9 (0.21%) NHS
14 8 (0.18%) Embedded Systems
15 7 (0.16%) Driving Licence
15 7 (0.16%) Reference Data
16 5 (0.11%) Cloud Native
16 5 (0.11%) Linux Command Line
Operating Systems
1 104 (2.39%) Windows
2 101 (2.32%) Linux
3 34 (0.78%) Windows Server
4 17 (0.39%) Windows Server 2019
5 16 (0.37%) Ubuntu
5 16 (0.37%) Windows 10
6 11 (0.25%) Mac OS X
6 11 (0.25%) Windows Server 2016
7 8 (0.18%) VMS
8 6 (0.14%) Red Hat Enterprise Linux
9 5 (0.11%) Debian
10 2 (0.046%) CentOS
10 2 (0.046%) Windows Server 2012
11 1 (0.023%) Apple iOS
11 1 (0.023%) Mac OS
11 1 (0.023%) Unix
11 1 (0.023%) Windows Server 2008
Processes & Methodologies
1 3,380 (77.67%) Systems Engineering
2 1,440 (33.09%) SysML
3 1,150 (26.42%) Model-Based Systems Engineering
4 1,053 (24.20%) Mathematics
5 865 (19.88%) Agile
6 778 (17.88%) Validation
7 764 (17.56%) UML
8 621 (14.27%) MODAF
9 596 (13.69%) Physics
10 578 (13.28%) Cybersecurity
11 551 (12.66%) Verification and Validation
12 521 (11.97%) Software Engineering
13 476 (10.94%) Digital Twin
14 466 (10.71%) Technical Leadership
15 447 (10.27%) Signal Processing
16 443 (10.18%) Coaching
17 426 (9.79%) Problem-Solving
18 419 (9.63%) Requirements Management
19 393 (9.03%) Mentoring
20 359 (8.25%) PLM
Programming Languages
1 1,559 (35.82%) MATLAB
2 123 (2.83%) R
3 48 (1.10%) PowerShell
4 39 (0.90%) Python
5 35 (0.80%) SQL
6 32 (0.74%) C
7 24 (0.55%) C#
8 18 (0.41%) C++
9 17 (0.39%) Java
10 10 (0.23%) Bash
10 10 (0.23%) Ladder Logic
11 7 (0.16%) PL/SQL
12 4 (0.092%) JavaScript
13 3 (0.069%) TypeScript
13 3 (0.069%) VB
14 2 (0.046%) Embedded C
14 2 (0.046%) Go
14 2 (0.046%) Perl
14 2 (0.046%) Rust
14 2 (0.046%) Shell Script
Qualifications
1 3,044 (69.94%) Degree
2 2,729 (62.71%) BPSS Clearance
3 929 (21.35%) HND
4 918 (21.09%) HNC
5 175 (4.02%) Computer Science Degree
6 172 (3.95%) Chartered Engineer
7 95 (2.18%) Security Cleared
8 77 (1.77%) SC Cleared
9 66 (1.52%) TOGAF Certification
10 21 (0.48%) Microsoft Certification
11 17 (0.39%) Master's Degree
12 14 (0.32%) NVQ Level 3
13 13 (0.30%) MCSE
14 10 (0.23%) DBS Check
15 8 (0.18%) DV Cleared
16 6 (0.14%) Azure Certification
17 4 (0.092%) Numerate Degree
18 3 (0.069%) MCSA
18 3 (0.069%) PhD
19 2 (0.046%) ITIL Certification
Quality Assurance & Compliance
1 425 (9.77%) ISO/IEC 15288
2 147 (3.38%) ARP4754
2 147 (3.38%) DO-254
2 147 (3.38%) IEC 61508
3 29 (0.67%) ISO 9001
4 14 (0.32%) Def Stans
5 10 (0.23%) Accessibility
5 10 (0.23%) QA
6 9 (0.21%) GDPR
7 8 (0.18%) SLA
8 7 (0.16%) Data Quality
9 6 (0.14%) IEC 61131
10 3 (0.069%) WCAG
11 2 (0.046%) Automotive SPICE
11 2 (0.046%) HL7
11 2 (0.046%) Sarbanes-Oxley
12 1 (0.023%) MIL-STD-1553
12 1 (0.023%) NIST
12 1 (0.023%) NIST 800
12 1 (0.023%) PMO
System Software
1 40 (0.92%) Active Directory
2 28 (0.64%) Firmware
3 23 (0.53%) Embedded Firmware
4 19 (0.44%) VMware Infrastructure
5 17 (0.39%) Virtual Machines
6 14 (0.32%) Docker
7 12 (0.28%) Hyper-V
8 3 (0.069%) VMware ESXi
9 2 (0.046%) Virtual Servers
10 1 (0.023%) Dovecot
10 1 (0.023%) Postfix
Systems Management
1 23 (0.53%) Ansible
2 21 (0.48%) Microsoft Intune
3 11 (0.25%) Kubernetes
3 11 (0.25%) Wonderware InTouch
4 7 (0.16%) SCCM
4 7 (0.16%) Terraform
5 6 (0.14%) SCOM
6 5 (0.11%) WSUS
7 4 (0.092%) Functional Safety
7 4 (0.092%) SCOrch
8 2 (0.046%) Jamf Pro
8 2 (0.046%) Microsoft Clustering
8 2 (0.046%) Puppet
8 2 (0.046%) Single Sign-On
8 2 (0.046%) SmoothWall
9 1 (0.023%) Active Directory Federation Services
9 1 (0.023%) Nessus
9 1 (0.023%) NetBackup
Vendors
1 576 (13.24%) IBM
2 295 (6.78%) Microsoft
3 211 (4.85%) ANSYS
4 105 (2.41%) Siemens
5 87 (2.00%) Sparx
6 71 (1.63%) Rockwell
7 51 (1.17%) MathWorks
8 42 (0.97%) VMware
9 25 (0.57%) Allen-Bradley
10 23 (0.53%) Cisco
10 23 (0.53%) Google
11 16 (0.37%) Atlassian
11 16 (0.37%) Dell
11 16 (0.37%) Wonderware
12 11 (0.25%) Apple
12 11 (0.25%) Fortinet
12 11 (0.25%) Ubiquiti
13 9 (0.21%) EMC
14 8 (0.18%) Oracle
15 7 (0.16%) Veeam