TDD Jobs with Work from Home Options

Test-Driven Development (TDD)
UK > Work from Home

The table below provides summary statistics for permanent job vacancies with an option to work from home (WFH) and a requirement for TDD skills. Included is a benchmarking guide to the salaries offered in vacancies that have cited TDD over the 6 months to 24 April 2024 with a comparison to the same period in the previous 2 years.

6 months to
24 Apr 2024
Same period 2023 Same period 2022
Rank 81 67 45
Rank change year-on-year -14 -22 -10
Permanent jobs citing TDD 1,267 1,981 4,787
As % of all permanent jobs with a WFH option 3.75% 4.54% 7.19%
As % of the Processes & Methodologies category 4.09% 4.72% 7.42%
Number of salaries quoted 1,143 1,578 2,478
10th Percentile £40,000 £47,500 £42,500
25th Percentile £47,500 £55,000 £51,625
Median annual salary (50th Percentile) £60,000 £70,000 £65,000
Median % change year-on-year -14.29% +7.69% +8.33%
75th Percentile £72,500 £85,000 £82,500
90th Percentile £89,500 £100,000 £95,000
UK median annual salary £60,000 £70,000 £67,350
% change year-on-year -14.29% +3.93% +12.25%

All Process and Methodology Skills
Work from Home

TDD is in the Processes and Methodologies category. The following table is for comparison with the above and provides summary statistics for all permanent job vacancies with a WFH option and a requirement for process or methodology skills.

Permanent vacancies with a requirement for process or methodology skills 31,001 41,929 64,513
As % of all permanent jobs with a WFH option 91.73% 96.07% 96.89%
Number of salaries quoted 23,603 28,952 41,201
10th Percentile £33,750 £37,500 £36,250
25th Percentile £42,500 £47,500 £45,000
Median annual salary (50th Percentile) £57,500 £62,500 £60,000
Median % change year-on-year -8.00% +4.17% +9.09%
75th Percentile £75,000 £82,500 £80,000
90th Percentile £95,000 £100,000 £95,000
UK median annual salary £55,000 £62,000 £60,000
% change year-on-year -11.29% +3.33% +9.09%

TDD
Trend for Jobs with a WFH Option

Job vacancies with a work from home option citing TDD as a proportion of all IT jobs advertised.
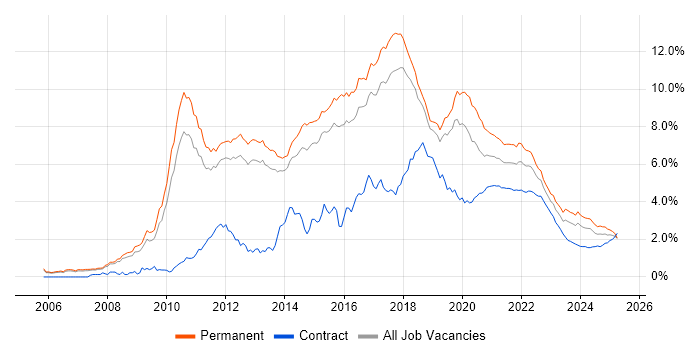
TDD trend for jobs with a WFH option

TDD
Salary Trend for Jobs with a WFH Option

3-month moving average salary quoted in job vacancies with a work from home option citing TDD.

TDD salary trend for jobs with a WFH option

TDD
Salary Histogram for Jobs with a WFH Option

Salary distribution for jobs with a work from home option citing TDD over the 6 months to 24 April 2024.

TDD salary histogram for jobs with a WFH option

TDD
Co-occurring Skills and Capabilities with WFH Options by Category

The follow tables expand on the table above by listing co-occurrences grouped by category. The same employment type, locality and period is covered with up to 20 co-occurrences shown in each of the following categories:

Application Platforms
1 28 (2.21%) OpenStack
2 14 (1.10%) Apache Airflow
3 12 (0.95%) Apache
4 10 (0.79%) JBoss
4 10 (0.79%) NServiceBus
4 10 (0.79%) Red Hat Fuse
5 9 (0.71%) Apache Spark
5 9 (0.71%) IIS
6 8 (0.63%) CMS
6 8 (0.63%) Microsoft Exchange
7 6 (0.47%) DNN
7 6 (0.47%) EPiServer
7 6 (0.47%) Immediacy CMS
7 6 (0.47%) Kentico
7 6 (0.47%) Sitecore CMS
7 6 (0.47%) Sitefinity
7 6 (0.47%) Umbraco
8 4 (0.32%) Adobe Experience Manager
8 4 (0.32%) SharePoint
8 4 (0.32%) WordPress
Applications
1 3 (0.24%) Adobe XD
1 3 (0.24%) Simulink
2 2 (0.16%) Microsoft Project
3 1 (0.079%) Mathematica
3 1 (0.079%) Microsoft Office
Business Applications
1 12 (0.95%) Payment Gateway
2 3 (0.24%) Dynamics CRM
3 2 (0.16%) Shopify
Cloud Services
1 697 (55.01%) Azure
2 583 (46.01%) AWS
3 108 (8.52%) Serverless
4 94 (7.42%) SaaS
5 86 (6.79%) GCP
6 78 (6.16%) Azure DevOps
7 45 (3.55%) AWS Lambda
8 37 (2.92%) Amazon ECS
9 34 (2.68%) Amazon EKS
10 28 (2.21%) GitHub
11 22 (1.74%) dbt
12 17 (1.34%) Azure Service Bus
13 15 (1.18%) Cloud Computing
14 10 (0.79%) AWS CloudFormation
15 9 (0.71%) Amazon CloudWatch
15 9 (0.71%) Azure Functions
15 9 (0.71%) GitHub Actions
16 8 (0.63%) PaaS
17 7 (0.55%) Azure Data Factory
18 6 (0.47%) Azure Machine Learning
Communications & Networking
1 64 (5.05%) Internet
2 19 (1.50%) Broadband
3 16 (1.26%) Hyperconnected
4 15 (1.18%) DNS
4 15 (1.18%) Firewall
5 13 (1.03%) Mobile Broadband
6 9 (0.71%) RS-232
6 9 (0.71%) RS-485
7 8 (0.63%) Bluetooth
8 7 (0.55%) Ethernet
9 5 (0.39%) TCP/IP
9 5 (0.39%) VoIP
9 5 (0.39%) Wi-Fi
9 5 (0.39%) Wireless
9 5 (0.39%) ZigBee
10 4 (0.32%) Modbus
10 4 (0.32%) RS-422
11 2 (0.16%) HTTP
Database & Business Intelligence
1 461 (36.39%) SQL Server
2 259 (20.44%) MongoDB
3 245 (19.34%) Elasticsearch
4 164 (12.94%) Azure SQL Database
5 102 (8.05%) NoSQL
6 99 (7.81%) PostgreSQL
7 69 (5.45%) MySQL
8 65 (5.13%) Relational Database
9 34 (2.68%) DynamoDB
10 27 (2.13%) Amazon RDS
11 16 (1.26%) Big Data
12 15 (1.18%) BigQuery
12 15 (1.18%) CouchDB
13 14 (1.10%) Data Warehouse
14 9 (0.71%) Amazon Athena
14 9 (0.71%) Apache Arrow
14 9 (0.71%) Data Lake
14 9 (0.71%) Dremio
14 9 (0.71%) GIS
15 8 (0.63%) Flink
Development Applications
1 220 (17.36%) Git
2 91 (7.18%) Jenkins
3 43 (3.39%) Visual Studio
4 39 (3.08%) GitLab
5 25 (1.97%) JUnit
6 22 (1.74%) NUnit
7 19 (1.50%) JIRA
8 17 (1.34%) Gradle
8 17 (1.34%) Maven
8 17 (1.34%) Selenium
9 16 (1.26%) Cypress.io
10 14 (1.10%) Postman
11 10 (0.79%) Cucumber
12 9 (0.71%) Mockito
13 8 (0.63%) Jasmine
13 8 (0.63%) SonarQube
14 7 (0.55%) LabVIEW
15 6 (0.47%) Oracle Forms
15 6 (0.47%) webpack
16 5 (0.39%) Octopus Deploy
General
1 226 (17.84%) Finance
2 204 (16.10%) Social Skills
3 74 (5.84%) Banking
3 74 (5.84%) Public Sector
4 56 (4.42%) Retail
5 48 (3.79%) Advertising
6 44 (3.47%) Marketing
7 39 (3.08%) Games
7 39 (3.08%) Inclusion and Diversity
8 37 (2.92%) Analytical Skills
9 15 (1.18%) Telecoms
10 13 (1.03%) French Language
10 13 (1.03%) Front Office
10 13 (1.03%) Tech for Good
11 11 (0.87%) Automotive
12 10 (0.79%) Presentation Skills
12 10 (0.79%) Retail Banking
13 6 (0.47%) Electronics
13 6 (0.47%) Manufacturing
14 5 (0.39%) Aerospace
Job Titles
1 846 (66.77%) Developer
2 469 (37.02%) .NET Developer
3 308 (24.31%) Senior
4 194 (15.31%) Software Engineer
5 176 (13.89%) Senior Developer
6 154 (12.15%) C# Developer
7 138 (10.89%) C# .NET Developer
8 95 (7.50%) Lead
9 92 (7.26%) Java Developer
10 86 (6.79%) Senior Software Engineer
11 79 (6.24%) Full Stack Developer
12 70 (5.52%) PHP Developer
13 64 (5.05%) Java Engineer
14 59 (4.66%) Software Developer
15 53 (4.18%) Java Software Engineer
16 47 (3.71%) Architect
17 45 (3.55%) Senior Java Engineer
18 37 (2.92%) Internet Developer
19 35 (2.76%) Senior Java Software Engineer
20 34 (2.68%) Lead Developer
Libraries, Frameworks & Software Standards
1 610 (48.15%) .NET
2 435 (34.33%) .NET Core
3 433 (34.18%) ASP.NET
4 392 (30.94%) React
5 388 (30.62%) Entity Framework
6 376 (29.68%) ASP.NET MVC
7 351 (27.70%) Node.js
8 324 (25.57%) AngularJS
9 283 (22.34%) Vue
10 264 (20.84%) .NET Framework
10 264 (20.84%) CSS
11 260 (20.52%) HTML
12 239 (18.86%) ASP.NET Web API
13 167 (13.18%) CSS3
14 166 (13.10%) Blazor
14 166 (13.10%) HTML5
15 146 (11.52%) RESTful
16 138 (10.89%) REST
17 135 (10.66%) Spring
18 131 (10.34%) Web Services
Miscellaneous
1 140 (11.05%) Greenfield Project
2 79 (6.24%) Product Ownership
3 49 (3.87%) Cloud Native
4 35 (2.76%) Client/Server
4 35 (2.76%) PropTech
5 33 (2.60%) Onboarding
6 28 (2.21%) Distributed Systems
7 25 (1.97%) Digital TV
8 21 (1.66%) Video\Live Streaming
8 21 (1.66%) Virtual Team
9 17 (1.34%) Algorithms
9 17 (1.34%) Data Structures
10 12 (0.95%) Derivative
10 12 (0.95%) Enterprise Software
11 11 (0.87%) Equities
11 11 (0.87%) Public Cloud
12 10 (0.79%) Fixed Income
12 10 (0.79%) IoT
12 10 (0.79%) Legacy Systems
12 10 (0.79%) Tandem
Operating Systems
1 56 (4.42%) Linux
2 26 (2.05%) Apple iOS
3 23 (1.82%) Android
4 22 (1.74%) Windows
5 10 (0.79%) Unix
5 10 (0.79%) Windows Server 2019
6 9 (0.71%) Mac OS
7 5 (0.39%) FreeRTOS
7 5 (0.39%) ThreadX
8 4 (0.32%) Embedded Linux
9 1 (0.079%) CentOS
9 1 (0.079%) FreeBSD
9 1 (0.079%) Mac OS X
9 1 (0.079%) Solaris
9 1 (0.079%) Windows Server 2012
Processes & Methodologies
1 984 (77.66%) Agile
2 608 (47.99%) BDD
3 548 (43.25%) Full Stack Development
4 501 (39.54%) Microservices
5 432 (34.10%) MVC
6 401 (31.65%) Scrum
7 353 (27.86%) Software Engineering
8 325 (25.65%) Kanban
9 292 (23.05%) CI/CD
10 277 (21.86%) DevOps
11 186 (14.68%) Continuous Integration
12 169 (13.34%) Test Automation
13 154 (12.15%) Problem-Solving
14 150 (11.84%) Mentoring
15 131 (10.34%) Unit Testing
16 113 (8.92%) OOP
17 105 (8.29%) Design Patterns
18 100 (7.89%) SOLID
19 91 (7.18%) Coaching
20 82 (6.47%) Software Testing
Programming Languages
1 644 (50.83%) C#
2 633 (49.96%) JavaScript
3 380 (29.99%) SQL
4 343 (27.07%) TypeScript
5 286 (22.57%) Java
6 179 (14.13%) Python
7 97 (7.66%) PHP
8 70 (5.52%) Go
9 24 (1.89%) C
10 22 (1.74%) T-SQL
11 17 (1.34%) Ada
11 17 (1.34%) Scala
12 14 (1.10%) C++
13 11 (0.87%) Kotlin
14 9 (0.71%) Embedded C
14 9 (0.71%) Swift
15 8 (0.63%) Ruby
16 6 (0.47%) Dart
17 5 (0.39%) Bash
18 4 (0.32%) R
Qualifications
1 102 (8.05%) Security Cleared
2 75 (5.92%) SC Cleared
3 70 (5.52%) Degree
4 41 (3.24%) DBS Check
5 38 (3.00%) BPSS Clearance
6 26 (2.05%) Computer Science Degree
7 23 (1.82%) Azure Certification
8 16 (1.26%) AWS Certification
9 4 (0.32%) CIPD
10 3 (0.24%) PMI Certification
11 2 (0.16%) CISSP
11 2 (0.16%) Master's Degree
11 2 (0.16%) PMP
12 1 (0.079%) DV Cleared
12 1 (0.079%) ISEB
12 1 (0.079%) ISTQB
12 1 (0.079%) PhD
Quality Assurance & Compliance
1 52 (4.10%) QA
2 29 (2.29%) Accessibility
3 5 (0.39%) WCAG
4 3 (0.24%) Data Quality
4 3 (0.24%) Def Stans
4 3 (0.24%) MISRA
4 3 (0.24%) PSD2
5 2 (0.16%) SEPA
6 1 (0.079%) ISO 20022
System Software
1 225 (17.76%) Docker
2 22 (1.74%) Hyper-V
3 15 (1.18%) Virtual Servers
4 5 (0.39%) Active Directory
5 4 (0.32%) Firmware
6 1 (0.079%) GridGain
6 1 (0.079%) Virtual Machines
Systems Management
1 153 (12.08%) Kubernetes
2 73 (5.76%) Terraform
3 45 (3.55%) Ansible
4 10 (0.79%) Grafana
5 6 (0.47%) Kibana
6 5 (0.39%) Argo
6 5 (0.39%) Progress Chef
6 5 (0.39%) Puppet
7 4 (0.32%) Prometheus
8 1 (0.079%) Hadoop YARN
Vendors
1 472 (37.25%) Microsoft
2 28 (2.21%) WSO2
3 26 (2.05%) Facebook
4 18 (1.42%) Google
4 18 (1.42%) Oracle
5 12 (0.95%) Splunk
6 9 (0.71%) Databricks
6 9 (0.71%) Dell
7 8 (0.63%) Adobe
7 8 (0.63%) Teradata
8 7 (0.55%) IBM
9 6 (0.47%) Alterian
9 6 (0.47%) Sitecore
10 4 (0.32%) ServiceNow
10 4 (0.32%) Twitter
11 3 (0.24%) Apple
12 2 (0.16%) Ab Initio
12 2 (0.16%) Northgate
12 2 (0.16%) Salesforce
12 2 (0.16%) Xamarin