Service Delivery Jobs in the UK excluding London

Service Delivery
UK > UK excluding London

The table below provides summary statistics for permanent job vacancies advertised in the UK excluding London requiring Service Delivery skills. It includes a benchmarking guide to the annual salaries offered in vacancies that cited Service Delivery over the 6 months leading up to 30 May 2025, comparing them to the same period in the previous two years.

6 months to
30 May 2025
Same period 2024 Same period 2023
Rank 67 98 129
Rank change year-on-year +31 +31 -41
Permanent jobs citing Service Delivery 1,618 1,981 1,604
As % of all permanent jobs advertised in the UK excluding London 4.11% 2.66% 2.76%
As % of the Processes & Methodologies category 4.43% 3.23% 2.89%
Number of salaries quoted 539 1,371 1,002
10th Percentile £29,450 £26,250 £25,014
25th Percentile £37,563 £35,000 £31,250
Median annual salary (50th Percentile) £50,500 £45,475 £45,600
Median % change year-on-year +11.05% -0.27% -4.00%
75th Percentile £63,750 £61,250 £62,500
90th Percentile £75,000 £71,725 £75,000
UK median annual salary £55,000 £50,000 £52,500
% change year-on-year +10.00% -4.76% +5.00%

All Process and Methodology Skills
UK excluding London

Service Delivery falls under the Processes and Methodologies category. For comparison with the information above, the following table provides summary statistics for all permanent job vacancies requiring process or methodology skills in the UK excluding London.

Permanent vacancies with a requirement for process or methodology skills 36,483 61,419 55,450
As % of all permanent jobs advertised in the UK excluding London 92.65% 82.37% 95.58%
Number of salaries quoted 17,392 42,187 28,711
10th Percentile £26,250 £27,250 £30,500
25th Percentile £36,750 £36,250 £40,000
Median annual salary (50th Percentile) £51,574 £50,000 £55,000
Median % change year-on-year +3.15% -9.09% +4.76%
75th Percentile £65,000 £65,000 £70,000
90th Percentile £77,500 £77,500 £82,500
UK median annual salary £57,443 £55,000 £60,899
% change year-on-year +4.44% -9.69% +1.50%

Service Delivery
Job Vacancy Trend in the UK excluding London

Job postings citing Service Delivery as a proportion of all IT jobs advertised in the UK excluding London.
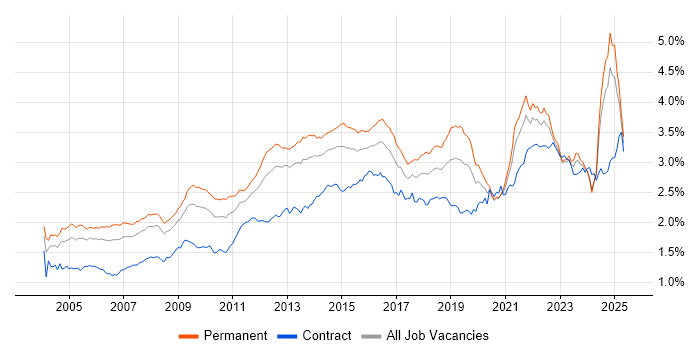
Job vacancy trend for Service Delivery in the UK excluding London

Service Delivery
Salary Trend in the UK excluding London

3-month moving average salary quoted in jobs citing Service Delivery in the UK excluding London.

Salary trend for Service Delivery in the UK excluding London

Service Delivery
Salary Histogram in the UK excluding London

Salary distribution for jobs citing Service Delivery in the UK excluding London over the 6 months to 30 May 2025.

Salary histogram for Service Delivery in the UK excluding London

Service Delivery
Job Locations in the UK excluding London

The table below looks at the demand and provides a guide to the median salaries quoted in IT jobs citing Service Delivery within the UK excluding London region over the 6 months to 30 May 2025. The 'Rank Change' column provides an indication of the change in demand within each location based on the same 6 month period last year.

Location Rank Change
on Same Period
Last Year
Matching
Permanent
IT Job Ads
Median Salary
Past 6 Months
Median Salary
% Change
on Same Period
Last Year
Live
Jobs
South East +76 787 £53,500 +15.05% 910
North of England -34 321 £50,000 +13.74% 721
North West -17 248 £50,000 - 351
Midlands -1 193 £53,450 +13.18% 602
West Midlands +3 144 £55,750 +11.50% 332
East of England +21 143 £37,500 -1.32% 468
South West -13 98 £56,785 +13.57% 362
Yorkshire -16 65 £40,000 -5.88% 277
East Midlands -9 46 £45,000 +20.00% 235
Scotland +23 42 £53,000 +6.00% 177
Wales +8 20 £37,733 -16.15% 93
Northern Ireland +39 15 - - 50
North East -17 8 £52,000 +108.33% 95
Channel Islands - 1 £45,000 - 5
Service Delivery
UK

Service Delivery
Co-occurring Skills and Capabilities in the UK excluding London by Category

The follow tables expand on the table above by listing co-occurrences grouped by category. The same employment type, locality and period is covered with up to 20 co-occurrences shown in each of the following categories:

Application Platforms
1 38 (2.35%) SharePoint
2 23 (1.42%) Microsoft Exchange
3 19 (1.17%) Confluence
4 4 (0.25%) IIS
5 3 (0.19%) nginx
6 1 (0.062%) NetWeaver
6 1 (0.062%) OpenStack
6 1 (0.062%) Tomcat
Applications
1 67 (4.14%) Microsoft Excel
2 49 (3.03%) Microsoft Office
3 39 (2.41%) Microsoft PowerPoint
4 18 (1.11%) Microsoft Project
5 14 (0.87%) Trello
6 6 (0.37%) Chatbot
7 2 (0.12%) AutoCAD
7 2 (0.12%) MS Visio
7 2 (0.12%) Spreadsheet
Business Applications
1 8 (0.49%) Remedy ITSM
2 5 (0.31%) PeopleSoft Financials
2 5 (0.31%) Salesforce CRM
3 4 (0.25%) Infor M3
4 2 (0.12%) Dynamics CRM
4 2 (0.12%) Dynamics NAV
5 1 (0.062%) Dynamics GP
5 1 (0.062%) Oracle ERP
5 1 (0.062%) Oracle Subledger Accounting
5 1 (0.062%) Orchard Housing
5 1 (0.062%) Sage 200
5 1 (0.062%) SAP S/4HANA
5 1 (0.062%) Unit4 Business World
Cloud Services
1 173 (10.69%) Azure
2 127 (7.85%) Microsoft 365
3 63 (3.89%) AWS
4 46 (2.84%) Power Platform
5 38 (2.35%) Entra ID
6 22 (1.36%) SaaS
7 14 (0.87%) PowerApps
8 13 (0.80%) GCP
9 12 (0.74%) Azure Monitor
9 12 (0.74%) Power Automate
10 10 (0.62%) Dynamics 365
10 10 (0.62%) IaaS
10 10 (0.62%) OneDrive
11 9 (0.56%) Google Workspace
12 8 (0.49%) Cloud Computing
12 8 (0.49%) PaaS
13 6 (0.37%) GitHub
13 6 (0.37%) Microsoft Copilot
14 5 (0.31%) Azure Sentinel
14 5 (0.31%) Serverless
Communications & Networking
1 48 (2.97%) Firewall
2 35 (2.16%) Wireless
3 29 (1.79%) Broadband
4 27 (1.67%) Wi-Fi
5 25 (1.55%) WAN
6 23 (1.42%) VLAN
7 22 (1.36%) LAN
8 20 (1.24%) Network Security
9 16 (0.99%) DNS
10 15 (0.93%) VPN
11 14 (0.87%) TCP/IP
12 13 (0.80%) VoIP
13 11 (0.68%) SD-WAN
14 10 (0.62%) Cisco IOS
15 9 (0.56%) DHCP
15 9 (0.56%) OSPF
15 9 (0.56%) WLAN
16 8 (0.49%) Internet
17 7 (0.43%) BGP
17 7 (0.43%) MPLS
Database & Business Intelligence
1 41 (2.53%) SQL Server
2 37 (2.29%) Power BI
3 20 (1.24%) Data Mining
4 19 (1.17%) BusinessObjects
5 16 (0.99%) Data Warehouse
6 7 (0.43%) SQL Server Integration Services
6 7 (0.43%) SQL Server Reporting Services
7 5 (0.31%) Amazon RDS
7 5 (0.31%) Microsoft Analysis Services
7 5 (0.31%) SQL Server Analysis Services
8 4 (0.25%) Elasticsearch
8 4 (0.25%) MySQL
8 4 (0.25%) Power Query
8 4 (0.25%) PowerPivot
9 3 (0.19%) MariaDB
10 2 (0.12%) GIS
10 2 (0.12%) Metadata
10 2 (0.12%) PostgreSQL
11 1 (0.062%) MongoDB
11 1 (0.062%) SAP Data Services
Development Applications
1 46 (2.84%) JIRA
2 7 (0.43%) SQL Server Management Studio (SSMS)
3 6 (0.37%) NDoc
4 2 (0.12%) GitLab
4 2 (0.12%) Jenkins
5 1 (0.062%) Oracle Forms
5 1 (0.062%) Visual Studio
General
1 846 (52.29%) Manufacturing
2 365 (22.56%) Social Skills
3 169 (10.44%) Finance
4 89 (5.50%) Analytical Skills
5 59 (3.65%) Law
6 53 (3.28%) Retail
7 52 (3.21%) Legal
8 44 (2.72%) Public Sector
9 38 (2.35%) Inclusion and Diversity
10 29 (1.79%) Organisational Skills
11 28 (1.73%) Games
11 28 (1.73%) Military
12 27 (1.67%) Telecoms
13 25 (1.55%) Billing
14 21 (1.30%) Marketing
15 19 (1.17%) Influencing Skills
16 16 (0.99%) Electronics
17 15 (0.93%) Presentation Skills
18 14 (0.87%) Pharmaceutical
19 11 (0.68%) Aerospace
Job Titles
1 90 (5.56%) IT Manager
2 88 (5.44%) Technical Support
3 84 (5.19%) Senior
3 84 (5.19%) Support Technician
4 79 (4.88%) Analyst
5 71 (4.39%) IT Support
6 67 (4.14%) Lead
7 61 (3.77%) Service Manager
8 59 (3.65%) Developer
9 53 (3.28%) Support Analyst
10 50 (3.09%) Consultant
11 48 (2.97%) Senior Manager
12 41 (2.53%) Delivery Manager
13 36 (2.22%) Head of IT
14 34 (2.10%) 1st Line Support
14 34 (2.10%) 2nd Line Support
15 33 (2.04%) IT Analyst
16 30 (1.85%) IT Support Analyst
16 30 (1.85%) Software Developer
17 29 (1.79%) Support Manager
Libraries, Frameworks & Software Standards
1 12 (0.74%) PyTorch
1 12 (0.74%) TensorFlow
2 11 (0.68%) Hugging Face
2 11 (0.68%) LangChain
3 10 (0.62%) Web Services
4 5 (0.31%) .NET
4 5 (0.31%) REST
5 4 (0.25%) XML
6 3 (0.19%) AngularJS
6 3 (0.19%) CSS
6 3 (0.19%) HTML
7 2 (0.12%) .NET Framework
7 2 (0.12%) ASP.NET Web API
7 2 (0.12%) Entity Framework
7 2 (0.12%) Lambda Expressions
7 2 (0.12%) LINQ
7 2 (0.12%) Middleware
8 1 (0.062%) Jest
8 1 (0.062%) Svelte
8 1 (0.062%) Vue
Miscellaneous
1 118 (7.29%) Management Information System
2 46 (2.84%) Driving Licence
3 45 (2.78%) Self-Motivation
4 37 (2.29%) Product Ownership
5 31 (1.92%) Social Media
6 28 (1.73%) Data Structures
7 22 (1.36%) Onboarding
7 22 (1.36%) Video\Live Streaming
8 18 (1.11%) Data Centre
9 13 (0.80%) Team-Oriented Environment
10 12 (0.74%) EPoS
11 9 (0.56%) Enterprise Software
12 8 (0.49%) Public Cloud
12 8 (0.49%) Smartphone
13 6 (0.37%) Fibre Optics
13 6 (0.37%) iSeries
13 6 (0.37%) Legacy Systems
14 5 (0.31%) IoT
14 5 (0.31%) Mainframe
14 5 (0.31%) Virtual Team
Operating Systems
1 125 (7.73%) Windows
2 52 (3.21%) Windows Server
3 38 (2.35%) Linux
4 32 (1.98%) Windows 10
5 21 (1.30%) Mac OS
6 13 (0.80%) Windows Vista
7 12 (0.74%) Ubuntu
8 11 (0.68%) Apple iOS
8 11 (0.68%) CentOS
8 11 (0.68%) Mac OS X
9 5 (0.31%) Android
9 5 (0.31%) Rocky
10 4 (0.25%) Unix
11 3 (0.19%) AIX
11 3 (0.19%) Solaris
11 3 (0.19%) VMS
12 2 (0.12%) Red Hat Enterprise Linux
12 2 (0.12%) Windows Server 2012
13 1 (0.062%) Windows Server 2019
13 1 (0.062%) zOS
Processes & Methodologies
1 258 (15.95%) Customer Service
2 243 (15.02%) ITIL
3 242 (14.96%) Problem-Solving
4 203 (12.55%) Continuous Improvement
5 158 (9.77%) Coaching
6 137 (8.47%) Customer Experience
7 123 (7.60%) Service Management
8 113 (6.98%) ITSM
9 107 (6.61%) Change Management
10 104 (6.43%) Project Management
11 102 (6.30%) Agile
12 89 (5.50%) Incident Management
13 85 (5.25%) Technical Analysis
14 81 (5.01%) Project Delivery
15 79 (4.88%) Roadmaps
16 76 (4.70%) Cybersecurity
17 75 (4.64%) Mentoring
18 72 (4.45%) Problem Management
18 72 (4.45%) Stakeholder Management
19 71 (4.39%) Computer Science
Programming Languages
1 77 (4.76%) SQL
2 34 (2.10%) C#
3 28 (1.73%) Java
4 20 (1.24%) Python
5 19 (1.17%) VBA
6 18 (1.11%) PowerShell
7 5 (0.31%) Bash
7 5 (0.31%) JavaScript
8 4 (0.25%) RPG
8 4 (0.25%) VB
9 2 (0.12%) C++
9 2 (0.12%) T-SQL
10 1 (0.062%) Bicep
10 1 (0.062%) C
10 1 (0.062%) JCL
10 1 (0.062%) TypeScript
10 1 (0.062%) VBScript
Qualifications
1 742 (45.86%) NVQ Level 3
2 225 (13.91%) Degree
3 92 (5.69%) NVQ Level 4
4 56 (3.46%) Security Cleared
5 48 (2.97%) Computer Science Degree
6 43 (2.66%) SC Cleared
7 37 (2.29%) DBS Check
8 30 (1.85%) BPSS Clearance
9 27 (1.67%) Microsoft Certification
10 25 (1.55%) ITIL Certification
11 24 (1.48%) Cisco Certification
11 24 (1.48%) Master's Degree
12 20 (1.24%) CCNP
13 17 (1.05%) MCSA
13 17 (1.05%) PMI Certification
13 17 (1.05%) PMP
14 15 (0.93%) HND
15 12 (0.74%) Azure Certification
15 12 (0.74%) CCNA
15 12 (0.74%) Network+ Certification
Quality Assurance & Compliance
1 56 (3.46%) SLA
2 26 (1.61%) GDPR
3 20 (1.24%) QA
4 11 (0.68%) ISO/IEC 27001
5 10 (0.62%) Cyber Essentials
6 8 (0.49%) Sarbanes-Oxley
7 6 (0.37%) NIST
8 4 (0.25%) COBIT
8 4 (0.25%) ISO/IEC 20000
9 3 (0.19%) PMO
10 2 (0.12%) Accessibility
10 2 (0.12%) Cyber Essentials PLUS
11 1 (0.062%) Data Quality
11 1 (0.062%) GRC
11 1 (0.062%) HIPAA
11 1 (0.062%) HL7
11 1 (0.062%) ISO 22301
11 1 (0.062%) SOC 2
System Software
1 79 (4.88%) Active Directory
2 24 (1.48%) Hyper-V
2 24 (1.48%) VMware Infrastructure
3 4 (0.25%) Docker
4 3 (0.19%) Firmware
4 3 (0.19%) Virtual Machines
4 3 (0.19%) vSphere
5 2 (0.12%) Virtual Desktop
5 2 (0.12%) Virtual Servers
6 1 (0.062%) NFS
6 1 (0.062%) Oracle RAC
6 1 (0.062%) Terminal Services
6 1 (0.062%) Time Sharing Option
6 1 (0.062%) vCloud
6 1 (0.062%) Veritas Cluster Server
6 1 (0.062%) VMware ESXi
Systems Management
1 31 (1.92%) Microsoft Intune
2 14 (0.87%) Grafana
2 14 (0.87%) Prometheus
3 12 (0.74%) FortiGate
4 11 (0.68%) Kubernetes
5 9 (0.56%) Ansible
6 8 (0.49%) SCCM
7 7 (0.43%) Terraform
8 6 (0.37%) WSUS
9 4 (0.25%) Jamf Pro
10 3 (0.19%) Autotask
11 2 (0.12%) Active Directory Federation Services
11 2 (0.12%) Failover Clustering
11 2 (0.12%) Puppet
12 1 (0.062%) NetBackup
12 1 (0.062%) PowerCLI
12 1 (0.062%) Systems Management Server (SMS)
12 1 (0.062%) Tivoli Storage Manager
12 1 (0.062%) vCenter Server
12 1 (0.062%) vRealize
Vendors
1 241 (14.89%) Microsoft
2 66 (4.08%) ServiceNow
3 54 (3.34%) Oracle
4 45 (2.78%) Cisco
5 35 (2.16%) VMware
6 28 (1.73%) Sun
7 20 (1.24%) Facebook
8 15 (0.93%) Atlassian
9 12 (0.74%) Apple
9 12 (0.74%) OpenAI
10 10 (0.62%) Google
10 10 (0.62%) Red Hat
10 10 (0.62%) Workday
11 9 (0.56%) Palo Alto
11 9 (0.56%) Salesforce
11 9 (0.56%) SAP
12 8 (0.49%) BMC
12 8 (0.49%) Remedy
13 7 (0.43%) Draytek
13 7 (0.43%) HP