Amazon RDS Jobs with Work from Home Options

Amazon Relational Database Service (RDS)
UK > Work from Home

The table below provides summary statistics for permanent job vacancies with an option to work from home (WFH) and a requirement for Amazon RDS skills. Included is a benchmarking guide to the salaries offered in vacancies that have cited Amazon RDS over the 6 months to 5 May 2024 with a comparison to the same period in the previous 2 years.

6 months to
5 May 2024
Same period 2023 Same period 2022
Rank 367 408 331
Rank change year-on-year +41 -77 -41
Permanent jobs citing Amazon RDS 229 276 718
As % of all permanent jobs with a WFH option 0.68% 0.65% 1.06%
As % of the Database & Business Intelligence category 2.97% 2.64% 3.58%
Number of salaries quoted 149 214 324
10th Percentile £31,250 £45,375 £46,250
25th Percentile £41,250 £56,250 £52,500
Median annual salary (50th Percentile) £65,000 £70,500 £70,000
Median % change year-on-year -7.80% +0.71% +7.69%
75th Percentile £77,500 £97,500 £85,000
90th Percentile £87,500 £112,500 £97,125
UK median annual salary £65,000 £70,000 £70,000
% change year-on-year -7.14% - +7.69%

All Database and Business Intelligence Skills
Work from Home

Amazon RDS is in the Databases and Business Intelligence category. The following table is for comparison with the above and provides summary statistics for all permanent job vacancies with a WFH option and a requirement for database or business intelligence skills.

Permanent vacancies with a requirement for database or business intelligence skills 7,722 10,462 20,057
As % of all permanent jobs with a WFH option 22.85% 24.68% 29.48%
Number of salaries quoted 6,198 7,181 11,144
10th Percentile £37,000 £40,000 £36,250
25th Percentile £43,750 £49,750 £45,000
Median annual salary (50th Percentile) £57,500 £65,000 £60,000
Median % change year-on-year -11.54% +8.33% +9.09%
75th Percentile £75,000 £82,500 £77,500
90th Percentile £95,000 £102,500 £93,750
UK median annual salary £57,500 £65,000 £60,000
% change year-on-year -11.54% +8.33% +9.09%

Amazon RDS
Trend for Jobs with a WFH Option

Job vacancies with a work from home option citing Amazon RDS as a proportion of all IT jobs advertised.
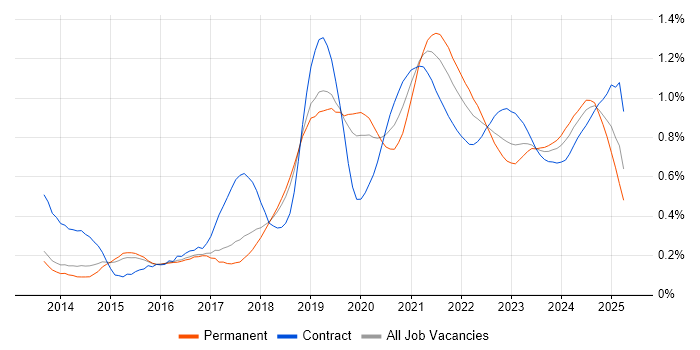
Amazon RDS trend for jobs with a WFH option

Amazon RDS
Salary Trend for Jobs with a WFH Option

3-month moving average salary quoted in job vacancies with a work from home option citing Amazon RDS.

Amazon RDS salary trend for jobs with a WFH option

Amazon RDS
Salary Histogram for Jobs with a WFH Option

Salary distribution for jobs with a work from home option citing Amazon RDS over the 6 months to 5 May 2024.

Amazon RDS salary histogram for jobs with a WFH option

Amazon RDS
Co-occurring Skills and Capabilities with WFH Options by Category

The follow tables expand on the table above by listing co-occurrences grouped by category. The same employment type, locality and period is covered with up to 20 co-occurrences shown in each of the following categories:

Application Platforms
1 46 (20.09%) WebLogic
2 22 (9.61%) SharePoint
3 15 (6.55%) Microsoft Exchange
4 10 (4.37%) OpenStack
5 9 (3.93%) Confluence
6 5 (2.18%) nginx
7 3 (1.31%) IIS
8 1 (0.44%) Moodle
Applications
1 10 (4.37%) Microsoft Office
2 1 (0.44%) Notion
Business Applications
1 46 (20.09%) Sparx Enterprise Architect
2 1 (0.44%) Salesforce CRM
2 1 (0.44%) SAP S/4HANA
Cloud Services
1 191 (83.41%) AWS
2 112 (48.91%) Azure
3 90 (39.30%) AWS Lambda
3 90 (39.30%) Serverless
4 82 (35.81%) Amazon EC2
5 80 (34.93%) Amazon S3
6 76 (33.19%) Amazon EKS
7 52 (22.71%) Amazon SQS
8 41 (17.90%) Amazon CloudWatch
8 41 (17.90%) AWS CloudFormation
9 38 (16.59%) Virtual Private Cloud
10 32 (13.97%) GitHub
11 29 (12.66%) Route 53
12 25 (10.92%) CloudFront
13 24 (10.48%) Microsoft 365
14 18 (7.86%) GCP
15 15 (6.55%) AWS CloudTrail
15 15 (6.55%) Azure AKS
15 15 (6.55%) Entra ID
16 12 (5.24%) AWS Elastic Beanstalk
Communications & Networking
1 65 (28.38%) DNS
2 51 (22.27%) TCP/IP
3 46 (20.09%) BGP
3 46 (20.09%) SSL
4 30 (13.10%) VPN
5 25 (10.92%) Firewall
6 16 (6.99%) Remote Desktop
7 15 (6.55%) SAN
8 12 (5.24%) DHCP
9 10 (4.37%) LAN
9 10 (4.37%) WAN
10 8 (3.49%) VLAN
11 7 (3.06%) FTP
12 5 (2.18%) AMQP
12 5 (2.18%) DAB
12 5 (2.18%) MQTT
12 5 (2.18%) Network Security
12 5 (2.18%) Reverse Proxy
12 5 (2.18%) Wi-Fi
13 4 (1.75%) Fibre Channel
Database & Business Intelligence
1 57 (24.89%) Relational Database
2 47 (20.52%) RDBMS
3 46 (20.09%) Oracle Database
4 29 (12.66%) DynamoDB
4 29 (12.66%) MySQL
4 29 (12.66%) PostgreSQL
5 24 (10.48%) SQL Server
6 16 (6.99%) Amazon Aurora
7 13 (5.68%) MongoDB
8 11 (4.80%) Amazon Redshift
9 8 (3.49%) NoSQL
10 6 (2.62%) BigQuery
11 5 (2.18%) InfluxDB
12 3 (1.31%) Data Warehouse
13 1 (0.44%) Azure SQL Database
13 1 (0.44%) Big Data
13 1 (0.44%) Data Lake
13 1 (0.44%) Electronic Patient Records
13 1 (0.44%) Enterprise Data Warehouse
13 1 (0.44%) Tableau
Development Applications
1 42 (18.34%) GitLab
2 40 (17.47%) Git
3 30 (13.10%) Jenkins
4 12 (5.24%) Bitbucket
5 10 (4.37%) JIRA
6 9 (3.93%) Sonatype Nexus
6 9 (3.93%) Subversion
7 3 (1.31%) Octopus Deploy
8 2 (0.87%) Burp Suite
8 2 (0.87%) Cucumber
8 2 (0.87%) Metasploit
8 2 (0.87%) sqlmap
9 1 (0.44%) Gradle
9 1 (0.44%) Jasmine
9 1 (0.44%) Postman
9 1 (0.44%) SoapUI
9 1 (0.44%) SonarQube
9 1 (0.44%) TestNG
9 1 (0.44%) Travis CI
9 1 (0.44%) Vagrant
General
1 122 (53.28%) Social Skills
2 17 (7.42%) Finance
3 12 (5.24%) Organisational Skills
4 8 (3.49%) Inclusion and Diversity
5 6 (2.62%) Law
6 3 (1.31%) Analytical Skills
6 3 (1.31%) Games
7 2 (0.87%) Marketing
7 2 (0.87%) Retail
7 2 (0.87%) Tech for Good
7 2 (0.87%) Telecoms
8 1 (0.44%) Advertising
8 1 (0.44%) Pharmaceutical
8 1 (0.44%) Public Sector
Job Titles
1 61 (26.64%) Architect
2 56 (24.45%) Lead
3 54 (23.58%) Solutions Architect
4 53 (23.14%) AWS Engineer
5 46 (20.09%) Lead Architect
5 46 (20.09%) Lead Solutions Architect
6 34 (14.85%) Support Engineer
7 30 (13.10%) Developer
8 29 (12.66%) DevOps Engineer
9 27 (11.79%) 3rd Line Engineer
9 27 (11.79%) 3rd Line Support
9 27 (11.79%) 3rd Line Support Engineer
9 27 (11.79%) Senior
10 25 (10.92%) IT Support
11 24 (10.48%) IT Engineer
11 24 (10.48%) IT Support Engineer
12 23 (10.04%) Cloud Engineer
13 20 (8.73%) Infrastructure Engineer
14 18 (7.86%) AWS DevOps
14 18 (7.86%) AWS DevOps Engineer
Libraries, Frameworks & Software Standards
1 63 (27.51%) RabbitMQ
2 48 (20.96%) Spring Boot
3 34 (14.85%) RESTful
4 32 (13.97%) GraphQL
5 27 (11.79%) Django
6 13 (5.68%) Middleware
7 11 (4.80%) Node.js
7 11 (4.80%) React
8 10 (4.37%) LDAP
9 7 (3.06%) .NET
9 7 (3.06%) CSS
9 7 (3.06%) HTML
10 6 (2.62%) .NET Framework
10 6 (2.62%) React Native
11 5 (2.18%) gRPC
11 5 (2.18%) Knex.js
11 5 (2.18%) LEMP Stack
11 5 (2.18%) Sequelize
12 4 (1.75%) Elastic Stack
12 4 (1.75%) Spring
Miscellaneous
1 55 (24.02%) Enterprise Software
2 46 (20.09%) Public Cloud
3 18 (7.86%) Data Centre
4 13 (5.68%) Driving Licence
5 12 (5.24%) iPad
6 11 (4.80%) Distributed Systems
7 10 (4.37%) Enterprise Storage
8 9 (3.93%) Cloud Native
8 9 (3.93%) Linux Command Line
9 7 (3.06%) Client/Server
10 6 (2.62%) Hybrid Cloud
10 6 (2.62%) Private Cloud
11 5 (2.18%) IoT
11 5 (2.18%) Mobile App
11 5 (2.18%) Self-Motivation
12 3 (1.31%) Educational Technology
12 3 (1.31%) Greenfield Project
12 3 (1.31%) Legacy Code
13 2 (0.87%) PKI
14 1 (0.44%) Life Science
Operating Systems
1 97 (42.36%) Linux
2 64 (27.95%) Windows
3 48 (20.96%) Red Hat Enterprise Linux
4 26 (11.35%) Windows Server
5 11 (4.80%) Windows Server 2016
6 10 (4.37%) Ubuntu
6 10 (4.37%) Windows Server 2019
7 9 (3.93%) Debian
8 5 (2.18%) Unix
9 2 (0.87%) Solaris
9 2 (0.87%) Windows 10
9 2 (0.87%) Windows 7
9 2 (0.87%) Windows Server 2012
10 1 (0.44%) CentOS
Processes & Methodologies
1 94 (41.05%) Agile
2 70 (30.57%) CI/CD
3 65 (28.38%) Migration
4 62 (27.07%) DevOps
5 58 (25.33%) Data Migration
6 57 (24.89%) Load Balancing
7 56 (24.45%) Cloud Operations
8 53 (23.14%) Problem-Solving
9 52 (22.71%) Open Source
10 47 (20.52%) Collaborative Working
10 47 (20.52%) Project Management
10 47 (20.52%) Scrum
10 47 (20.52%) SDLC
11 46 (20.09%) Actionable Insight
11 46 (20.09%) ArchiMate
11 46 (20.09%) Infrastructure as Code
11 46 (20.09%) Kanban
11 46 (20.09%) Re-Platforming
11 46 (20.09%) Systems Engineering
11 46 (20.09%) TOGAF
Programming Languages
1 90 (39.30%) Python
2 27 (11.79%) SQL
3 26 (11.35%) Java
4 25 (10.92%) Bash
5 9 (3.93%) C#
6 8 (3.49%) JavaScript
6 8 (3.49%) TypeScript
7 7 (3.06%) Shell Script
8 6 (2.62%) Go
9 5 (2.18%) JSX
9 5 (2.18%) PowerShell
9 5 (2.18%) R
10 2 (0.87%) PHP
11 1 (0.44%) C
11 1 (0.44%) PL/SQL
11 1 (0.44%) Ruby
11 1 (0.44%) Scala
11 1 (0.44%) T-SQL
Qualifications
1 67 (29.26%) AWS Certification
2 61 (26.64%) SC Cleared
2 61 (26.64%) Security Cleared
3 60 (26.20%) AWS Certified Solutions Architect
3 60 (26.20%) Azure Certification
4 26 (11.35%) DBS Check
5 18 (7.86%) Microsoft Certification
6 17 (7.42%) Degree
7 15 (6.55%) Computer Science Degree
8 11 (4.80%) AWS Certified DevOps Engineer
9 3 (1.31%) ITIL Certification
10 2 (0.87%) A+ Certification
10 2 (0.87%) MCSE
10 2 (0.87%) VMware Certified Professional (VCP)
11 1 (0.44%) AWS Certified Cloud Practitioner
11 1 (0.44%) CompTIA Security+
11 1 (0.44%) ITIL Foundation Certificate
11 1 (0.44%) Master's Degree
11 1 (0.44%) MCSA
11 1 (0.44%) Network+ Certification
Quality Assurance & Compliance
1 5 (2.18%) NIST
2 3 (1.31%) SOC 2
3 2 (0.87%) Data Quality
3 2 (0.87%) ISO/IEC 27001
3 2 (0.87%) PMO
3 2 (0.87%) QA
3 2 (0.87%) SLA
4 1 (0.44%) Accessibility
4 1 (0.44%) California Consumer Privacy Act
4 1 (0.44%) GDPR
4 1 (0.44%) HIPAA
System Software
1 52 (22.71%) Docker
2 41 (17.90%) Active Directory
3 33 (14.41%) Hyper-V
4 21 (9.17%) VMware Infrastructure
5 12 (5.24%) Virtual Desktop
6 8 (3.49%) Virtual Machines
6 8 (3.49%) VMware ESXi
7 2 (0.87%) Terminal Server
8 1 (0.44%) vSphere
Systems Management
1 76 (33.19%) Kubernetes
2 62 (27.07%) Terraform
3 20 (8.73%) Grafana
4 15 (6.55%) Ansible
5 10 (4.37%) Progress Chef
6 9 (3.93%) Packer
7 8 (3.49%) Microsoft Intune
7 8 (3.49%) Prometheus
8 6 (2.62%) Puppet
9 5 (2.18%) Docker Swarm
10 4 (1.75%) Salt
11 2 (0.87%) PowerCLI
11 2 (0.87%) SCCM
11 2 (0.87%) Single Sign-On
11 2 (0.87%) vCenter Server
11 2 (0.87%) vRealize
11 2 (0.87%) vRealize Orchestrator
12 1 (0.44%) Consul
12 1 (0.44%) Kibana
Vendors
1 63 (27.51%) Oracle
2 50 (21.83%) Microsoft
3 46 (20.09%) Sparx
4 21 (9.17%) VMware
5 17 (7.42%) Citrix
6 10 (4.37%) Atlassian
6 10 (4.37%) Google
7 8 (3.49%) Cisco
8 7 (3.06%) Meraki
8 7 (3.06%) Veeam
9 3 (1.31%) HP
9 3 (1.31%) New Relic
9 3 (1.31%) Nimble Storage
9 3 (1.31%) Rackspace
9 3 (1.31%) SolarWinds
10 2 (0.87%) 3PAR
10 2 (0.87%) Brocade
10 2 (0.87%) Sophos
11 1 (0.44%) Databricks
11 1 (0.44%) Zerto