Continuous Delivery Jobs with Hybrid/Remote/WFH Options

Continuous Delivery
UK > Work from Home

The table below provides summary statistics for permanent remote or hybrid work requiring Continuous Delivery skills. It includes a benchmarking guide to the annual salaries offered in vacancies that cited Continuous Delivery over the 6 months leading up to 8 May 2025, comparing them to the same period in the previous two years.

6 months to
8 May 2025
Same period 2024 Same period 2023
Rank 273 348 253
Rank change year-on-year +75 -95 -75
Permanent jobs citing Continuous Delivery 162 274 570
As % of all permanent jobs with a WFH option 0.99% 0.81% 1.35%
As % of the Processes & Methodologies category 1.05% 0.89% 1.41%
Number of salaries quoted 120 231 399
10th Percentile £46,250 £52,500 £55,000
25th Percentile £52,500 £59,000 £61,180
Median annual salary (50th Percentile) £64,000 £70,000 £78,142
Median % change year-on-year -8.57% -10.42% -2.32%
75th Percentile £80,313 £92,500 £95,000
90th Percentile £107,500 £112,500 £115,000
UK median annual salary £65,000 £70,000 £75,000
% change year-on-year -7.14% -6.67% -

All Process and Methodology Skills
Work from Home

Continuous Delivery falls under the Processes and Methodologies category. For comparison with the information above, the following table provides summary statistics for all permanent job vacancies with remote or hybrid options requiring process or methodology skills.

Permanent vacancies with a requirement for process or methodology skills 15,406 30,912 40,454
As % of all permanent jobs with a WFH option 93.78% 91.49% 96.12%
Number of salaries quoted 9,748 23,470 28,078
10th Percentile £29,750 £33,767 £37,500
25th Percentile £44,000 £42,500 £47,500
Median annual salary (50th Percentile) £60,000 £57,500 £62,500
Median % change year-on-year +4.35% -8.00% +4.17%
75th Percentile £77,500 £75,000 £82,500
90th Percentile £102,500 £95,000 £100,000
UK median annual salary £57,500 £55,000 £61,180
% change year-on-year +4.55% -10.10% +1.97%

Continuous Delivery
Trend for Jobs with a WFH Option

Job vacancies with remote working options citing Continuous Delivery as a proportion of all IT jobs advertised.
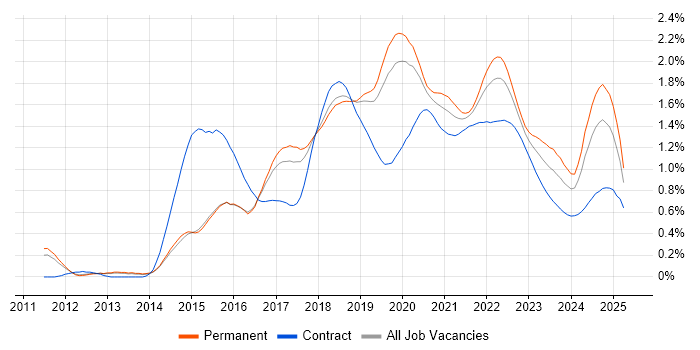
Continuous Delivery trend for jobs with Hybrid/Remote/WFH options

Continuous Delivery
Salary Trend for Jobs with a WFH Option

3-month moving average salary quoted in job vacancies with remote working options citing Continuous Delivery.

Continuous Delivery salary trend for jobs with a WFH option

Continuous Delivery
Salary Histogram for Jobs with a WFH Option

Salary distribution for jobs with remote working options citing Continuous Delivery over the 6 months to 8 May 2025.

Continuous Delivery salary histogram for jobs with a WFH option

Continuous Delivery
Co-occurring Skills and Capabilities with WFH Options by Category

The follow tables expand on the table above by listing co-occurrences grouped by category. The same employment type, locality and period is covered with up to 20 co-occurrences shown in each of the following categories:

Application Platforms
1 3 (1.85%) Confluence
2 2 (1.23%) Apache Spark
2 2 (1.23%) Tomcat
2 2 (1.23%) WebSphere
2 2 (1.23%) WebSphere Application Server
Applications
1 5 (3.09%) Trello
Business Applications
1 12 (7.41%) Oracle EBS
Cloud Services
1 76 (46.91%) AWS
1 76 (46.91%) Azure
2 44 (27.16%) GCP
3 27 (16.67%) SaaS
4 26 (16.05%) PaaS
5 25 (15.43%) Azure DevOps
6 19 (11.73%) Serverless
7 15 (9.26%) GitHub
8 14 (8.64%) AWS Lambda
9 13 (8.02%) Power Platform
10 12 (7.41%) Amazon ECS
10 12 (7.41%) AWS CloudFormation
10 12 (7.41%) Cloud Computing
11 11 (6.79%) Amazon ECR
11 11 (6.79%) Amazon ElastiCache
11 11 (6.79%) Amazon OpenSearch
11 11 (6.79%) AWS CodeBuild
11 11 (6.79%) dbt
11 11 (6.79%) Dynamics 365
11 11 (6.79%) Pulumi
Communications & Networking
1 12 (7.41%) TCP/IP
2 8 (4.94%) HTTP
3 4 (2.47%) Internet
4 2 (1.23%) Cisco Nexus
4 2 (1.23%) FCoE
4 2 (1.23%) Fibre Channel
4 2 (1.23%) Firewall
4 2 (1.23%) iSCSI
4 2 (1.23%) LAN
4 2 (1.23%) Multicast
4 2 (1.23%) NAS
4 2 (1.23%) SAN
4 2 (1.23%) VPN
4 2 (1.23%) WAN
5 1 (0.62%) VSAN
Database & Business Intelligence
1 23 (14.20%) Elasticsearch
2 14 (8.64%) DynamoDB
3 13 (8.02%) PostgreSQL
3 13 (8.02%) Redis
4 11 (6.79%) Amazon RDS
5 9 (5.56%) SQL Server
6 8 (4.94%) NoSQL
6 8 (4.94%) Power BI
7 5 (3.09%) Big Data
7 5 (3.09%) Tableau
8 4 (2.47%) Data Lake
8 4 (2.47%) Data Warehouse
9 2 (1.23%) Azure SQL Data Warehouse
9 2 (1.23%) Azure SQL Database
9 2 (1.23%) Flink
9 2 (1.23%) Geospatial Data
9 2 (1.23%) Hadoop
9 2 (1.23%) MongoDB
9 2 (1.23%) Relational Database
10 1 (0.62%) SQL Server Integration Services
Development Applications
1 32 (19.75%) Git
2 23 (14.20%) Jenkins
3 8 (4.94%) JIRA
3 8 (4.94%) JUnit
3 8 (4.94%) NUnit
3 8 (4.94%) SonarQube
4 5 (3.09%) Appium
4 5 (3.09%) Cucumber
5 4 (2.47%) Mocha
5 4 (2.47%) TeamCity
5 4 (2.47%) webpack
6 2 (1.23%) Ant
6 2 (1.23%) Babel
6 2 (1.23%) ESLint
6 2 (1.23%) Octopus Deploy
6 2 (1.23%) Oracle Forms
6 2 (1.23%) Sinon.JS
6 2 (1.23%) Sonatype Nexus
7 1 (0.62%) Karma Test Runner
7 1 (0.62%) Visual Studio
General
1 46 (28.40%) Social Skills
2 23 (14.20%) Inclusion and Diversity
2 23 (14.20%) Law
3 20 (12.35%) Finance
4 19 (11.73%) Banking
5 17 (10.49%) Analytical Skills
5 17 (10.49%) Publishing
5 17 (10.49%) Telecoms
6 12 (7.41%) Health Technology
6 12 (7.41%) Legal
6 12 (7.41%) Tech for Good
7 11 (6.79%) Marketing
8 10 (6.17%) Public Sector
9 4 (2.47%) Influencing Skills
10 2 (1.23%) Agriculture
10 2 (1.23%) Front Office
10 2 (1.23%) Retail
11 1 (0.62%) Advertising
11 1 (0.62%) Electronics
11 1 (0.62%) Games
Job Titles
1 65 (40.12%) Senior
2 42 (25.93%) Developer
3 22 (13.58%) Senior Developer
4 21 (12.96%) Cloud Engineer
5 17 (10.49%) Senior Cloud Engineer
6 13 (8.02%) DevOps Engineer
6 13 (8.02%) Lead
7 12 (7.41%) Site Engineer
7 12 (7.41%) Site Reliability Engineer
7 12 (7.41%) Software Engineer
8 11 (6.79%) C# Developer
8 11 (6.79%) Java Engineer
9 10 (6.17%) Architect
10 9 (5.56%) Consultant
10 9 (5.56%) Cybersecurity Engineer
10 9 (5.56%) Infrastructure Engineer
10 9 (5.56%) Infrastructure Security Engineer
10 9 (5.56%) Java Software Engineer
10 9 (5.56%) Security Engineer
10 9 (5.56%) Software Developer
Libraries, Frameworks & Software Standards
1 31 (19.14%) React
2 29 (17.90%) Node.js
3 28 (17.28%) .NET
4 20 (12.35%) RESTful
5 15 (9.26%) Jest
6 14 (8.64%) Swagger
7 11 (6.79%) Django
7 11 (6.79%) REST
8 10 (6.17%) ARM Templates
9 9 (5.56%) .NET Core
9 9 (5.56%) Spring
10 8 (4.94%) Azure Blueprints
10 8 (4.94%) Kafka
11 6 (3.70%) .NET Framework
11 6 (3.70%) Android Jetpack
11 6 (3.70%) Jetpack Compose
11 6 (3.70%) Middleware
11 6 (3.70%) OpenTelemetry
11 6 (3.70%) Web Services
12 5 (3.09%) Gherkin
Miscellaneous
1 25 (15.43%) Management Information System
2 17 (10.49%) Public Cloud
3 10 (6.17%) Distributed Systems
3 10 (6.17%) Private Cloud
4 9 (5.56%) Cyber Security Posture
4 9 (5.56%) Mobile App
4 9 (5.56%) Security Posture
5 8 (4.94%) Onboarding
6 7 (4.32%) Cloud Native
7 6 (3.70%) Self-Motivation
8 5 (3.09%) Product Ownership
9 3 (1.85%) Analytical Mindset
9 3 (1.85%) Enterprise Software
10 2 (1.23%) Clustering
10 2 (1.23%) Data Structures
10 2 (1.23%) Hackathon
10 2 (1.23%) IoT
10 2 (1.23%) Legacy Applications
10 2 (1.23%) Online Banking
10 2 (1.23%) Replication
Operating Systems
1 31 (19.14%) Linux
2 19 (11.73%) Windows
3 11 (6.79%) Android
3 11 (6.79%) Unix
4 9 (5.56%) Apple iOS
5 2 (1.23%) Solaris
6 1 (0.62%) VMS
Processes & Methodologies
1 114 (70.37%) DevOps
2 102 (62.96%) CI/CD
3 81 (50.00%) Continuous Integration
4 65 (40.12%) Agile
5 47 (29.01%) Software Engineering
6 45 (27.78%) Containerisation
7 39 (24.07%) Deployment Automation
8 38 (23.46%) Microservices
9 36 (22.22%) Infrastructure as Code
10 35 (21.60%) Continuous Improvement
10 35 (21.60%) Mentoring
11 34 (20.99%) Problem-Solving
12 32 (19.75%) TDD
13 28 (17.28%) Performance Monitoring
13 28 (17.28%) Scrum
14 26 (16.05%) Roadmaps
15 25 (15.43%) Analytics
16 24 (14.81%) Clean Code
17 23 (14.20%) Test Automation
18 22 (13.58%) High Availability
Programming Languages
1 47 (29.01%) Python
2 25 (15.43%) Java
3 23 (14.20%) C#
4 20 (12.35%) TypeScript
5 19 (11.73%) JavaScript
6 13 (8.02%) SQL
7 4 (2.47%) Swift
8 2 (1.23%) Go
8 2 (1.23%) PowerShell
8 2 (1.23%) Scala
9 1 (0.62%) Groovy
Qualifications
1 33 (20.37%) Security Cleared
2 26 (16.05%) Degree
3 22 (13.58%) SC Cleared
4 8 (4.94%) BPSS Clearance
5 5 (3.09%) CSPO
6 2 (1.23%) Computer Science Degree
6 2 (1.23%) Master's Degree
7 1 (0.62%) AWS Certification
7 1 (0.62%) MCSE
7 1 (0.62%) Microsoft Certification
7 1 (0.62%) Postgraduate
7 1 (0.62%) VMware Certified Professional (VCP)
Quality Assurance & Compliance
1 25 (15.43%) QA
2 10 (6.17%) NIST
3 9 (5.56%) Accessibility
3 9 (5.56%) GDPR
3 9 (5.56%) ISO/IEC 27001
3 9 (5.56%) NCSC
4 1 (0.62%) Cyber Essentials
System Software
1 43 (26.54%) Docker
2 3 (1.85%) VMware Infrastructure
3 2 (1.23%) Active Directory
3 2 (1.23%) Hyper-V
3 2 (1.23%) KVM
3 2 (1.23%) NFS
3 2 (1.23%) SRDF
3 2 (1.23%) Veritas Cluster Server
3 2 (1.23%) Xen
4 1 (0.62%) VMware NSX
Systems Management
1 62 (38.27%) Kubernetes
2 44 (27.16%) Terraform
3 29 (17.90%) Ansible
4 11 (6.79%) AWS Copilot
5 6 (3.70%) Prometheus
6 2 (1.23%) Puppet
7 1 (0.62%) Argo
7 1 (0.62%) Consul
7 1 (0.62%) Packer
Vendors
1 16 (9.88%) Google
1 16 (9.88%) Oracle
2 14 (8.64%) Microsoft
3 8 (4.94%) Okta
4 6 (3.70%) Dynatrace
5 4 (2.47%) Avaloq
6 3 (1.85%) Cisco
6 3 (1.85%) Databricks
6 3 (1.85%) VMware
7 2 (1.23%) EMC
7 2 (1.23%) F5
7 2 (1.23%) NetApp
7 2 (1.23%) Teradata
8 1 (0.62%) Palo Alto
8 1 (0.62%) Sun