Product Management Job Trends

Product Management
UK

The table below provides summary statistics and salary benchmarking for jobs requiring Product Management skills. It covers vacancies from the 6 months leading up to 18 September 2025, with comparisons to the same periods in the previous two years.

6 months to
18 Sep 2025
Same period 2024 Same period 2023
Rank 244 317 312
Rank change year-on-year +73 -5 -156
Permanent jobs citing Product Management 627 671 618
As % of all permanent jobs advertised in the UK 1.27% 0.86% 1.03%
As % of the Processes & Methodologies category 1.43% 1.06% 1.09%
Number of salaries quoted 279 329 474
10th Percentile £43,297 £42,300 £46,250
25th Percentile £57,250 £53,750 £60,000
Median annual salary (50th Percentile) £70,047 £70,000 £68,250
Median % change year-on-year +0.07% +2.56% -2.50%
75th Percentile £87,500 £88,750 £80,070
90th Percentile £117,500 £107,500 £107,500
UK excluding London median annual salary £62,500 £61,000 £65,000
% change year-on-year +2.46% -6.15% +13.04%

All Process and Methodology Skills
UK

Product Management falls under the Processes and Methodologies category. For comparison with the information above, the following table provides summary statistics for all permanent job vacancies requiring process or methodology skills.

Permanent vacancies with a requirement for process or methodology skills 43,869 63,416 56,859
As % of all permanent jobs advertised in the UK 88.70% 81.19% 94.35%
Number of salaries quoted 24,728 36,039 42,828
10th Percentile £28,500 £32,000 £32,750
25th Percentile £36,250 £42,500 £45,000
Median annual salary (50th Percentile) £55,000 £57,500 £60,000
Median % change year-on-year -4.35% -4.17% -
75th Percentile £75,000 £77,500 £80,000
90th Percentile £96,250 £95,000 £100,000
UK excluding London median annual salary £47,500 £52,500 £54,000
% change year-on-year -9.52% -2.78% +2.86%

Product Management
Job Vacancy Trend

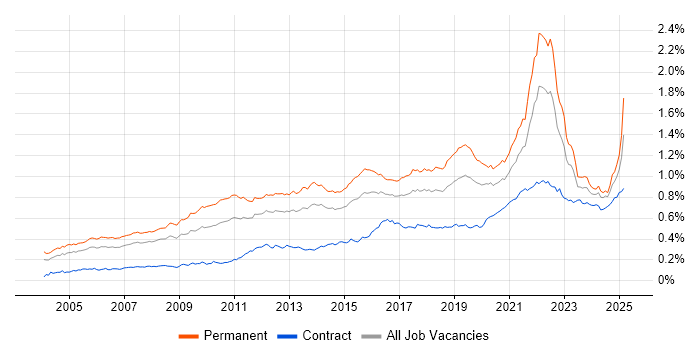
Job postings citing Product Management as a proportion of all IT jobs advertised.

Job vacancy trend for Product Management in the UK

Product Management
Salary Trend

Salary distribution trend for jobs in the UK citing Product Management.

Salary distribution trend for jobs in the UK citing Product Management

Product Management
Salary Histogram

Salary distribution for jobs citing Product Management over the 6 months to 18 September 2025.

Salary histogram for Product Management in the UK

Product Management
Top 17 Job Locations

The table below looks at the demand and provides a guide to the median salaries quoted in IT jobs citing Product Management within the UK over the 6 months to 18 September 2025. The 'Rank Change' column provides an indication of the change in demand within each location based on the same 6 month period last year.

Location Rank Change
on Same Period
Last Year
Matching
Permanent
IT Job Ads
Median Salary
Past 6 Months
Median Salary
% Change
on Same Period
Last Year
Live
Jobs
England +59 569 £70,047 +0.07% 636
London +102 291 £80,000 -3.41% 377
UK excluding London +22 288 £62,500 +2.46% 381
Work from Home +2 173 £70,000 - 294
South East +80 134 £62,500 -3.85% 195
North of England -11 40 £70,000 +3.70% 86
East of England -3 32 £65,500 +19.09% 15
Midlands -7 32 £60,250 -0.41% 40
South West +27 28 £56,745 +5.57% 19
West Midlands +12 21 £57,468 -3.76% 27
Yorkshire +24 20 £75,000 +11.11% 25
North West -15 19 £67,500 +2.27% 56
Scotland +28 12 £52,500 -11.66% 13
East Midlands +5 9 £75,000 +7.14% 12
Northern Ireland +13 6 - - 3
Wales +13 4 £59,857 -6.63% 12
North East +15 1 - - 5

Product Management
Co-occurring Skills and Capabilities by Category

The follow tables expand on the table above by listing co-occurrences grouped by category. The same employment type, locality and period is covered with up to 20 co-occurrences shown in each of the following categories:

Application Platforms
1 19 (3.03%) Confluence
2 5 (0.80%) CMS
2 5 (0.80%) SharePoint
3 4 (0.64%) WordPress
4 2 (0.32%) Microsoft Exchange
5 1 (0.16%) Apache Airflow
5 1 (0.16%) ColdFusion
5 1 (0.16%) Mule
Applications
1 18 (2.87%) Microsoft Excel
2 15 (2.39%) Microsoft Office
3 13 (2.07%) Microsoft PowerPoint
4 4 (0.64%) MS Visio
5 3 (0.48%) Microsoft Project
6 2 (0.32%) Trello
7 1 (0.16%) Chatbot
7 1 (0.16%) Spreadsheet
Business Applications
1 13 (2.07%) Dynamics CRM
2 10 (1.59%) Payment Gateway
3 9 (1.44%) Shopify
4 7 (1.12%) SAP S/4HANA
5 5 (0.80%) Maximo
6 1 (0.16%) CiviCRM
6 1 (0.16%) Oracle ERP
6 1 (0.16%) Salesforce CRM
6 1 (0.16%) Sparx Enterprise Architect
Cloud Services
1 111 (17.70%) Azure
2 92 (14.67%) SaaS
3 82 (13.08%) AWS
4 53 (8.45%) GCP
5 39 (6.22%) Vertex AI
6 32 (5.10%) Azure DevOps
7 31 (4.94%) PaaS
8 22 (3.51%) Azure AI
9 14 (2.23%) GitHub
10 12 (1.91%) Power Platform
10 12 (1.91%) Serverless
11 9 (1.44%) Dynamics 365
11 9 (1.44%) GitHub Actions
11 9 (1.44%) H2O.ai
11 9 (1.44%) OpenShift
12 7 (1.12%) Azure Machine Learning
12 7 (1.12%) Google Analytics
13 6 (0.96%) AWS Lambda
13 6 (0.96%) Microsoft 365
13 6 (0.96%) Snowflake
Communications & Networking
1 20 (3.19%) Broadband
2 11 (1.75%) 5G
3 9 (1.44%) WAN
4 7 (1.12%) Network Security
4 7 (1.12%) PSTN
5 6 (0.96%) DNS
6 5 (0.80%) Kerberos
6 5 (0.80%) LAN
6 5 (0.80%) SAN
6 5 (0.80%) SD-WAN
7 4 (0.64%) Ethernet
7 4 (0.64%) Wireless
8 2 (0.32%) Firewall
8 2 (0.32%) GPRS
8 2 (0.32%) LTE
8 2 (0.32%) Modbus
8 2 (0.32%) Multicast
8 2 (0.32%) Software-Defined Networking
8 2 (0.32%) VPN
8 2 (0.32%) Wi-Fi
Database & Business Intelligence
1 26 (4.15%) Data Mining
2 23 (3.67%) NoSQL
2 23 (3.67%) PostgreSQL
2 23 (3.67%) Relational Database
3 16 (2.55%) RDBMS
4 12 (1.91%) SQL Server
5 11 (1.75%) Metadata
6 9 (1.44%) Data Lake
6 9 (1.44%) MongoDB
7 8 (1.28%) KDB
7 8 (1.28%) Kdb+
8 7 (1.12%) Power BI
9 5 (0.80%) SAP HANA
10 4 (0.64%) Amazon Athena
11 2 (0.32%) DB2
11 2 (0.32%) Electronic Patient Records
11 2 (0.32%) SQL Server Reporting Services
12 1 (0.16%) Data Warehouse
12 1 (0.16%) GIS
12 1 (0.16%) MySQL
Development Applications
1 43 (6.86%) JIRA
2 8 (1.28%) TeamCity
3 5 (0.80%) Jenkins
3 5 (0.80%) Spinnaker
4 4 (0.64%) Atlassian Bamboo
4 4 (0.64%) YouTrack
5 3 (0.48%) Git
6 2 (0.32%) Bazaar
6 2 (0.32%) Jaeger
7 1 (0.16%) ER Studio
7 1 (0.16%) ERwin
7 1 (0.16%) Selenium
7 1 (0.16%) Subversion
7 1 (0.16%) WebDriver
General
1 283 (45.14%) Social Skills
2 184 (29.35%) Finance
3 151 (24.08%) Law
4 143 (22.81%) Analytical Skills
5 139 (22.17%) Marketing
6 64 (10.21%) Retail
7 53 (8.45%) Inclusion and Diversity
8 48 (7.66%) Legal
9 46 (7.34%) Electronics
10 37 (5.90%) Presentation Skills
11 34 (5.42%) Banking
12 33 (5.26%) Manufacturing
12 33 (5.26%) Public Sector
13 27 (4.31%) Telecoms
14 24 (3.83%) Influencing Skills
15 21 (3.35%) Financial Institution
16 13 (2.07%) Billing
17 11 (1.75%) Organisational Skills
18 9 (1.44%) Front Office
18 9 (1.44%) Games
Job Titles
1 164 (26.16%) Product Manager
2 153 (24.40%) Lead
3 110 (17.54%) Senior
4 48 (7.66%) Architect
5 47 (7.50%) Senior Manager
6 32 (5.10%) Senior Product Manager
7 31 (4.94%) Product Owner
8 22 (3.51%) Developer
8 22 (3.51%) Solutions Architect
9 19 (3.03%) Security Engineer
10 16 (2.55%) Product Delivery Manager
11 15 (2.39%) Managed Services Architect
11 15 (2.39%) Product Lead
12 14 (2.23%) E-Commerce Manager
12 14 (2.23%) Software Engineer
13 13 (2.07%) Analyst
13 13 (2.07%) Lead Software Engineer
14 12 (1.91%) Python Developer
14 12 (1.91%) Python Engineer
14 12 (1.91%) Python Software Engineer
Libraries, Frameworks & Software Standards
1 19 (3.03%) YAML
2 16 (2.55%) Flask
3 15 (2.39%) REST
4 13 (2.07%) Node.js
5 10 (1.59%) FastAPI
5 10 (1.59%) Kafka
6 9 (1.44%) .NET
6 9 (1.44%) EDI
6 9 (1.44%) Keras
6 9 (1.44%) PyTorch
6 9 (1.44%) TensorFlow
7 7 (1.12%) Elastic Stack
7 7 (1.12%) React
8 6 (0.96%) RESTful
9 5 (0.80%) AngularJS
9 5 (0.80%) Django
9 5 (0.80%) Express.js
9 5 (0.80%) JSON
9 5 (0.80%) WebSockets
9 5 (0.80%) XML
Miscellaneous
1 98 (15.63%) Product Ownership
2 38 (6.06%) Onboarding
3 34 (5.42%) Management Information System
4 33 (5.26%) Self-Motivation
5 27 (4.31%) Algorithms
6 25 (3.99%) Enterprise Software
7 21 (3.35%) Security Posture
8 20 (3.19%) Cloud Native
9 18 (2.87%) Data Centre
10 17 (2.71%) AI Agents
11 16 (2.55%) Mobile App
12 11 (1.75%) Analytical Mindset
12 11 (1.75%) Public Cloud
12 11 (1.75%) Social Media
13 9 (1.44%) Driving Licence
13 9 (1.44%) Virtual Team
14 8 (1.28%) Derivative
14 8 (1.28%) PMI
15 6 (0.96%) NHS
15 6 (0.96%) Video\Live Streaming
Operating Systems
1 12 (1.91%) Windows
2 10 (1.59%) Linux
3 5 (0.80%) Windows Server 2019
4 3 (0.48%) Android
4 3 (0.48%) Apple iOS
4 3 (0.48%) Red Hat Enterprise Linux
5 2 (0.32%) AIX
5 2 (0.32%) Unix
5 2 (0.32%) Windows 10
5 2 (0.32%) Windows Server
5 2 (0.32%) Windows Server 2012
5 2 (0.32%) Windows Server 2016
6 1 (0.16%) CentOS
6 1 (0.16%) Debian
Processes & Methodologies
1 295 (47.05%) Roadmaps
2 284 (45.30%) Agile
3 193 (30.78%) Problem-Solving
4 148 (23.60%) Analytics
5 127 (20.26%) Computer Science
6 126 (20.10%) Product Strategy
7 118 (18.82%) DevOps
8 115 (18.34%) Product Roadmap
9 110 (17.54%) Artificial Intelligence
10 89 (14.19%) Continuous Improvement
11 81 (12.92%) Machine Learning
11 81 (12.92%) User Experience
12 79 (12.60%) CI/CD
12 79 (12.60%) Use Case
13 78 (12.44%) Strategic Thinking
14 77 (12.28%) Mentoring
14 77 (12.28%) Stakeholder Management
15 75 (11.96%) Customer-Centricity
15 75 (11.96%) Data Science
16 72 (11.48%) Decision-Making
Programming Languages
1 43 (6.86%) Python
2 42 (6.70%) SQL
3 22 (3.51%) Java
3 22 (3.51%) PowerShell
4 9 (1.44%) JavaScript
5 8 (1.28%) C#
5 8 (1.28%) TypeScript
6 5 (0.80%) Go
7 3 (0.48%) Bash
7 3 (0.48%) C++
8 2 (0.32%) Scala
9 1 (0.16%) Groovy
9 1 (0.16%) Kotlin
9 1 (0.16%) PHP
9 1 (0.16%) SHACL
9 1 (0.16%) XQuery
Qualifications
1 200 (31.90%) Degree
2 71 (11.32%) Computer Science Degree
3 40 (6.38%) Master's Degree
4 27 (4.31%) Security Cleared
5 20 (3.19%) SC Cleared
6 18 (2.87%) AWS Certification
7 14 (2.23%) Azure Certification
8 11 (1.75%) CSPO
9 9 (1.44%) DV Cleared
10 8 (1.28%) PMI Certification
11 7 (1.12%) AWS Certified Solutions Architect
12 6 (0.96%) MBA
13 5 (0.80%) ITIL Certification
14 4 (0.64%) AWS Certified DevOps Engineer
14 4 (0.64%) CISSP
14 4 (0.64%) Microsoft Certification
15 3 (0.48%) CISM
15 3 (0.48%) CITP
15 3 (0.48%) Dell Certification
15 3 (0.48%) MCSA
Quality Assurance & Compliance
1 37 (5.90%) QA
2 32 (5.10%) ISO/IEC 27001
3 24 (3.83%) NIST
4 19 (3.03%) NCSC
5 18 (2.87%) SLA
6 17 (2.71%) GDPR
7 15 (2.39%) Accessibility
8 12 (1.91%) Data Quality
9 8 (1.28%) PMO
10 6 (0.96%) HIPAA
11 5 (0.80%) SEPA
12 4 (0.64%) 21 CFR Part 11
12 4 (0.64%) Good Clinical Practice
12 4 (0.64%) ISO 20022
12 4 (0.64%) ISO 8583
12 4 (0.64%) PCI DSS
13 3 (0.48%) PMBOK
13 3 (0.48%) PSD2
13 3 (0.48%) SOC 2
14 1 (0.16%) ISO/IEC 42001
System Software
1 27 (4.31%) Docker
2 8 (1.28%) Active Directory
3 7 (1.12%) Virtual Machines
3 7 (1.12%) VMware Infrastructure
3 7 (1.12%) vSphere
4 5 (0.80%) Hyper-V
5 3 (0.48%) VMware ESXi
6 2 (0.32%) Firmware
Systems Management
1 32 (5.10%) Kubernetes
2 28 (4.47%) Terraform
3 11 (1.75%) Ansible
4 7 (1.12%) Prometheus
4 7 (1.12%) Puppet
5 6 (0.96%) Grafana
6 4 (0.64%) Salt
6 4 (0.64%) Single Sign-On
7 3 (0.48%) WSUS
8 2 (0.32%) Argo
8 2 (0.32%) Kustomize
9 1 (0.16%) CSIRT
9 1 (0.16%) Progress Chef
Vendors
1 101 (16.11%) Microsoft
2 66 (10.53%) Google
3 29 (4.63%) Databricks
4 27 (4.31%) SAP
5 24 (3.83%) OpenAI
6 23 (3.67%) Foundry
7 19 (3.03%) Salesforce
8 16 (2.55%) Oracle
9 12 (1.91%) Dell
10 9 (1.44%) NVIDIA
11 8 (1.28%) VMware
12 6 (0.96%) Zoho
13 5 (0.80%) Cisco
13 5 (0.80%) Hotjar
13 5 (0.80%) Manugistics
14 4 (0.64%) Ahrefs
14 4 (0.64%) Red Hat
14 4 (0.64%) Vertica
14 4 (0.64%) WooCommerce
15 3 (0.48%) Juniper