IBM Jobs with Hybrid/Remote/WFH Options

IBM
UK > Work from Home

The table below provides summary statistics for permanent remote or hybrid work requiring knowledge or experience of IBM products and/or services. It includes a benchmarking guide to the annual salaries offered in vacancies that cited IBM over the 6 months leading up to 5 May 2025, comparing them to the same period in the previous two years.

The figures below represent the IT labour market in general and are not representative of salaries within the International Business Machines Corporation.

6 months to
5 May 2025
Same period 2024 Same period 2023
Rank 166 320 373
Rank change year-on-year +154 +53 -5
Permanent jobs citing IBM 312 310 323
As % of all permanent jobs with a WFH option 2.02% 0.92% 0.76%
As % of the Vendors category 4.48% 2.21% 1.89%
Number of salaries quoted 277 270 195
10th Percentile £49,500 £38,750 £42,250
25th Percentile £57,500 £48,500 £51,634
Median annual salary (50th Percentile) £70,600 £62,500 £62,500
Median % change year-on-year +12.96% - -
75th Percentile - £77,500 £76,385
90th Percentile £75,144 £91,934 £88,250
UK median annual salary £62,000 £60,000 £60,000
% change year-on-year +3.33% - -

All Vendors
Work from Home

IBM falls under the Vendor Products and Services category. For comparison with the information above, the following table provides summary statistics for all permanent job vacancies with a remote or hybrid options requiring knowledge or experience of all vendor products and services.

Permanent vacancies with a requirement for knowledge or experience of vendor products and services 6,972 14,043 17,099
As % of all permanent jobs with a WFH option 45.22% 41.56% 40.34%
Number of salaries quoted 4,482 10,036 11,377
10th Percentile £25,087 £31,250 £32,500
25th Percentile £37,170 £41,250 £43,697
Median annual salary (50th Percentile) £57,000 £55,000 £59,191
Median % change year-on-year +3.64% -7.08% +2.94%
75th Percentile £72,500 £71,250 £77,500
90th Percentile £93,775 £87,500 £92,500
UK median annual salary £55,000 £50,000 £57,500
% change year-on-year +10.00% -13.04% +4.55%

IBM
Trend for Jobs with a WFH Option

Job vacancies with remote working options citing IBM as a proportion of all IT jobs advertised.
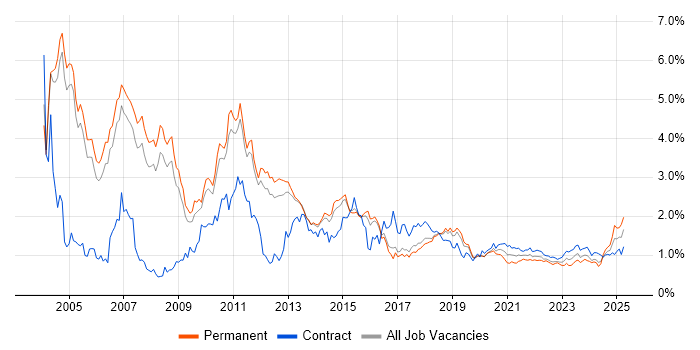
IBM trend for jobs with Hybrid/Remote/WFH options

IBM
Salary Trend for Jobs with a WFH Option

3-month moving average salary quoted in job vacancies with remote working options citing IBM.

IBM salary trend for jobs with a WFH option

IBM
Salary Histogram for Jobs with a WFH Option

Salary distribution for jobs with remote working options citing IBM over the 6 months to 5 May 2025.

IBM salary histogram for jobs with a WFH option

IBM
Co-occurring Skills and Capabilities with WFH Options by Category

The follow tables expand on the table above by listing co-occurrences grouped by category. The same employment type, locality and period is covered with up to 20 co-occurrences shown in each of the following categories:

Application Platforms
1 6 (1.92%) Apache
2 5 (1.60%) NetWeaver
2 5 (1.60%) Tomcat
3 4 (1.28%) Apache Airflow
3 4 (1.28%) IBM Domino
4 3 (0.96%) CICS
4 3 (0.96%) Confluence
5 2 (0.64%) SAS
6 1 (0.32%) Microsoft Exchange
6 1 (0.32%) Oracle SOA Suite
6 1 (0.32%) SharePoint
Applications
1 5 (1.60%) Microsoft Office
2 3 (0.96%) Microsoft Excel
3 1 (0.32%) Microsoft PowerPoint
Business Applications
1 6 (1.92%) IBM Planning Analytics
2 5 (1.60%) Oracle Subledger Accounting
3 3 (0.96%) SAP S/4HANA
4 2 (0.64%) SAP Oil and Gas
5 1 (0.32%) Dynamics CRM
Cloud Services
1 70 (22.44%) Azure
2 62 (19.87%) AWS
3 24 (7.69%) SaaS
4 18 (5.77%) Serverless
5 16 (5.13%) Amazon EC2
5 16 (5.13%) Amazon EKS
5 16 (5.13%) Amazon S3
5 16 (5.13%) AWS Lambda
6 13 (4.17%) Datadog
7 11 (3.53%) GCP
7 11 (3.53%) PaaS
8 8 (2.56%) Power Platform
9 7 (2.24%) GitHub
9 7 (2.24%) IBM Cloud
10 6 (1.92%) Apigee
10 6 (1.92%) Azure DevOps
11 5 (1.60%) IaaS
12 4 (1.28%) CloudBees
12 4 (1.28%) Microsoft 365
13 3 (0.96%) Azure Event Grid
Communications & Networking
1 7 (2.24%) DNS
2 6 (1.92%) Multicast
3 5 (1.60%) SAN
4 4 (1.28%) Firewall
4 4 (1.28%) TCP/IP
5 3 (0.96%) HTTPS
5 3 (0.96%) LAN
6 2 (0.64%) DHCP
6 2 (0.64%) FTP
6 2 (0.64%) HTTP
6 2 (0.64%) SNA
6 2 (0.64%) SSH
6 2 (0.64%) SSL
6 2 (0.64%) WAN
6 2 (0.64%) Wireless
7 1 (0.32%) GSM
7 1 (0.32%) Unified Communications
Database & Business Intelligence
1 22 (7.05%) NoSQL
2 19 (6.09%) SQL Server
3 11 (3.53%) DB2
4 8 (2.56%) Power BI
5 6 (1.92%) Oracle Reports
6 5 (1.60%) BusinessObjects
6 5 (1.60%) SAP BW
6 5 (1.60%) SAP Data Services
6 5 (1.60%) SAP HANA
7 4 (1.28%) MongoDB
7 4 (1.28%) SQL Server Integration Services
7 4 (1.28%) SQL Server Reporting Services
8 3 (0.96%) Oracle BI Publisher
8 3 (0.96%) PostgreSQL
8 3 (0.96%) Relational Database
9 2 (0.64%) Data Lake
9 2 (0.64%) MySQL
10 1 (0.32%) Data Warehouse
10 1 (0.32%) MS Access
10 1 (0.32%) Snowflake Schema
Development Applications
1 158 (50.64%) Rational DOORS
2 35 (11.22%) IntelliJ
2 35 (11.22%) JUnit
2 35 (11.22%) Mockito
3 27 (8.65%) Git
4 26 (8.33%) Jenkins
5 22 (7.05%) Eclipse
5 22 (7.05%) Jasmine
5 22 (7.05%) Karma Test Runner
5 22 (7.05%) Protractor
6 16 (5.13%) Cucumber
7 14 (4.49%) GitLab
8 13 (4.17%) Maven
9 6 (1.92%) JIRA
9 6 (1.92%) SonarQube
10 5 (1.60%) Oracle Forms
11 4 (1.28%) NUnit
11 4 (1.28%) Octopus Deploy
11 4 (1.28%) Team Foundation Server
11 4 (1.28%) TeamCity
General
1 158 (50.64%) Electronics
2 71 (22.76%) Finance
3 54 (17.31%) Banking
4 36 (11.54%) Social Skills
5 18 (5.77%) Legal
6 17 (5.45%) Analytical Skills
7 6 (1.92%) Manufacturing
8 5 (1.60%) General Ledger
9 4 (1.28%) Inclusion and Diversity
9 4 (1.28%) Investment Banking
10 3 (0.96%) Influencing Skills
10 3 (0.96%) Presentation Skills
10 3 (0.96%) Retail
11 1 (0.32%) Aerospace
11 1 (0.32%) Automotive
11 1 (0.32%) Cantonese Language
11 1 (0.32%) Law
11 1 (0.32%) Marketing
Job Titles
1 162 (51.92%) Systems Engineer
2 158 (50.64%) Principal Engineer
2 158 (50.64%) Principal Systems Engineer
3 45 (14.42%) Senior
4 44 (14.10%) Developer
5 35 (11.22%) Java Developer
6 19 (6.09%) SaaS Developer
7 18 (5.77%) Architect
8 17 (5.45%) Graduate
8 17 (5.45%) Senior DevOps
8 17 (5.45%) Solutions Architect
9 16 (5.13%) AWS DevOps
9 16 (5.13%) Backend Developer
10 15 (4.81%) Senior Developer
11 14 (4.49%) Radar Engineer
12 13 (4.17%) AWS Developer
12 13 (4.17%) DevOps Developer
12 13 (4.17%) Java Pricing Developer
12 13 (4.17%) Pricing Developer
12 13 (4.17%) Senior Java Developer
Libraries, Frameworks & Software Standards
1 33 (10.58%) AngularJS
2 28 (8.97%) React
3 25 (8.01%) RabbitMQ
4 22 (7.05%) Hibernate
4 22 (7.05%) JPA
5 16 (5.13%) JMS
6 13 (4.17%) ActiveMQ
6 13 (4.17%) Spring
6 13 (4.17%) Spring Boot
7 11 (3.53%) JSON
8 9 (2.88%) SOAP
9 8 (2.56%) REST
10 7 (2.24%) IBM Integration Bus
10 7 (2.24%) Web Services
11 6 (1.92%) React Native
12 5 (1.60%) .NET
12 5 (1.60%) XML
13 4 (1.28%) .NET Framework
13 4 (1.28%) ISPF
13 4 (1.28%) jQuery
Miscellaneous
1 180 (57.69%) Algorithms
2 23 (7.37%) Management Information System
3 17 (5.45%) Hackathon
3 17 (5.45%) Learning Management System
3 17 (5.45%) Mobile App
4 16 (5.13%) Enterprise Software
5 13 (4.17%) Credit Derivative
6 10 (3.21%) Mainframe
6 10 (3.21%) Product Ownership
7 8 (2.56%) Cloud Native
7 8 (2.56%) Replication
7 8 (2.56%) Self-Motivation
8 7 (2.24%) Virtual Team
9 6 (1.92%) DataPower
10 5 (1.60%) Enterprise Storage
11 4 (1.28%) Data Centre
11 4 (1.28%) Distributed Systems
11 4 (1.28%) FMCG
12 3 (0.96%) Cyber Threat
12 3 (0.96%) IBM Mainframe
Operating Systems
1 57 (18.27%) Linux
2 14 (4.49%) Windows
3 13 (4.17%) zOS
4 9 (2.88%) Unix
5 7 (2.24%) AIX
5 7 (2.24%) Red Hat Enterprise Linux
5 7 (2.24%) Windows Server
6 6 (1.92%) Android
6 6 (1.92%) Apple iOS
6 6 (1.92%) Windows 10
6 6 (1.92%) Windows Server 2012
6 6 (1.92%) Windows Server 2016
6 6 (1.92%) Windows Server 2019
7 2 (0.64%) CentOS
7 2 (0.64%) Oracle Linux
Processes & Methodologies
1 163 (52.24%) Technical Leadership
2 158 (50.64%) Signal Processing
2 158 (50.64%) Systems Engineering
2 158 (50.64%) Test Planning
3 67 (21.47%) Agile
4 55 (17.63%) DevOps
5 51 (16.35%) Containerisation
6 45 (14.42%) Software Engineering
7 40 (12.82%) Microservices
8 29 (9.29%) Unit Testing
9 28 (8.97%) Analytics
10 25 (8.01%) Cybersecurity
10 25 (8.01%) Infrastructure as Code
11 24 (7.69%) CI/CD
12 23 (7.37%) Roadmaps
13 22 (7.05%) Problem-Solving
14 20 (6.41%) API Integration
14 20 (6.41%) Deployment Automation
15 19 (6.09%) API Development
15 19 (6.09%) Artificial Intelligence
Programming Languages
1 69 (22.12%) Java
2 40 (12.82%) SQL
3 29 (9.29%) Python
4 23 (7.37%) C#
4 23 (7.37%) JavaScript
5 17 (5.45%) Kotlin
6 16 (5.13%) C++
7 8 (2.56%) C
7 8 (2.56%) JCL
8 6 (1.92%) Groovy
9 5 (1.60%) Perl
10 4 (1.28%) PL/SQL
10 4 (1.28%) Shell Script
11 3 (0.96%) COBOL
12 2 (0.64%) AWK
12 2 (0.64%) Korn
12 2 (0.64%) PHP
13 1 (0.32%) ActionScript
13 1 (0.32%) RPG
13 1 (0.32%) XPath
Qualifications
1 158 (50.64%) BPSS Clearance
2 27 (8.65%) Degree
3 18 (5.77%) Master's Degree
4 17 (5.45%) PhD
5 3 (0.96%) OCP
5 3 (0.96%) Oracle Certification
5 3 (0.96%) Security Cleared
6 1 (0.32%) Computer Science Degree
Quality Assurance & Compliance
1 158 (50.64%) ISO/IEC 15288
2 6 (1.92%) Sarbanes-Oxley
3 5 (1.60%) QA
4 3 (0.96%) ISO/IEC 27001
5 1 (0.32%) Data Quality
5 1 (0.32%) GDPR
5 1 (0.32%) ISO 15022
5 1 (0.32%) ISO 20022
5 1 (0.32%) SLA
System Software
1 30 (9.62%) Docker
2 10 (3.21%) Active Directory
3 9 (2.88%) Hyper-V
4 4 (1.28%) VMware Infrastructure
5 3 (0.96%) VMware ESXi
6 2 (0.64%) KVM
6 2 (0.64%) Postfix
6 2 (0.64%) Sendmail
6 2 (0.64%) Time Sharing Option
7 1 (0.32%) EMC RecoverPoint
7 1 (0.32%) Job Entry Subsystem
Systems Management
1 23 (7.37%) Ansible
1 23 (7.37%) Terraform
2 6 (1.92%) Kubernetes
2 6 (1.92%) Tivoli Storage Manager
3 5 (1.60%) Grafana
3 5 (1.60%) Nessus
4 3 (0.96%) Argo
4 3 (0.96%) Istio
4 3 (0.96%) Packer
4 3 (0.96%) Progress Chef
4 3 (0.96%) Prometheus
4 3 (0.96%) vCenter Server
5 2 (0.64%) CA Endevor
5 2 (0.64%) MAINVIEW
5 2 (0.64%) Nagios
5 2 (0.64%) Tivoli NetView
6 1 (0.32%) Avamar
6 1 (0.32%) CA Service Virtualization
6 1 (0.32%) Microsoft Intune
6 1 (0.32%) NetBackup
Vendors
1 46 (14.74%) Microsoft
2 24 (7.69%) Google
2 24 (7.69%) Oracle
3 12 (3.85%) Cisco
4 11 (3.53%) SAP
5 8 (2.56%) VMware
6 7 (2.24%) Salesforce
7 6 (1.92%) Apple
7 6 (1.92%) Atlassian
8 5 (1.60%) IBM Sterling
9 4 (1.28%) AppDynamics
9 4 (1.28%) Dell
10 3 (0.96%) Concur
10 3 (0.96%) Dynatrace
10 3 (0.96%) Red Hat
11 2 (0.64%) BMC
11 2 (0.64%) Cognos
11 2 (0.64%) Databricks
11 2 (0.64%) HP
11 2 (0.64%) ServiceNow