Software Engineer Jobs with Hybrid/Remote/WFH Options

Software Engineer
UK > Work from Home

The median Software Engineer salary for remote or hybrid work is £75,000 per year, according to job vacancies posted during the 6 months leading to 2 May 2025.

The table below provides salary benchmarking and summary statistics, comparing them to the same period in the previous two years.

6 months to
2 May 2025
Same period 2024 Same period 2023
Rank 37 31 36
Rank change year-on-year -6 +5 -4
Permanent jobs requiring a Software Engineer 936 2,343 3,062
As % of all permanent jobs with a WFH option 6.25% 6.92% 7.17%
As % of the Job Titles category 6.90% 7.21% 7.46%
Number of salaries quoted 822 1,714 1,849
10th Percentile £47,500 £42,500 £43,750
25th Percentile £56,250 £48,750 £55,000
Median annual salary (50th Percentile) £75,000 £62,500 £72,000
Median % change year-on-year +20.00% -13.19% +10.77%
75th Percentile £110,000 £82,500 £92,500
90th Percentile £137,500 £112,500 £117,500
UK median annual salary £67,500 £60,000 £69,447
% change year-on-year +12.50% -13.60% +6.84%

All Permanent IT Job Vacancies
Work from Home

For comparison with the information above, the following table provides summary statistics for all permanent IT job vacancies with WFH or hybrid options. Most job vacancies include a discernible job title that can be normalized. As such, the figures in the second row provide an indication of the number of permanent jobs in our overall sample.

Permanent vacancies in Work from Home with a recognized job title 13,568 32,486 41,019
% of permanent jobs with a recognized job title 90.66% 95.98% 96.07%
Number of salaries quoted 9,888 24,950 29,138
10th Percentile £30,000 £33,116 £36,500
25th Percentile £43,750 £42,500 £47,250
Median annual salary (50th Percentile) £60,000 £56,451 £62,500
Median % change year-on-year +6.29% -9.68% +4.17%
75th Percentile £77,500 £75,000 £81,250
90th Percentile £100,000 £92,500 £100,000
UK median annual salary £57,500 £52,900 £60,000
% change year-on-year +8.70% -11.83% -

Software Engineer
Trend for Jobs with a WFH Option

Job vacancies with remote working options which featured Software Engineer in the job title as a proportion of all IT jobs advertised.
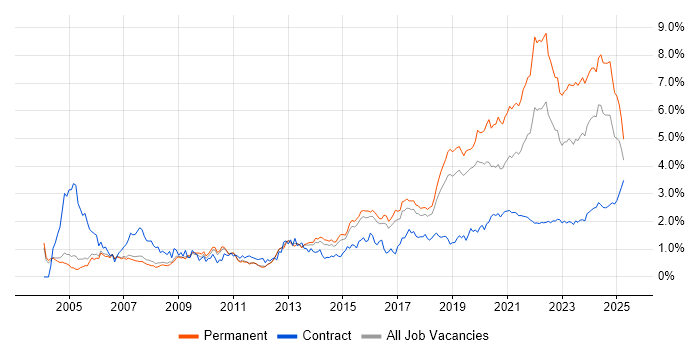
Software Engineer trend for jobs with Hybrid/Remote/WFH options

Software Engineer
Salary Trend for Jobs with a WFH Option

3-month moving average salary quoted in job vacancies with remote working options citing Software Engineer.

Software Engineer salary trend for jobs with a WFH option

Software Engineer
Salary Histogram for Jobs with a WFH Option

Salary distribution for jobs with remote working options citing Software Engineer over the 6 months to 2 May 2025.

Software Engineer salary histogram for jobs with a WFH option

Software Engineer Skill Set
Top 30 Co-occurring Skills and Capabilities in Job Vacancies with WFH Options

For the 6 months to 2 May 2025, Software Engineer job roles required the following skills and capabilities in order of popularity. The figures indicate the absolute number co-occurrences and as a proportion of all permanent jobs with hybrid or remote work options featuring Software Engineer in the job title.

1 930 (99.36%) Software Engineering
2 485 (51.82%) Agile
3 442 (47.22%) Python
4 402 (42.95%) Finance
5 392 (41.88%) AWS
6 379 (40.49%) JavaScript
7 312 (33.33%) Java
7 312 (33.33%) TypeScript
8 287 (30.66%) GCP
9 269 (28.74%) React
10 236 (25.21%) Banking
11 218 (23.29%) SQL
12 201 (21.47%) Azure
13 200 (21.37%) Front Office
14 199 (21.26%) C#
15 198 (21.15%) Fixed Income
16 191 (20.41%) Asset Management
17 181 (19.34%) DevOps
18 180 (19.23%) Degree
19 172 (18.38%) Node.js
20 166 (17.74%) CI/CD
21 162 (17.31%) Kubernetes
22 159 (16.99%) Microservices
23 153 (16.35%) Amazon Athena
24 151 (16.13%) TDD
25 150 (16.03%) Apache Airflow
26 147 (15.71%) dbt
27 146 (15.60%) Dremio
27 146 (15.60%) Apache Iceberg
27 146 (15.60%) Apache Arrow

Software Engineer Skill Set
Co-occurring Skills and Capabilities with WFH Options by Category

The follow tables expand on the table above by listing co-occurrences grouped by category. The same employment type, locality and period is covered with up to 20 co-occurrences shown in each of the following categories:

Application Platforms
1 150 (16.03%) Apache Airflow
2 111 (11.86%) Apache
3 27 (2.88%) Confluence
4 21 (2.24%) Apache Spark
5 5 (0.53%) CMS
6 3 (0.32%) Adobe Experience Manager
7 2 (0.21%) CICS
7 2 (0.21%) WebSphere
8 1 (0.11%) ColdFusion
8 1 (0.11%) Headless CMS
8 1 (0.11%) Solana
Applications
1 44 (4.70%) Chatbot
2 4 (0.43%) Microsoft Excel
3 3 (0.32%) Microsoft Office
3 3 (0.32%) Trello
4 2 (0.21%) Simulink
5 1 (0.11%) Microsoft PowerPoint
Business Applications
1 4 (0.43%) Q-Pulse
2 2 (0.21%) Oracle BPM
2 2 (0.21%) Oracle Subledger Accounting
3 1 (0.11%) BASE24
Cloud Services
1 392 (41.88%) AWS
2 287 (30.66%) GCP
3 201 (21.47%) Azure
4 147 (15.71%) dbt
5 86 (9.19%) Snowflake
6 60 (6.41%) GitHub
7 46 (4.91%) Amazon EC2
7 46 (4.91%) Amazon ECS
8 44 (4.70%) Amazon EKS
9 34 (3.63%) Dagster
10 33 (3.53%) SaaS
11 32 (3.42%) Serverless
12 26 (2.78%) AWS Lambda
13 23 (2.46%) Amazon S3
13 23 (2.46%) Azure DevOps
14 13 (1.39%) Apigee
14 13 (1.39%) Google Kubernetes Engine
15 11 (1.18%) GitHub Actions
16 9 (0.96%) Amazon CloudWatch
17 7 (0.75%) Slack
Communications & Networking
1 26 (2.78%) HTTP
2 25 (2.67%) Wireless
3 20 (2.14%) Bluetooth
4 10 (1.07%) RS-232
4 10 (1.07%) WAN
5 9 (0.96%) 5G
5 9 (0.96%) Modbus
5 9 (0.96%) ZigBee
6 8 (0.85%) SD-WAN
6 8 (0.85%) Wi-Fi
7 7 (0.75%) Profibus
7 7 (0.75%) RS-485
8 6 (0.64%) Software-Defined Radio
8 6 (0.64%) TCP/IP
9 5 (0.53%) Ethernet
10 4 (0.43%) Multicast
11 3 (0.32%) Internet
11 3 (0.32%) MQTT
12 2 (0.21%) DNS
12 2 (0.21%) Firewall
Database & Business Intelligence
1 153 (16.35%) Amazon Athena
2 146 (15.60%) Apache Arrow
2 146 (15.60%) Apache Iceberg
2 146 (15.60%) Dremio
3 115 (12.29%) PostgreSQL
4 94 (10.04%) Apache Ignite
5 72 (7.69%) Data Lake
6 50 (5.34%) NoSQL
7 44 (4.70%) SQL Server
8 37 (3.95%) MySQL
9 31 (3.31%) MongoDB
10 25 (2.67%) Relational Database
11 14 (1.50%) Redis
12 13 (1.39%) Azure SQL Database
13 10 (1.07%) Elasticsearch
14 8 (0.85%) Big Data
15 6 (0.64%) DynamoDB
16 5 (0.53%) Amazon RDS
17 4 (0.43%) Neo4j
17 4 (0.43%) SQL Server Analysis Services
Development Applications
1 123 (13.14%) Git
2 51 (5.45%) Jenkins
3 45 (4.81%) JIRA
4 25 (2.67%) GitLab
5 23 (2.46%) SonarQube
5 23 (2.46%) Visual Studio
6 18 (1.92%) Sonatype Nexus
7 17 (1.82%) webpack
8 15 (1.60%) Maven
9 14 (1.50%) JUnit
10 10 (1.07%) Cucumber
10 10 (1.07%) Moq
11 9 (0.96%) SpecFlow
12 8 (0.85%) Oracle Forms
13 5 (0.53%) Cypress.io
13 5 (0.53%) Subversion
13 5 (0.53%) Visual Studio Code
13 5 (0.53%) Xcode
13 5 (0.53%) XCUITest
14 3 (0.32%) XCTest
General
1 402 (42.95%) Finance
2 236 (25.21%) Banking
3 200 (21.37%) Front Office
4 130 (13.89%) Social Skills
5 86 (9.19%) Investment Banking
6 64 (6.84%) Games
7 55 (5.88%) Inclusion and Diversity
8 37 (3.95%) Retail
9 35 (3.74%) Electronics
10 34 (3.63%) Analytical Skills
11 28 (2.99%) Advertising
12 24 (2.56%) Manufacturing
13 21 (2.24%) Tech for Good
14 17 (1.82%) Automotive
15 16 (1.71%) Legal
16 14 (1.50%) Law
17 12 (1.28%) Influencing Skills
18 11 (1.18%) Military
18 11 (1.18%) Organisational Skills
18 11 (1.18%) Public Sector
Libraries, Frameworks & Software Standards
1 269 (28.74%) React
2 172 (18.38%) Node.js
3 141 (15.06%) .NET
4 131 (14.00%) Pandas
5 130 (13.89%) NumPy
5 130 (13.89%) SciPy
6 123 (13.14%) AngularJS
7 97 (10.36%) gRPC
8 94 (10.04%) Protocol Buffers
9 90 (9.62%) Vue
10 88 (9.40%) Spring
11 86 (9.19%) Redux
12 81 (8.65%) HTML
13 69 (7.37%) Spring Boot
14 55 (5.88%) Kafka
15 50 (5.34%) .NET Core
15 50 (5.34%) PySpark
15 50 (5.34%) RESTful
16 48 (5.13%) CSS
17 43 (4.59%) REST
Miscellaneous
1 198 (21.15%) Fixed Income
2 132 (14.10%) Foreign Exchange (FX)
3 127 (13.57%) Equities
4 101 (10.79%) Hedge funds
5 89 (9.51%) Derivative
6 78 (8.33%) Distributed Systems
7 72 (7.69%) Algorithms
8 43 (4.59%) Cloud Native
9 39 (4.17%) Product Ownership
10 37 (3.95%) Embedded Systems
11 36 (3.85%) Greenfield Project
11 36 (3.85%) Pricing Data
12 33 (3.53%) Public Cloud
13 26 (2.78%) Mobile App
14 23 (2.46%) IoT
15 16 (1.71%) Data Structures
16 15 (1.60%) Client/Server
17 11 (1.18%) GNSS
17 11 (1.18%) Robotics
18 9 (0.96%) Device Driver
Operating Systems
1 92 (9.83%) Linux
2 24 (2.56%) Unix
3 21 (2.24%) Windows
4 19 (2.03%) Apple iOS
5 14 (1.50%) Android
6 12 (1.28%) FreeRTOS
7 9 (0.96%) Robot Operating System
8 7 (0.75%) Ubuntu
9 5 (0.53%) Embedded Linux
10 2 (0.21%) Debian
10 2 (0.21%) zOS
11 1 (0.11%) CentOS
11 1 (0.11%) ThreadX
11 1 (0.11%) Windows Server
Processes & Methodologies
1 930 (99.36%) Software Engineering
2 485 (51.82%) Agile
3 191 (20.41%) Asset Management
4 181 (19.34%) DevOps
5 166 (17.74%) CI/CD
6 159 (16.99%) Microservices
7 151 (16.13%) TDD
8 146 (15.60%) Investment Management
9 145 (15.49%) Fintech
10 136 (14.53%) Mentoring
11 123 (13.14%) Test Automation
12 122 (13.03%) Computer Science
13 108 (11.54%) Problem-Solving
14 103 (11.00%) Full-Stack Development
15 94 (10.04%) SDLC
16 90 (9.62%) Artificial Intelligence
17 80 (8.55%) Code Quality
18 66 (7.05%) Machine Learning
19 64 (6.84%) Performance Attribution
19 64 (6.84%) User Experience
Programming Languages
1 442 (47.22%) Python
2 379 (40.49%) JavaScript
3 312 (33.33%) Java
3 312 (33.33%) TypeScript
4 218 (23.29%) SQL
5 199 (21.26%) C#
6 139 (14.85%) C++
7 97 (10.36%) C
8 49 (5.24%) Go
9 34 (3.63%) PHP
10 30 (3.21%) Scala
11 25 (2.67%) Ruby
12 24 (2.56%) Bash
13 22 (2.35%) Rust
14 19 (2.03%) Embedded C
15 13 (1.39%) Perl
15 13 (1.39%) PL/SQL
16 12 (1.28%) Kotlin
17 9 (0.96%) Fortran
17 9 (0.96%) Swift
Qualifications
1 180 (19.23%) Degree
2 52 (5.56%) Computer Science Degree
3 36 (3.85%) Security Cleared
4 33 (3.53%) Master's Degree
5 24 (2.56%) SC Cleared
6 13 (1.39%) PhD
7 12 (1.28%) Numerate Degree
8 11 (1.18%) DV Cleared
9 3 (0.32%) BPSS Clearance
9 3 (0.32%) HNC
10 2 (0.21%) AWS Certification
10 2 (0.21%) Azure Certification
10 2 (0.21%) Microsoft Certification
Quality Assurance & Compliance
1 45 (4.81%) QA
2 19 (2.03%) Accessibility
3 9 (0.96%) ISO/IEC 27001
4 8 (0.85%) PMO
5 5 (0.53%) CDISC
6 4 (0.43%) Data Quality
6 4 (0.43%) PCI DSS
6 4 (0.43%) SOC 2
7 3 (0.32%) IEC 61131
7 3 (0.32%) IEC 62304
7 3 (0.32%) MISRA
8 2 (0.21%) GDPR
8 2 (0.21%) ISO 9001
8 2 (0.21%) NIST
9 1 (0.11%) ISO 13485
System Software
1 126 (13.46%) Docker
2 15 (1.60%) Firmware
3 12 (1.28%) Embedded Firmware
4 1 (0.11%) Virtual Machines
Systems Management
1 162 (17.31%) Kubernetes
2 47 (5.02%) Terraform
3 13 (1.39%) Istio
4 6 (0.64%) Grafana
4 6 (0.64%) Kustomize
4 6 (0.64%) Prometheus
5 5 (0.53%) Ansible
6 3 (0.32%) CA Endevor
7 2 (0.21%) MAINVIEW
8 1 (0.11%) Argo
8 1 (0.11%) Kibana
Vendors
1 59 (6.30%) Microsoft
2 49 (5.24%) Google
3 36 (3.85%) PayPal
4 24 (2.56%) Apple
5 17 (1.82%) Oracle
6 7 (0.75%) Adobe
6 7 (0.75%) Siemens
7 6 (0.64%) Sawtooth Software
8 5 (0.53%) Databricks
8 5 (0.53%) Intel
8 5 (0.53%) Xilinx
9 4 (0.43%) F5
9 4 (0.43%) Tealium
10 3 (0.32%) ESRI
10 3 (0.32%) IBM
10 3 (0.32%) Ping Identity
10 3 (0.32%) Splunk
10 3 (0.32%) Xamarin
11 2 (0.21%) BMC
12 1 (0.11%) Red Hat