e-Learning
UK
The table below looks at the prevalence of the term e-Learning in permanent job vacancies. Included is a benchmarking guide to the salaries offered in vacancies that cited e-Learning over the 6 months leading up to 27 May 2025, comparing them to the same period in the previous two years.
| 6 months to 27 May 2025 |
Same period 2024 | Same period 2023 | |
|---|---|---|---|
| Rank | 453 | 527 | 762 |
| Rank change year-on-year | +74 | +235 | -27 |
| Permanent jobs citing e-Learning | 267 | 423 | 206 |
| As % of all permanent jobs advertised in the UK | 0.49% | 0.42% | 0.21% |
| As % of the Miscellaneous category | 1.32% | 1.19% | 0.48% |
| Number of salaries quoted | 34 | 173 | 79 |
| 10th Percentile | £35,150 | £27,031 | £34,000 |
| 25th Percentile | £40,313 | £32,000 | £40,000 |
| Median annual salary (50th Percentile) | £50,750 | £40,000 | £50,000 |
| Median % change year-on-year | +26.88% | -20.00% | +9.29% |
| 75th Percentile | £66,688 | £48,393 | £61,250 |
| 90th Percentile | £67,500 | £73,500 | £63,150 |
| UK excluding London median annual salary | £48,750 | £37,500 | £49,250 |
| % change year-on-year | +30.00% | -23.86% | +15.88% |
All Generic Skills
UK
e-Learning falls under the General and Transferable Skills category. For comparison with the information above, the following table provides summary statistics for all permanent job vacancies requiring generic IT skills.
| Permanent vacancies with a requirement for generic IT skills | 20,242 | 35,424 | 42,583 |
| As % of all permanent jobs advertised in the UK | 37.12% | 34.77% | 43.42% |
| Number of salaries quoted | 9,259 | 23,070 | 22,889 |
| 10th Percentile | £31,250 | £28,000 | £35,733 |
| 25th Percentile | £42,000 | £38,000 | £46,350 |
| Median annual salary (50th Percentile) | £60,000 | £55,000 | £65,000 |
| Median % change year-on-year | +9.09% | -15.38% | +4.00% |
| 75th Percentile | £78,750 | £75,000 | £86,250 |
| 90th Percentile | £110,000 | £97,500 | £110,000 |
| UK excluding London median annual salary | £54,793 | £50,000 | £55,000 |
| % change year-on-year | +9.59% | -9.09% | +4.76% |
e-Learning
Job Vacancy Trend
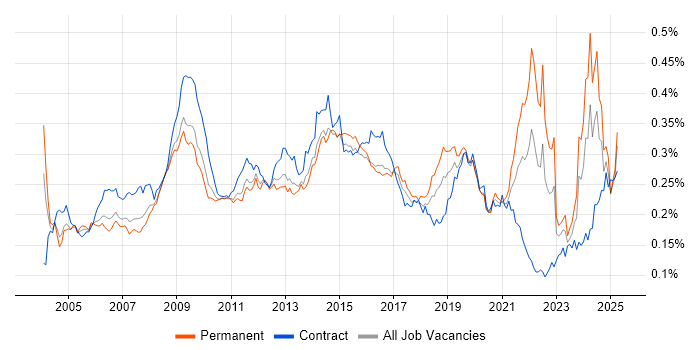
Job postings citing e-Learning as a proportion of all IT jobs advertised.

e-Learning
Salary Trend
3-month moving average salary quoted in jobs citing e-Learning.
e-Learning
Salary Histogram
Salary distribution for jobs citing e-Learning over the 6 months to 27 May 2025.
e-Learning
Top 16 Job Locations
The table below looks at the demand and provides a guide to the median salaries quoted in IT jobs citing e-Learning within the UK over the 6 months to 27 May 2025. The 'Rank Change' column provides an indication of the change in demand within each location based on the same 6 month period last year.
| Location | Rank Change on Same Period Last Year |
Matching Permanent IT Job Ads |
Median Salary Past 6 Months |
Median Salary % Change on Same Period Last Year |
Live Jobs |
|---|---|---|---|---|---|
| England | +34 | 232 | £50,000 | +25.00% | 468 |
| UK excluding London | +49 | 189 | £48,750 | +30.00% | 434 |
| Work from Home | +159 | 115 | £50,000 | +38.89% | 237 |
| South East | +96 | 94 | £52,500 | +56.72% | 111 |
| London | +105 | 52 | £53,000 | -0.93% | 90 |
| South West | +124 | 36 | £51,500 | +19.45% | 62 |
| Midlands | -16 | 21 | £40,000 | -15.79% | 76 |
| North of England | -48 | 19 | £65,000 | +73.33% | 99 |
| East Midlands | -35 | 14 | £52,500 | +31.25% | 40 |
| Wales | - | 12 | - | - | 25 |
| North West | -102 | 10 | £65,000 | +73.33% | 54 |
| Yorkshire | +71 | 9 | £47,500 | +35.23% | 37 |
| West Midlands | +67 | 7 | £38,000 | -36.67% | 31 |
| Scotland | +108 | 3 | £37,500 | -6.25% | 13 |
| East of England | +12 | 3 | £40,000 | - | 58 |
| Northern Ireland | - | 1 | - | - | 7 |
e-Learning
Co-occurring Skills and Capabilities by Category
The follow tables expand on the table above by listing co-occurrences grouped by category. The same employment type, locality and period is covered with up to 20 co-occurrences shown in each of the following categories:
|
|
||||||||||||||||||||||||||||||||||||||||||||||||||||||||||||||||||||||||||||||||||||||||||||||||||||||||||||||||||||||||||||||
|
|
||||||||||||||||||||||||||||||||||||||||||||||||||||||||||||||||||||||||||||||||||||||||||||||||||||||||||||||||||||||||||||||
|
|
||||||||||||||||||||||||||||||||||||||||||||||||||||||||||||||||||||||||||||||||||||||||||||||||||||||||||||||||||||||||||||||
|
|
||||||||||||||||||||||||||||||||||||||||||||||||||||||||||||||||||||||||||||||||||||||||||||||||||||||||||||||||||||||||||||||
|
|
||||||||||||||||||||||||||||||||||||||||||||||||||||||||||||||||||||||||||||||||||||||||||||||||||||||||||||||||||||||||||||||
|
|
||||||||||||||||||||||||||||||||||||||||||||||||||||||||||||||||||||||||||||||||||||||||||||||||||||||||||||||||||||||||||||||
|
|
||||||||||||||||||||||||||||||||||||||||||||||||||||||||||||||||||||||||||||||||||||||||||||||||||||||||||||||||||||||||||||||
|
|
||||||||||||||||||||||||||||||||||||||||||||||||||||||||||||||||||||||||||||||||||||||||||||||||||||||||||||||||||||||||||||||
|
|
||||||||||||||||||||||||||||||||||||||||||||||||||||||||||||||||||||||||||||||||||||||||||||||||||||||||||||||||||||||||||||||
|
|||||||||||||||||||||||||||||||||||||||||||||||||||||||||||||||||||||||||||||||||||||||||||||||||||||||||||||||||||||||||||||||
