IaaS Jobs with Work from Home Options

Infrastructure as a Service (IaaS)
UK > Work from Home

The table below provides summary statistics for permanent job vacancies with an option to work from home (WFH) and a requirement for IaaS skills. Included is a benchmarking guide to the salaries offered in vacancies that have cited IaaS over the 6 months to 16 May 2024 with a comparison to the same period in the previous 2 years.

6 months to
16 May 2024
Same period 2023 Same period 2022
Rank 332 147 260
Rank change year-on-year -185 +113 -100
Permanent jobs citing IaaS 304 971 1,028
As % of all permanent jobs with a WFH option 0.90% 2.39% 1.47%
As % of the Cloud Services category 2.08% 4.97% 2.77%
Number of salaries quoted 268 443 802
10th Percentile £42,238 £42,500 £45,000
25th Percentile £52,500 £55,000 £52,500
Median annual salary (50th Percentile) £68,500 £68,823 £67,500
Median % change year-on-year -0.47% +1.96% +2.27%
75th Percentile £91,250 £83,625 £88,750
90th Percentile £110,000 £93,750 £100,000
UK median annual salary £70,000 £70,000 £67,500
% change year-on-year - +3.70% +3.85%

All Cloud Skills
Work from Home

IaaS is in the Cloud Services category. The following table is for comparison with the above and provides summary statistics for all permanent job vacancies with a WFH option and a requirement for cloud computing skills.

Permanent vacancies with a requirement for cloud computing skills 14,607 19,531 37,066
As % of all permanent jobs with a WFH option 43.23% 48.06% 52.92%
Number of salaries quoted 11,903 14,263 21,734
10th Percentile £35,750 £38,250 £37,500
25th Percentile £45,000 £48,750 £46,470
Median annual salary (50th Percentile) £60,000 £65,000 £65,000
Median % change year-on-year -7.69% - +12.38%
75th Percentile £79,500 £85,000 £83,125
90th Percentile £97,500 £105,000 £96,250
UK median annual salary £57,500 £65,000 £62,500
% change year-on-year -11.54% +4.00% +8.70%

IaaS
Trend for Jobs with a WFH Option

Job vacancies with a work from home option citing IaaS as a proportion of all IT jobs advertised.
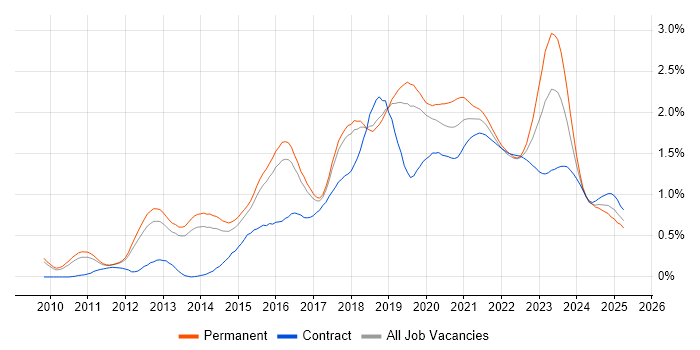
IaaS trend for jobs with a WFH option

IaaS
Salary Trend for Jobs with a WFH Option

3-month moving average salary quoted in job vacancies with a work from home option citing IaaS.

IaaS salary trend for jobs with a WFH option

IaaS
Salary Histogram for Jobs with a WFH Option

Salary distribution for jobs with a work from home option citing IaaS over the 6 months to 16 May 2024.

IaaS salary histogram for jobs with a WFH option

IaaS
Co-occurring Skills and Capabilities with WFH Options by Category

The follow tables expand on the table above by listing co-occurrences grouped by category. The same employment type, locality and period is covered with up to 20 co-occurrences shown in each of the following categories:

Application Platforms
1 20 (6.58%) SharePoint
2 17 (5.59%) Microsoft Exchange
3 6 (1.97%) OpenStack
4 5 (1.64%) IIS
5 4 (1.32%) ArcGIS
5 4 (1.32%) Confluence
6 1 (0.33%) Adobe Experience Manager
6 1 (0.33%) Apache Solr
6 1 (0.33%) CMS
6 1 (0.33%) Sitecore CMS
6 1 (0.33%) Umbraco
6 1 (0.33%) WordPress
Applications
1 4 (1.32%) MS Visio
2 2 (0.66%) Microsoft Excel
2 2 (0.66%) Microsoft PowerPoint
3 1 (0.33%) 1Password
3 1 (0.33%) Microsoft Office
Business Applications
1 7 (2.30%) Sparx Enterprise Architect
2 4 (1.32%) Dynamics CRM
2 4 (1.32%) Oracle EBS
3 1 (0.33%) Remedy ITSM
Cloud Services
1 240 (78.95%) Azure
2 217 (71.38%) PaaS
3 135 (44.41%) SaaS
4 86 (28.29%) AWS
5 81 (26.64%) Microsoft 365
6 57 (18.75%) Azure DevOps
7 46 (15.13%) Entra ID
8 22 (7.24%) GitHub
9 18 (5.92%) Nutanix
9 18 (5.92%) Serverless
10 15 (4.93%) GCP
11 14 (4.61%) Azure Stack
12 13 (4.28%) Azure AKS
13 12 (3.95%) Cloud Computing
14 10 (3.29%) OneDrive
15 9 (2.96%) GitHub Actions
16 7 (2.30%) Azure Monitor
16 7 (2.30%) Azure Storage
17 6 (1.97%) Azure Cosmos DB
17 6 (1.97%) Azure Service Fabric
Communications & Networking
1 56 (18.42%) Firewall
2 50 (16.45%) DNS
3 30 (9.87%) VPN
4 26 (8.55%) DHCP
5 24 (7.89%) WAN
6 23 (7.57%) LAN
7 19 (6.25%) Wi-Fi
8 17 (5.59%) SAN
9 15 (4.93%) NGFW
10 13 (4.28%) Wireless
11 12 (3.95%) Internet
11 12 (3.95%) SD-WAN
12 8 (2.63%) Network Security
13 7 (2.30%) TCP/IP
14 6 (1.97%) BGP
14 6 (1.97%) Fibre Channel
14 6 (1.97%) OSPF
15 5 (1.64%) IPv4
15 5 (1.64%) SSL
16 4 (1.32%) Remote Desktop
Database & Business Intelligence
1 19 (6.25%) Azure SQL Database
1 19 (6.25%) Data Warehouse
2 12 (3.95%) SQL Server
3 5 (1.64%) MongoDB
4 4 (1.32%) Geospatial Data
4 4 (1.32%) GIS
4 4 (1.32%) NoSQL
5 3 (0.99%) Big Data
6 2 (0.66%) Amazon RDS
6 2 (0.66%) Data Lake
6 2 (0.66%) MySQL
6 2 (0.66%) Redis
6 2 (0.66%) Relational Database
7 1 (0.33%) MariaDB
7 1 (0.33%) Oracle Database
7 1 (0.33%) PostgreSQL
7 1 (0.33%) Power BI
Development Applications
1 11 (3.62%) Git
2 9 (2.96%) Jenkins
3 8 (2.63%) SonarQube
4 5 (1.64%) JIRA
5 3 (0.99%) GitLab
6 1 (0.33%) Bitbucket
6 1 (0.33%) CircleCI
6 1 (0.33%) Gatling
6 1 (0.33%) JUnit
6 1 (0.33%) LoadRunner
6 1 (0.33%) Octopus Deploy
6 1 (0.33%) Sonatype Nexus
6 1 (0.33%) TeamCity
6 1 (0.33%) Vagrant
General
1 77 (25.33%) Finance
2 73 (24.01%) Social Skills
3 58 (19.08%) Analytical Skills
4 30 (9.87%) Inclusion and Diversity
5 28 (9.21%) Public Sector
6 10 (3.29%) Law
7 7 (2.30%) Police
8 6 (1.97%) Presentation Skills
9 5 (1.64%) Retail
10 4 (1.32%) Advertising
10 4 (1.32%) Telecoms
11 3 (0.99%) Documentation Skills
11 3 (0.99%) Pharmaceutical
12 2 (0.66%) Banking
12 2 (0.66%) Influencing Skills
12 2 (0.66%) Marketing
12 2 (0.66%) Public Speaking
12 2 (0.66%) Publishing
13 1 (0.33%) Back Office
13 1 (0.33%) Legal
Job Titles
1 88 (28.95%) Architect
2 72 (23.68%) Infrastructure Engineer
3 66 (21.71%) Senior
4 45 (14.80%) Solutions Architect
5 35 (11.51%) Senior Infrastructure Engineer
6 31 (10.20%) Cloud Architect
7 30 (9.87%) Citrix Architect
8 29 (9.54%) Azure Architect
9 27 (8.88%) Lead
10 26 (8.55%) Azure Engineer
11 25 (8.22%) Consultant
12 24 (7.89%) Cloud Engineer
13 21 (6.91%) Cloud Infrastructure Architect
14 19 (6.25%) Infrastructure Architect
15 17 (5.59%) Salesforce Architect
15 17 (5.59%) Salesforce Solution Architect
16 15 (4.93%) Azure Consultant
17 13 (4.28%) DevOps Engineer
18 11 (3.62%) DevOps Architect
18 11 (3.62%) Senior Cloud Engineer
Libraries, Frameworks & Software Standards
1 28 (9.21%) ARM Templates
2 21 (6.91%) Middleware
3 12 (3.95%) JSON
3 12 (3.95%) YAML
4 9 (2.96%) Azure Blueprints
5 8 (2.63%) Web Services
6 7 (2.30%) .NET
7 6 (1.97%) REST
7 6 (1.97%) SOAP
8 3 (0.99%) Node.js
9 2 (0.66%) Kafka
10 1 (0.33%) 802.1X
10 1 (0.33%) ADO
10 1 (0.33%) Lucene
10 1 (0.33%) SAML
10 1 (0.33%) SignalR
10 1 (0.33%) Spring
10 1 (0.33%) WSH
Miscellaneous
1 93 (30.59%) Public Cloud
2 44 (14.47%) Data Centre
3 39 (12.83%) Management Information System
4 18 (5.92%) Enterprise Software
5 17 (5.59%) Private Cloud
6 16 (5.26%) Cloud Native
7 14 (4.61%) IoT
8 8 (2.63%) Life Science
8 8 (2.63%) Onboarding
9 7 (2.30%) Driving Licence
9 7 (2.30%) PKI
10 6 (1.97%) Clustering
10 6 (1.97%) Distributed Systems
11 5 (1.64%) Mobile App
11 5 (1.64%) Replication
11 5 (1.64%) Self-Motivation
11 5 (1.64%) Virtual Team
12 3 (0.99%) Cyber Kill Chain
12 3 (0.99%) Hybrid Cloud
12 3 (0.99%) Security Operations Centre
Operating Systems
1 101 (33.22%) Windows
2 39 (12.83%) Windows Server
3 33 (10.86%) Unix
4 20 (6.58%) Linux
5 7 (2.30%) Windows 10
5 7 (2.30%) Windows Server 2012
6 6 (1.97%) Windows Server 2019
7 5 (1.64%) Windows Server 2016
8 4 (1.32%) Apple iOS
8 4 (1.32%) VMS
9 2 (0.66%) Android
10 1 (0.33%) Mac OS
10 1 (0.33%) Ubuntu
10 1 (0.33%) Windows 7
10 1 (0.33%) Windows Server 2003
10 1 (0.33%) Windows Server 2008
Processes & Methodologies
1 103 (33.88%) DevOps
2 83 (27.30%) Infrastructure as Code
3 82 (26.97%) Infrastructure Engineering
4 70 (23.03%) Mentoring
5 65 (21.38%) ITIL
6 51 (16.78%) Problem-Solving
7 50 (16.45%) Agile
8 47 (15.46%) CI/CD
9 46 (15.13%) Change Management
10 44 (14.47%) Technical Leadership
11 40 (13.16%) Cybersecurity
12 37 (12.17%) Coaching
12 37 (12.17%) TOGAF
13 36 (11.84%) Roadmaps
14 32 (10.53%) Microservices
15 31 (10.20%) Migration
16 30 (9.87%) Network Virtualisation
17 29 (9.54%) Business Strategy
17 29 (9.54%) Information Security
18 28 (9.21%) Architecture Roadmap
Programming Languages
1 48 (15.79%) PowerShell
2 36 (11.84%) SQL
3 34 (11.18%) Python
4 24 (7.89%) Bash
5 17 (5.59%) Bicep
6 14 (4.61%) Perl
7 9 (2.96%) Java
7 9 (2.96%) Ruby
8 6 (1.97%) C#
9 5 (1.64%) Go
10 4 (1.32%) JavaScript
11 3 (0.99%) Kusto Query Language
12 2 (0.66%) PHP
13 1 (0.33%) Groovy
13 1 (0.33%) Julia
13 1 (0.33%) Scala
13 1 (0.33%) Shell Script
13 1 (0.33%) TypeScript
13 1 (0.33%) VBScript
Qualifications
1 55 (18.09%) Azure Certification
1 55 (18.09%) Degree
2 36 (11.84%) Security Cleared
3 25 (8.22%) SC Cleared
4 22 (7.24%) TOGAF Certification
5 13 (4.28%) AWS Certification
6 10 (3.29%) BPSS Clearance
6 10 (3.29%) Computer Science Degree
7 9 (2.96%) CISM
7 9 (2.96%) CISSP
8 8 (2.63%) Master's Degree
8 8 (2.63%) Microsoft Certification
9 7 (2.30%) AWS Certified Solutions Architect
10 6 (1.97%) GIAC
10 6 (1.97%) SANS
11 5 (1.64%) ITIL Certification
12 4 (1.32%) DBS Check
13 3 (0.99%) MCSE
13 3 (0.99%) VMware Certified Professional (VCP)
14 2 (0.66%) Cisco Certification
Quality Assurance & Compliance
1 20 (6.58%) ISO/IEC 27001
2 16 (5.26%) NIST
3 13 (4.28%) Data Quality
4 11 (3.62%) Cyber Essentials
5 9 (2.96%) NCSC
5 9 (2.96%) SLA
6 7 (2.30%) COBIT
7 6 (1.97%) Web Application Security Consortium
8 5 (1.64%) GDPR
9 4 (1.32%) PCI DSS
9 4 (1.32%) PMO
10 2 (0.66%) ISO 9001
10 2 (0.66%) ISO/IEC 27002 (supersedes ISO/IEC 17799)
10 2 (0.66%) QA
10 2 (0.66%) SOC 2
11 1 (0.33%) Accessibility
11 1 (0.33%) GRC
11 1 (0.33%) ISO 22301
11 1 (0.33%) ISO 31000
11 1 (0.33%) NIST 800
System Software
1 70 (23.03%) Active Directory
2 54 (17.76%) VMware Infrastructure
3 25 (8.22%) Docker
4 19 (6.25%) VMware ESXi
5 18 (5.92%) Hyper-V
6 17 (5.59%) Virtual Desktop
6 17 (5.59%) Virtual Machines
7 16 (5.26%) vSphere
8 4 (1.32%) Terminal Services
9 2 (0.66%) Firmware
Systems Management
1 84 (27.63%) Terraform
2 27 (8.88%) Kubernetes
3 20 (6.58%) Ansible
4 18 (5.92%) Microsoft Intune
5 8 (2.63%) SCCM
6 7 (2.30%) Active Directory Federation Services
7 6 (1.97%) Computer Emergency Response Teams
7 6 (1.97%) vCenter Server
8 5 (1.64%) SCOM
9 4 (1.32%) EMC NetWorker
9 4 (1.32%) Microsoft Clustering
10 3 (0.99%) Istio
10 3 (0.99%) Progress Chef
10 3 (0.99%) Puppet
10 3 (0.99%) Single Sign-On
10 3 (0.99%) WSUS
11 2 (0.66%) Grafana
11 2 (0.66%) Packer
11 2 (0.66%) SolarWinds Orion
11 2 (0.66%) vRealize
Vendors
1 117 (38.49%) Microsoft
2 70 (23.03%) VMware
3 33 (10.86%) Citrix
4 25 (8.22%) Salesforce
5 18 (5.92%) Dynatrace
5 18 (5.92%) Splunk
6 12 (3.95%) BMC
7 11 (3.62%) Cisco
7 11 (3.62%) Oracle
8 10 (3.29%) Aruba
8 10 (3.29%) Google
8 10 (3.29%) ServiceNow
9 9 (2.96%) Veeam
10 8 (2.63%) SAP
10 8 (2.63%) SolarWinds
11 7 (2.30%) Meraki
11 7 (2.30%) Palo Alto
11 7 (2.30%) Sparx
12 6 (1.97%) 3PAR
12 6 (1.97%) Nimble Storage