OO Jobs with Hybrid/Remote/WFH Options

Object-Oriented (OO)
UK > Work from Home

The table below provides summary statistics for permanent remote or hybrid work requiring OO skills. It includes a benchmarking guide to the annual salaries offered in vacancies that cited OO over the 6 months leading up to 14 May 2025, comparing them to the same period in the previous two years.

6 months to
14 May 2025
Same period 2024 Same period 2023
Rank 191 197 127
Rank change year-on-year +6 -70 -19
Permanent jobs citing OO 328 546 1,143
As % of all permanent jobs with a WFH option 1.83% 1.62% 2.76%
As % of the Processes & Methodologies category 1.94% 1.77% 2.88%
Number of salaries quoted 229 463 925
10th Percentile £25,000 £35,200 £41,372
25th Percentile £32,500 £41,250 £47,500
Median annual salary (50th Percentile) £50,000 £50,000 £60,000
Median % change year-on-year - -16.67% +9.09%
75th Percentile £73,750 £65,000 £77,715
90th Percentile £85,000 £82,500 £96,250
UK median annual salary £55,000 £52,500 £62,500
% change year-on-year +4.76% -16.00% +4.17%

All Process and Methodology Skills
Work from Home

OO falls under the Processes and Methodologies category. For comparison with the information above, the following table provides summary statistics for all permanent job vacancies with remote or hybrid options requiring process or methodology skills.

Permanent vacancies with a requirement for process or methodology skills 16,886 30,803 39,731
As % of all permanent jobs with a WFH option 94.21% 91.37% 96.09%
Number of salaries quoted 9,670 23,360 27,643
10th Percentile £28,750 £33,750 £37,500
25th Percentile £43,750 £42,500 £47,500
Median annual salary (50th Percentile) £60,000 £57,500 £62,500
Median % change year-on-year +4.35% -8.00% +4.17%
75th Percentile £77,500 £75,000 £82,500
90th Percentile £102,500 £95,000 £100,000
UK median annual salary £57,500 £55,000 £61,000
% change year-on-year +4.55% -9.84% +1.67%

OO
Trend for Jobs with a WFH Option

Job vacancies with remote working options citing OO as a proportion of all IT jobs advertised.
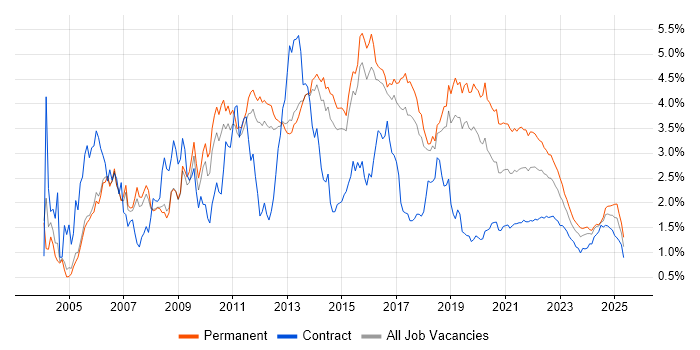
OO trend for jobs with Hybrid/Remote/WFH options

OO
Salary Trend for Jobs with a WFH Option

3-month moving average salary quoted in job vacancies with remote working options citing OO.

OO salary trend for jobs with a WFH option

OO
Salary Histogram for Jobs with a WFH Option

Salary distribution for jobs with remote working options citing OO over the 6 months to 14 May 2025.

OO salary histogram for jobs with a WFH option

OO
Co-occurring Skills and Capabilities with WFH Options by Category

The follow tables expand on the table above by listing co-occurrences grouped by category. The same employment type, locality and period is covered with up to 20 co-occurrences shown in each of the following categories:

Application Platforms
1 26 (7.93%) CMS
2 17 (5.18%) WordPress
3 10 (3.05%) Drupal
4 6 (1.83%) Apache
5 4 (1.22%) Microsoft Exchange
6 3 (0.91%) Apache Spark
6 3 (0.91%) GemFire
7 1 (0.30%) Oracle SOA Suite
7 1 (0.30%) SharePoint
Applications
1 9 (2.74%) Microsoft Office
2 2 (0.61%) Simulink
Business Applications
1 12 (3.66%) Oracle EBS
2 11 (3.35%) JDE OneWorld
2 11 (3.35%) NetSuite
3 2 (0.61%) Dynamics CRM
4 1 (0.30%) Dynamics NAV
4 1 (0.30%) SAP EWM
4 1 (0.30%) SAP S/4HANA
4 1 (0.30%) Visualfiles
Cloud Services
1 137 (41.77%) Azure
2 92 (28.05%) AWS
3 52 (15.85%) AWS CloudFormation
4 49 (14.94%) Amazon EKS
5 24 (7.32%) Azure DevOps
6 22 (6.71%) GitHub
7 21 (6.40%) GCP
8 11 (3.35%) Apigee
8 11 (3.35%) Boomi
8 11 (3.35%) Google Kubernetes Engine
8 11 (3.35%) npm
9 10 (3.05%) AWS Lambda
9 10 (3.05%) SaaS
9 10 (3.05%) Serverless
10 7 (2.13%) Azure Logic Apps
11 6 (1.83%) Amazon S3
12 4 (1.22%) Amazon Cognito
12 4 (1.22%) Azure Synapse Analytics
12 4 (1.22%) CloudFront
12 4 (1.22%) OpenShift
Communications & Networking
1 9 (2.74%) HTTP
2 4 (1.22%) 5G
2 4 (1.22%) SD-WAN
2 4 (1.22%) WAN
3 2 (0.61%) Ethernet
3 2 (0.61%) Modbus
3 2 (0.61%) Profibus
4 1 (0.30%) Broadband
4 1 (0.30%) Internet
4 1 (0.30%) SMS
4 1 (0.30%) TCP/IP
Database & Business Intelligence
1 54 (16.46%) SQL Server
2 53 (16.16%) MySQL
3 50 (15.24%) Elasticsearch
4 28 (8.54%) NoSQL
5 15 (4.57%) Relational Database
6 14 (4.27%) Big Data
7 11 (3.35%) PostgreSQL
8 10 (3.05%) MongoDB
9 8 (2.44%) Azure SQL Database
9 8 (2.44%) Data Lake
9 8 (2.44%) Data Warehouse
10 7 (2.13%) Amazon Athena
10 7 (2.13%) NonStop SQL
11 6 (1.83%) RDBMS
12 4 (1.22%) Amazon Redshift
12 4 (1.22%) BigQuery
12 4 (1.22%) Redis
13 3 (0.91%) Apache Ignite
13 3 (0.91%) InterSystems Cache
14 2 (0.61%) SQL Server Reporting Services
Development Applications
1 67 (20.43%) Git
2 22 (6.71%) JUnit
3 20 (6.10%) Visual Studio
4 17 (5.18%) Jenkins
5 12 (3.66%) NUnit
6 11 (3.35%) Maven
6 11 (3.35%) SonarQube
6 11 (3.35%) Sonatype Nexus
7 10 (3.05%) webpack
8 8 (2.44%) Grunt
9 4 (1.22%) GitLab
9 4 (1.22%) Jasmine
9 4 (1.22%) Karma Test Runner
9 4 (1.22%) Mocha
9 4 (1.22%) MSTest
9 4 (1.22%) TeamCity
10 3 (0.91%) Cypress.io
10 3 (0.91%) Selenium
10 3 (0.91%) SpecFlow
11 2 (0.61%) Babel
General
1 97 (29.57%) Finance
2 77 (23.48%) Inclusion and Diversity
3 69 (21.04%) Social Skills
4 65 (19.82%) Analytical Skills
5 28 (8.54%) Banking
6 19 (5.79%) Law
7 12 (3.66%) Front Office
8 9 (2.74%) Aerospace
9 8 (2.44%) Electronics
10 6 (1.83%) Legal
10 6 (1.83%) Marketing
11 5 (1.52%) Public Sector
12 4 (1.22%) Presentation Skills
13 3 (0.91%) Advertising
13 3 (0.91%) Back Office
13 3 (0.91%) Military
14 2 (0.61%) Organisational Skills
14 2 (0.61%) Retail
15 1 (0.30%) Financial Institution
15 1 (0.30%) German Language
Job Titles
1 210 (64.02%) Developer
2 56 (17.07%) Senior
3 49 (14.94%) Software Developer
4 47 (14.33%) Software Engineer
5 45 (13.72%) C# Developer
6 44 (13.41%) PHP Developer
7 41 (12.50%) .NET Developer
8 34 (10.37%) Graduate
8 34 (10.37%) Graduate Developer
8 34 (10.37%) IT Graduate
9 21 (6.40%) Senior Software Engineer
10 20 (6.10%) Architect
11 18 (5.49%) C# .NET Developer
12 16 (4.88%) Lead
13 13 (3.96%) Agile C# Developer
13 13 (3.96%) Agile Developer
13 13 (3.96%) Graduate PHP Developer
13 13 (3.96%) Graduate SQL Developer
13 13 (3.96%) Senior Developer
13 13 (3.96%) SQL Developer
Libraries, Frameworks & Software Standards
1 178 (54.27%) .NET
2 118 (35.98%) CSS
3 101 (30.79%) HTML
4 64 (19.51%) jQuery
4 64 (19.51%) Node.js
5 55 (16.77%) React
6 53 (16.16%) ASP.NET
7 49 (14.94%) Pandas
8 44 (13.41%) RESTful
9 29 (8.84%) AngularJS
10 28 (8.54%) REST
11 26 (7.93%) Web Services
12 25 (7.62%) .NET Core
13 23 (7.01%) Symfony
14 22 (6.71%) .NET Framework
14 22 (6.71%) Hibernate
15 18 (5.49%) JSON
16 17 (5.18%) Django
16 17 (5.18%) SOAP
16 17 (5.18%) XML
Miscellaneous
1 49 (14.94%) Cyberattack
2 17 (5.18%) Product Ownership
3 13 (3.96%) Management Information System
4 12 (3.66%) Mobile App
5 11 (3.35%) Cloud Native
6 9 (2.74%) Equities
6 9 (2.74%) Virtual Team
7 8 (2.44%) Legacy Code
8 6 (1.83%) Algorithms
8 6 (1.83%) Credit Derivative
8 6 (1.83%) Data Structures
8 6 (1.83%) Derivative
8 6 (1.83%) Fixed Income
8 6 (1.83%) Foreign Exchange (FX)
8 6 (1.83%) Hedge funds
9 5 (1.52%) Robotics
10 4 (1.22%) e-Learning
10 4 (1.22%) GNSS
10 4 (1.22%) Self-Driving Car
10 4 (1.22%) Self-Motivation
Operating Systems
1 78 (23.78%) Linux
2 53 (16.16%) Android
3 15 (4.57%) Windows
4 14 (4.27%) Unix
5 5 (1.52%) Robot Operating System
6 4 (1.22%) Apple iOS
6 4 (1.22%) Windows Server
7 1 (0.30%) Embedded Linux
7 1 (0.30%) Red Hat Enterprise Linux
Processes & Methodologies
1 188 (57.32%) OOP
2 181 (55.18%) Agile
3 118 (35.98%) Software Engineering
4 107 (32.62%) Design Patterns
5 94 (28.66%) CI/CD
6 73 (22.26%) Problem-Solving
7 72 (21.95%) Collaborative Working
8 59 (17.99%) Computer Science
9 56 (17.07%) Continuous Improvement
10 55 (16.77%) Secure Coding
11 54 (16.46%) Microservices
11 54 (16.46%) MVC
12 53 (16.16%) Containerisation
12 53 (16.16%) OWASP
13 50 (15.24%) Kanban
13 50 (15.24%) Line Management
13 50 (15.24%) Mathematics
13 50 (15.24%) Test Automation
14 49 (14.94%) Android Development
14 49 (14.94%) Statistics
Programming Languages
1 167 (50.91%) JavaScript
2 139 (42.38%) Java
3 131 (39.94%) C#
4 113 (34.45%) C++
5 107 (32.62%) SQL
6 105 (32.01%) Python
7 72 (21.95%) PHP
8 60 (18.29%) Go
9 49 (14.94%) Rust
10 35 (10.67%) TypeScript
11 24 (7.32%) C
12 8 (2.44%) Bash
12 8 (2.44%) Perl
13 4 (1.22%) Ruby
14 3 (0.91%) PowerShell
14 3 (0.91%) Scala
15 2 (0.61%) ABAP
15 2 (0.61%) MATLAB
16 1 (0.30%) COBOL
16 1 (0.30%) Delphi
Qualifications
1 83 (25.30%) Degree
2 59 (17.99%) Security Cleared
3 52 (15.85%) Computer Science Degree
4 49 (14.94%) DV Cleared
5 9 (2.74%) Master's Degree
6 7 (2.13%) BPSS Clearance
7 6 (1.83%) SC Cleared
8 1 (0.30%) DBS Check
8 1 (0.30%) ITIL Certification
Quality Assurance & Compliance
1 20 (6.10%) Accessibility
2 17 (5.18%) QA
3 4 (1.22%) PMO
4 2 (0.61%) IEC 61131
5 1 (0.30%) ISO 15022
5 1 (0.30%) ISO 20022
5 1 (0.30%) ISO 9001
5 1 (0.30%) ISO/IEC 27001
5 1 (0.30%) NCSC
5 1 (0.30%) SLA
System Software
1 78 (23.78%) Docker
Systems Management
1 67 (20.43%) Kubernetes
2 63 (19.21%) Terraform
3 49 (14.94%) Ansible
4 11 (3.35%) Istio
5 1 (0.30%) Grafana
5 1 (0.30%) Prometheus
Vendors
1 30 (9.15%) Microsoft
2 20 (6.10%) Oracle
3 12 (3.66%) Salesforce
4 11 (3.35%) Dell
5 8 (2.44%) Okta
6 4 (1.22%) Databricks
6 4 (1.22%) F5
7 3 (0.91%) Solace
7 3 (0.91%) TIBCO
8 2 (0.61%) Apple
8 2 (0.61%) SAP
9 1 (0.30%) Google
9 1 (0.30%) HP
9 1 (0.30%) IBM
9 1 (0.30%) Red Hat