Data Migration Jobs with Work from Home Options

Data Migration
UK > Work from Home

The table below provides summary statistics for permanent job vacancies with an option to work from home (WFH) and a requirement for Data Migration skills. Included is a benchmarking guide to the salaries offered in vacancies that have cited Data Migration over the 6 months to 29 April 2024 with a comparison to the same period in the previous 2 years.

6 months to
29 Apr 2024
Same period 2023 Same period 2022
Rank 257 329 354
Rank change year-on-year +72 +25 -49
Permanent jobs citing Data Migration 405 402 659
As % of all permanent jobs with a WFH option 1.20% 0.94% 0.98%
As % of the Processes & Methodologies category 1.31% 0.98% 1.01%
Number of salaries quoted 180 264 392
10th Percentile £36,250 £38,875 £40,000
25th Percentile £42,500 £48,750 £45,000
Median annual salary (50th Percentile) £57,500 £62,500 £60,000
Median % change year-on-year -8.00% +4.17% +4.35%
75th Percentile £77,500 £83,125 £75,000
90th Percentile £97,750 £95,000 £92,500
UK median annual salary £57,500 £65,000 £60,000
% change year-on-year -11.54% +8.33% +9.09%

All Process and Methodology Skills
Work from Home

Data Migration is in the Processes and Methodologies category. The following table is for comparison with the above and provides summary statistics for all permanent job vacancies with a WFH option and a requirement for process or methodology skills.

Permanent vacancies with a requirement for process or methodology skills 30,987 41,089 65,497
As % of all permanent jobs with a WFH option 91.64% 96.07% 96.93%
Number of salaries quoted 23,565 28,569 41,256
10th Percentile £33,944 £37,500 £36,250
25th Percentile £42,500 £47,500 £45,500
Median annual salary (50th Percentile) £57,500 £62,500 £60,000
Median % change year-on-year -8.00% +4.17% +9.09%
75th Percentile £75,000 £82,500 £80,000
90th Percentile £95,000 £100,000 £95,000
UK median annual salary £55,000 £61,500 £60,000
% change year-on-year -10.57% +2.50% +9.09%

Data Migration
Trend for Jobs with a WFH Option

Job vacancies with a work from home option citing Data Migration as a proportion of all IT jobs advertised.
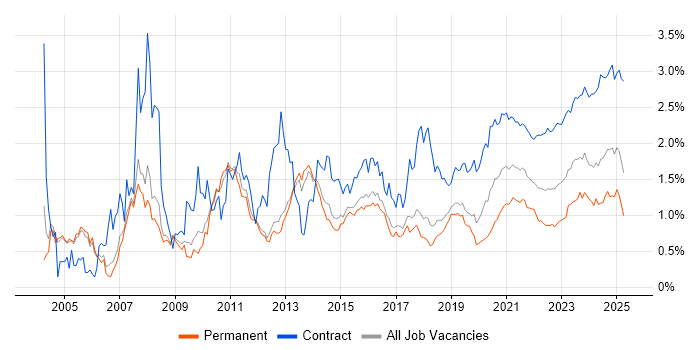
Data Migration trend for jobs with a WFH option

Data Migration
Salary Trend for Jobs with a WFH Option

3-month moving average salary quoted in job vacancies with a work from home option citing Data Migration.

Data Migration salary trend for jobs with a WFH option

Data Migration
Salary Histogram for Jobs with a WFH Option

Salary distribution for jobs with a work from home option citing Data Migration over the 6 months to 29 April 2024.

Data Migration salary histogram for jobs with a WFH option

Data Migration
Co-occurring Skills and Capabilities with WFH Options by Category

The follow tables expand on the table above by listing co-occurrences grouped by category. The same employment type, locality and period is covered with up to 20 co-occurrences shown in each of the following categories:

Application Platforms
1 46 (11.36%) WebLogic
2 22 (5.43%) SharePoint
3 13 (3.21%) Confluence
4 4 (0.99%) Appian
5 3 (0.74%) Alfresco
5 3 (0.74%) Documentum
5 3 (0.74%) FileNet
5 3 (0.74%) IIS
5 3 (0.74%) nginx
6 2 (0.49%) NServiceBus
7 1 (0.25%) Apache
7 1 (0.25%) Apache Spark
7 1 (0.25%) CMS
7 1 (0.25%) Tomcat
Applications
1 7 (1.73%) Microsoft Office
2 3 (0.74%) Microsoft Excel
2 3 (0.74%) Spreadsheet
3 1 (0.25%) Microsoft Project
Business Applications
1 46 (11.36%) Sparx Enterprise Architect
2 24 (5.93%) SAP S/4HANA
3 9 (2.22%) SAP CX
4 5 (1.23%) Dynamics CRM
5 3 (0.74%) NEC Housing
6 2 (0.49%) MIS ActiveH
6 2 (0.49%) SAP CO
6 2 (0.49%) SAP FI
6 2 (0.49%) SAP FI/CO
6 2 (0.49%) SAP MM
6 2 (0.49%) SAP PP
6 2 (0.49%) SAP SCM
7 1 (0.25%) Cognos Business Intelligence
7 1 (0.25%) Oracle EBS
7 1 (0.25%) Oracle Financials
7 1 (0.25%) SAP Business ByDesign
7 1 (0.25%) SAP ERP
7 1 (0.25%) SAP HR
7 1 (0.25%) SAP Payroll
7 1 (0.25%) Unit4 Business World
Cloud Services
1 180 (44.44%) AWS
2 77 (19.01%) Azure
3 49 (12.10%) Amazon EKS
4 46 (11.36%) Amazon SQS
5 34 (8.40%) Power Platform
6 17 (4.20%) Dynamics 365
6 17 (4.20%) Microsoft 365
7 13 (3.21%) Amazon S3
7 13 (3.21%) GitHub
8 12 (2.96%) Amazon EC2
8 12 (2.96%) AWS CloudFormation
8 12 (2.96%) Route 53
8 12 (2.96%) Virtual Private Cloud
9 11 (2.72%) Power Automate
10 10 (2.47%) PowerApps
10 10 (2.47%) Serverless
11 9 (2.22%) AWS Lambda
12 7 (1.73%) GCP
12 7 (1.73%) Mavenlink
13 6 (1.48%) Intacct
Communications & Networking
1 50 (12.35%) DNS
2 46 (11.36%) BGP
2 46 (11.36%) SSL
2 46 (11.36%) TCP/IP
3 6 (1.48%) Firewall
4 3 (0.74%) Internet
4 3 (0.74%) Wi-Fi
4 3 (0.74%) Wireless
5 2 (0.49%) Intranet
Database & Business Intelligence
1 161 (39.75%) Oracle Database
2 108 (26.67%) PostgreSQL
3 105 (25.93%) Oracle Database 11g
4 58 (14.32%) Amazon RDS
5 57 (14.07%) Relational Database
6 48 (11.85%) RDBMS
7 24 (5.93%) Power BI
8 18 (4.44%) Data Warehouse
8 18 (4.44%) MySQL
9 13 (3.21%) SQL Server
10 9 (2.22%) SQL Server Integration Services
11 5 (1.23%) Redis
12 4 (0.99%) Azure SQL Database
12 4 (0.99%) Oracle Reports
12 4 (0.99%) SAP HANA
13 3 (0.74%) Data Vault
13 3 (0.74%) DB2
13 3 (0.74%) Metadata
13 3 (0.74%) OLAP
13 3 (0.74%) SQL Server Analysis Services
Development Applications
1 59 (14.57%) JIRA
2 13 (3.21%) Bitbucket
3 10 (2.47%) Jenkins
3 10 (2.47%) Sonatype Nexus
3 10 (2.47%) Subversion
4 4 (0.99%) Git
4 4 (0.99%) GitLab
4 4 (0.99%) Postman
5 2 (0.49%) LSMW
6 1 (0.25%) Artifactory
6 1 (0.25%) ClearCase
6 1 (0.25%) ClearQuest
6 1 (0.25%) Redmine
6 1 (0.25%) SonarQube
6 1 (0.25%) Visual Studio
6 1 (0.25%) Visual Studio Team System
General
1 133 (32.84%) Social Skills
2 64 (15.80%) Finance
3 23 (5.68%) Analytical Skills
4 16 (3.95%) Law
5 12 (2.96%) Public Sector
6 11 (2.72%) Manufacturing
6 11 (2.72%) Marketing
7 10 (2.47%) Organisational Skills
8 8 (1.98%) Banking
9 7 (1.73%) Back Office
9 7 (1.73%) Legal
10 5 (1.23%) Documentation Skills
10 5 (1.23%) Games
10 5 (1.23%) Inclusion and Diversity
10 5 (1.23%) Retail
11 2 (0.49%) Danish Language
11 2 (0.49%) Influencing Skills
11 2 (0.49%) Local Government
11 2 (0.49%) Presentation Skills
11 2 (0.49%) Swedish Language
Job Titles
1 133 (32.84%) Developer
2 108 (26.67%) Senior
3 105 (25.93%) Database Developer
3 105 (25.93%) PostgreSQL Developer
4 101 (24.94%) Senior Developer
5 93 (22.96%) Senior Database Developer
6 82 (20.25%) Analyst
7 63 (15.56%) Architect
7 63 (15.56%) Lead
8 50 (12.35%) Solutions Architect
9 46 (11.36%) Lead Architect
9 46 (11.36%) Lead Solutions Architect
10 42 (10.37%) Business Analyst
11 28 (6.91%) Consultant
12 17 (4.20%) DBA
13 16 (3.95%) Administrator
14 14 (3.46%) Support Analyst
14 14 (3.46%) Systems Analyst
15 12 (2.96%) Applications Support
15 12 (2.96%) Applications Support Analyst
Libraries, Frameworks & Software Standards
1 46 (11.36%) RabbitMQ
1 46 (11.36%) Spring Boot
2 8 (1.98%) Oracle Fusion
3 7 (1.73%) .NET
3 7 (1.73%) JSON
4 6 (1.48%) CSS
4 6 (1.48%) HTML
5 4 (0.99%) Node.js
5 4 (0.99%) SAML
5 4 (0.99%) SOAP
5 4 (0.99%) WebdriverIO
6 3 (0.74%) AngularJS
6 3 (0.74%) HTML5 Canvas
7 2 (0.49%) .NET Framework
7 2 (0.49%) Blazor
7 2 (0.49%) HTML5
7 2 (0.49%) Lightning Web Components
7 2 (0.49%) Middleware
7 2 (0.49%) REST
7 2 (0.49%) WCF
Miscellaneous
1 57 (14.07%) Enterprise Software
2 46 (11.36%) Public Cloud
3 16 (3.95%) Management Information System
4 13 (3.21%) Legacy Systems
5 9 (2.22%) Distributed Systems
6 7 (1.73%) Cloud Native
6 7 (1.73%) Onboarding
7 5 (1.23%) Low-Code
8 4 (0.99%) AS400
8 4 (0.99%) Data Structures
8 4 (0.99%) Distributed Architecture
8 4 (0.99%) Greenfield Project
9 3 (0.74%) Educational Technology
9 3 (0.74%) Self-Motivation
9 3 (0.74%) Team-Oriented Environment
9 3 (0.74%) Wiki
10 2 (0.49%) Biopharmaceutical
10 2 (0.49%) Driving Licence
10 2 (0.49%) Learning Management System
10 2 (0.49%) Renewable Energy
Operating Systems
1 57 (14.07%) Linux
2 46 (11.36%) Red Hat Enterprise Linux
3 10 (2.47%) Windows
4 4 (0.99%) AIX
5 3 (0.74%) Unix
6 2 (0.49%) Windows Server
Processes & Methodologies
1 405 (100.00%) Migration
2 196 (48.40%) Actionable Insight
3 123 (30.37%) Agile
4 108 (26.67%) Artificial Intelligence
5 106 (26.17%) Performance Tuning
5 106 (26.17%) Secure Coding
6 105 (25.93%) Unit Testing
7 86 (21.23%) Problem-Solving
8 68 (16.79%) Project Management
9 65 (16.05%) Requirements Gathering
10 63 (15.56%) Roadmaps
11 58 (14.32%) SDLC
12 55 (13.58%) TOGAF
13 54 (13.33%) ERP
14 52 (12.84%) Stakeholder Management
15 50 (12.35%) Collaborative Working
16 49 (12.10%) Cloud Operations
17 48 (11.85%) Scrum
18 47 (11.60%) Kanban
19 46 (11.36%) Load Balancing
Programming Languages
1 157 (38.77%) SQL
2 122 (30.12%) PL/SQL
3 18 (4.44%) Python
4 15 (3.70%) Java
5 13 (3.21%) JavaScript
6 5 (1.23%) C#
7 4 (0.99%) PHP
7 4 (0.99%) RPG
7 4 (0.99%) T-SQL
8 3 (0.74%) Bash
8 3 (0.74%) PowerShell
8 3 (0.74%) VBA
9 1 (0.25%) Scala
9 1 (0.25%) VB
Qualifications
1 94 (23.21%) Security Cleared
2 89 (21.98%) SC Cleared
3 49 (12.10%) AWS Certification
3 49 (12.10%) AWS Certified Solutions Architect
3 49 (12.10%) Azure Certification
4 34 (8.40%) Degree
5 17 (4.20%) Computer Science Degree
6 10 (2.47%) PMP
7 9 (2.22%) PMI Certification
8 7 (1.73%) CISM
8 7 (1.73%) CISSP
8 7 (1.73%) Master's Degree
9 5 (1.23%) BPSS Clearance
10 4 (0.99%) Microsoft Certification
10 4 (0.99%) OCP
10 4 (0.99%) Oracle Certification
11 1 (0.25%) CCA
11 1 (0.25%) DBS Check
11 1 (0.25%) SAP Certification
Quality Assurance & Compliance
1 30 (7.41%) Data Quality
2 9 (2.22%) GDPR
3 6 (1.48%) QA
4 4 (0.99%) Cyber Essentials
5 3 (0.74%) GMP
6 2 (0.49%) ISO/IEC 27001
6 2 (0.49%) SLA
7 1 (0.25%) Accessibility
7 1 (0.25%) PMO
System Software
1 16 (3.95%) Docker
2 2 (0.49%) VMware Infrastructure
3 1 (0.25%) Active Directory
3 1 (0.25%) HDFS
3 1 (0.25%) Shibboleth
3 1 (0.25%) Varnish
Systems Management
1 13 (3.21%) Terraform
2 12 (2.96%) Kubernetes
3 9 (2.22%) Packer
4 4 (0.99%) Ansible
4 4 (0.99%) Grafana
4 4 (0.99%) Kibana
4 4 (0.99%) Oracle RMAN
4 4 (0.99%) Progress Chef
4 4 (0.99%) Puppet
4 4 (0.99%) Salt
5 1 (0.25%) SCCM
Vendors
1 187 (46.17%) Oracle
2 46 (11.36%) Sparx
3 41 (10.12%) Microsoft
4 40 (9.88%) SAP
5 20 (4.94%) Salesforce
6 10 (2.47%) Atlassian
7 9 (2.22%) IFS
8 8 (1.98%) IBM
9 6 (1.48%) Sage
10 4 (0.99%) Google
10 4 (0.99%) ServiceNow
10 4 (0.99%) Splunk
11 3 (0.74%) EMC
11 3 (0.74%) Hyland
11 3 (0.74%) iManage
11 3 (0.74%) Laserfiche
11 3 (0.74%) NEC
11 3 (0.74%) OpenText
12 2 (0.49%) Cloudera
12 2 (0.49%) VMware