Enterprise Software Jobs with Hybrid/Remote/WFH Options

Enterprise Application Software
UK > Work from Home

The table below looks at the prevalence of the term Enterprise Software in remote or hybrid work. Included is a benchmarking guide to the salaries offered in vacancies that cited Enterprise Software over the 6 months leading up to 3 May 2025, comparing them to the same period in the previous two years.

6 months to
3 May 2025
Same period 2024 Same period 2023
Rank 215 250 281
Rank change year-on-year +35 +31 -4
Permanent jobs citing Enterprise Software 228 414 488
As % of all permanent jobs with a WFH option 1.50% 1.22% 1.15%
As % of the Miscellaneous category 3.82% 3.44% 2.97%
Number of salaries quoted 97 331 418
10th Percentile £36,250 £42,500 £42,494
25th Percentile £42,500 £46,250 £55,000
Median annual salary (50th Percentile) £63,500 £65,000 £66,250
Median % change year-on-year -2.31% -1.89% +1.92%
75th Percentile £78,750 £83,750 £92,500
90th Percentile £107,000 £87,500 £115,000
UK median annual salary £65,000 £62,500 £65,000
% change year-on-year +4.00% -3.85% +4.00%

All Generic Skills
Work from Home

Enterprise Software falls under the General and Transferable Skills category. For comparison with the information above, the following table provides summary statistics for all permanent job vacancies with remote or hybrid options requiring generic IT skills.

Permanent vacancies with a requirement for generic IT skills 5,963 12,029 16,425
As % of all permanent jobs with a WFH option 39.31% 35.56% 38.58%
Number of salaries quoted 3,870 9,255 11,843
10th Percentile £35,000 £32,500 £39,000
25th Percentile £47,231 £42,500 £48,750
Median annual salary (50th Percentile) £65,000 £59,300 £65,000
Median % change year-on-year +9.61% -8.77% -
75th Percentile £85,000 £78,750 £86,250
90th Percentile £122,500 £101,250 £107,500
UK median annual salary £60,000 £55,000 £65,000
% change year-on-year +9.09% -15.38% +4.00%

Enterprise Software
Trend for Jobs with a WFH Option

Job vacancies with remote working options citing Enterprise Software as a proportion of all IT jobs advertised.
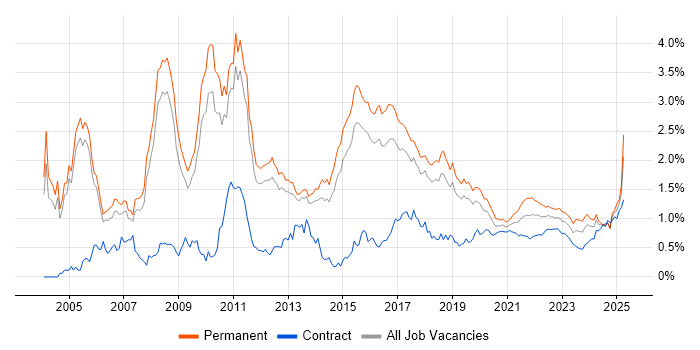
Enterprise Software trend for jobs with Hybrid/Remote/WFH options

Enterprise Software
Salary Trend for Jobs with a WFH Option

3-month moving average salary quoted in job vacancies with remote working options citing Enterprise Software.

Enterprise Software salary trend for jobs with a WFH option

Enterprise Software
Salary Histogram for Jobs with a WFH Option

Salary distribution for jobs with remote working options citing Enterprise Software over the 6 months to 3 May 2025.

Enterprise Software salary histogram for jobs with a WFH option

Enterprise Software
Co-occurring Skills and Capabilities with WFH Options by Category

The follow tables expand on the table above by listing co-occurrences grouped by category. The same employment type, locality and period is covered with up to 20 co-occurrences shown in each of the following categories:

Application Platforms
1 64 (28.07%) Confluence
2 8 (3.51%) IIS
3 5 (2.19%) Apache
3 5 (2.19%) SharePoint
3 5 (2.19%) Tomcat
4 4 (1.75%) JBoss
5 3 (1.32%) Apache Spark
5 3 (1.32%) NetWeaver
6 1 (0.44%) Blackberry Enterprise Server
6 1 (0.44%) Jupyter
6 1 (0.44%) OpenStack
Applications
1 6 (2.63%) Chatbot
2 5 (2.19%) Microsoft Office
3 4 (1.75%) Microsoft Project
4 1 (0.44%) Microsoft Excel
Business Applications
1 8 (3.51%) SAP S/4HANA
2 4 (1.75%) Oracle EBS
2 4 (1.75%) Oracle ERP
2 4 (1.75%) PeopleSoft HCM
3 1 (0.44%) Dynamics CRM
3 1 (0.44%) Salesforce CRM
Cloud Services
1 118 (51.75%) AWS
2 114 (50.00%) Azure
3 71 (31.14%) GCP
4 30 (13.16%) SaaS
5 18 (7.89%) Microsoft 365
5 18 (7.89%) Serverless
6 15 (6.58%) AWS Lambda
7 14 (6.14%) Amazon EC2
7 14 (6.14%) Amazon EKS
7 14 (6.14%) Amazon S3
7 14 (6.14%) Datadog
8 10 (4.39%) Entra ID
9 7 (3.07%) Microsoft Copilot
10 6 (2.63%) Cloud Computing
10 6 (2.63%) Snowflake
11 5 (2.19%) OCI
11 5 (2.19%) Power Automate
12 4 (1.75%) Mimecast
13 3 (1.32%) OpenShift
13 3 (1.32%) SuccessFactors
Communications & Networking
1 7 (3.07%) Firewall
2 5 (2.19%) DMARC
2 5 (2.19%) SSL
3 3 (1.32%) DNS
4 2 (0.88%) IPsec
4 2 (0.88%) Network Security
4 2 (0.88%) VPN
5 1 (0.44%) DHCP
5 1 (0.44%) PSTN
Database & Business Intelligence
1 92 (40.35%) SQL Server
2 8 (3.51%) Oracle Database
3 7 (3.07%) Data Lake
3 7 (3.07%) SAP HANA
4 6 (2.63%) Hadoop
5 5 (2.19%) Azure SQL Database
5 5 (2.19%) PostgreSQL
6 4 (1.75%) MongoDB
7 3 (1.32%) Data Warehouse
8 2 (0.88%) Amazon Redshift
8 2 (0.88%) BigQuery
8 2 (0.88%) Power BI
8 2 (0.88%) Relational Database
9 1 (0.44%) Amazon RDS
9 1 (0.44%) Flink
9 1 (0.44%) SQL Server Reporting Services
Development Applications
1 97 (42.54%) GitLab
2 96 (42.11%) Cucumber
2 96 (42.11%) Maven
3 91 (39.91%) JIRA
4 82 (35.96%) Bitbucket
4 82 (35.96%) Selenium
4 82 (35.96%) SonarQube
4 82 (35.96%) Sonatype Nexus
5 17 (7.46%) Jenkins
6 14 (6.14%) Git
6 14 (6.14%) IntelliJ
6 14 (6.14%) JUnit
6 14 (6.14%) Mockito
7 3 (1.32%) MSTest
7 3 (1.32%) NUnit
7 3 (1.32%) SpecFlow
7 3 (1.32%) TeamCity
8 2 (0.88%) Eclipse
9 1 (0.44%) kappa
9 1 (0.44%) Team Foundation Server
General
1 116 (50.88%) Finance
2 86 (37.72%) Banking
2 86 (37.72%) Inclusion and Diversity
3 53 (23.25%) Social Skills
4 22 (9.65%) Presentation Skills
4 22 (9.65%) Retail
5 21 (9.21%) Corporate Banking
5 21 (9.21%) Investment Banking
6 11 (4.82%) Analytical Skills
7 6 (2.63%) Organisational Skills
8 5 (2.19%) Czech Language
9 4 (1.75%) Advertising
9 4 (1.75%) Manufacturing
9 4 (1.75%) Marketing
10 3 (1.32%) Front Office
10 3 (1.32%) Law
10 3 (1.32%) Pharmaceutical
11 1 (0.44%) Legal
11 1 (0.44%) Mandarin Language
11 1 (0.44%) Telecoms
Job Titles
1 82 (35.96%) Software Engineer
2 40 (17.54%) Developer
3 33 (14.47%) Architect
4 27 (11.84%) Senior
5 19 (8.33%) Java Developer
6 18 (7.89%) Solutions Architect
7 17 (7.46%) IT Manager
7 17 (7.46%) Senior Developer
8 15 (6.58%) Business Development Manager
8 15 (6.58%) Business Manager
8 15 (6.58%) Development Manager
8 15 (6.58%) IT Development Manager
8 15 (6.58%) IT Services Manager
8 15 (6.58%) New Business Development Manager
8 15 (6.58%) Senior Java Developer
9 14 (6.14%) AWS Developer
9 14 (6.14%) AWS DevOps
9 14 (6.14%) DevOps Developer
9 14 (6.14%) Senior DevOps
10 13 (5.70%) Pricing Developer
Libraries, Frameworks & Software Standards
1 100 (43.86%) HTML
2 99 (43.42%) Spring
2 99 (43.42%) Spring Boot
3 87 (38.16%) CSS
4 85 (37.28%) Kafka
5 82 (35.96%) JPA
5 82 (35.96%) React
5 82 (35.96%) Redux
6 61 (26.75%) Hibernate
7 50 (21.93%) REST
8 28 (12.28%) HTML5
9 25 (10.96%) RESTful
10 24 (10.53%) CSS3
11 21 (9.21%) Jest
11 21 (9.21%) Sass
12 17 (7.46%) JMS
13 15 (6.58%) .NET
14 14 (6.14%) ActiveMQ
15 10 (4.39%) SOAP
16 9 (3.95%) XML
Miscellaneous
1 84 (36.84%) Product Ownership
2 26 (11.40%) Management Information System
3 17 (7.46%) Credit Derivative
4 10 (4.39%) Self-Motivation
5 8 (3.51%) Cloud Native
6 5 (2.19%) Legacy Systems
6 5 (2.19%) Virtual Team
7 3 (1.32%) Derivative
7 3 (1.32%) Equities
7 3 (1.32%) Fixed Income
7 3 (1.32%) Foreign Exchange (FX)
7 3 (1.32%) Life Science
7 3 (1.32%) Private Cloud
8 2 (0.88%) Data Structures
8 2 (0.88%) Distributed Systems
8 2 (0.88%) Hybrid Cloud
8 2 (0.88%) LIMS
8 2 (0.88%) Linux Command Line
9 1 (0.44%) Operational Technology
9 1 (0.44%) Security Posture
Operating Systems
1 22 (9.65%) Linux
2 12 (5.26%) Windows
3 5 (2.19%) Unix
4 3 (1.32%) Windows Server
5 2 (0.88%) Oracle Linux
Processes & Methodologies
1 111 (48.68%) DevOps
2 110 (48.25%) Agile
3 105 (46.05%) Software Engineering
4 103 (45.18%) SDLC
5 102 (44.74%) CI/CD
6 93 (40.79%) Full-Stack Development
6 93 (40.79%) Microservices
7 89 (39.04%) Test Automation
8 87 (38.16%) Containerisation
8 87 (38.16%) Performance Optimisation
9 82 (35.96%) Front End Development
10 76 (33.33%) Continuous Improvement
11 64 (28.07%) TDD
12 61 (26.75%) Clean Code
13 36 (15.79%) Migration
14 34 (14.91%) Problem-Solving
15 28 (12.28%) B2B
15 28 (12.28%) Roadmaps
16 27 (11.84%) Mentoring
17 26 (11.40%) Strategic Thinking
Programming Languages
1 114 (50.00%) Java
2 108 (47.37%) SQL
3 104 (45.61%) JavaScript
4 25 (10.96%) TypeScript
5 20 (8.77%) C#
5 20 (8.77%) C++
6 11 (4.82%) Python
7 7 (3.07%) PowerShell
8 5 (2.19%) VBA
9 3 (1.32%) ABAP
10 1 (0.44%) Go
10 1 (0.44%) R
10 1 (0.44%) SAPscript
Qualifications
1 27 (11.84%) Degree
2 12 (5.26%) Computer Science Degree
3 9 (3.95%) Master's Degree
4 7 (3.07%) SAP Certification
5 5 (2.19%) PMI Certification
5 5 (2.19%) PMP
6 4 (1.75%) SC Cleared
6 4 (1.75%) Security Cleared
7 3 (1.32%) AWS Certification
7 3 (1.32%) Azure Certification
7 3 (1.32%) Microsoft Certification
8 2 (0.88%) Oracle Certification
9 1 (0.44%) CISSP
9 1 (0.44%) DBS Check
9 1 (0.44%) ITIL Certification
Quality Assurance & Compliance
1 86 (37.72%) QA
2 24 (10.53%) Accessibility
3 7 (3.07%) ISO/IEC 27001
4 2 (0.88%) Cyber Essentials
4 2 (0.88%) Data Quality
4 2 (0.88%) NIST
5 1 (0.44%) COSO
5 1 (0.44%) GDPR
5 1 (0.44%) PCI DSS
5 1 (0.44%) PMO
5 1 (0.44%) SLA
System Software
1 83 (36.40%) Docker
2 12 (5.26%) Active Directory
3 3 (1.32%) Hyper-V
4 1 (0.44%) VMware Infrastructure
Systems Management
1 84 (36.84%) Kubernetes
2 20 (8.77%) Ansible
3 18 (7.89%) Terraform
4 8 (3.51%) Single Sign-On
5 7 (3.07%) Microsoft Intune
6 1 (0.44%) Norton AntiVirus
6 1 (0.44%) SCCM
Vendors
1 82 (35.96%) Solace
2 26 (11.40%) Microsoft
3 22 (9.65%) SAP
4 17 (7.46%) IBM
5 14 (6.14%) Oracle
6 7 (3.07%) Databricks
6 7 (3.07%) Google
7 6 (2.63%) PayPal
8 4 (1.75%) Facebook
8 4 (1.75%) Hyperion
8 4 (1.75%) JD Edwards
8 4 (1.75%) Palo Alto
8 4 (1.75%) PeopleSoft
8 4 (1.75%) Teradata
8 4 (1.75%) YouTube
9 3 (1.32%) Cisco
9 3 (1.32%) SolarWinds
10 2 (0.88%) Guidewire
10 2 (0.88%) Informatica
10 2 (0.88%) Salesforce