Azure Jobs in England

Microsoft Azure
UK > England

The following table provides summary statistics for permanent job vacancies advertised in England with a requirement for Azure skills. Included is a benchmarking guide to the salaries offered in vacancies that have cited Azure over the 6 months to 9 May 2024 with a comparison to the same period in the previous 2 years.

6 months to
9 May 2024
Same period 2023 Same period 2022
Rank 5 4 6
Rank change year-on-year -1 +2 -1
Permanent jobs citing Azure 14,823 19,880 25,953
As % of all permanent jobs advertised in England 17.28% 22.02% 19.57%
As % of the Cloud Services category 48.94% 51.02% 40.72%
Number of salaries quoted 11,949 12,860 16,527
10th Percentile £34,208 £36,250 £37,500
25th Percentile £43,750 £47,500 £46,750
Median annual salary (50th Percentile) £59,000 £65,000 £62,500
Median % change year-on-year -9.23% +4.00% +8.70%
75th Percentile £75,000 £85,000 £82,500
90th Percentile £95,000 £100,015 £100,000
UK median annual salary £59,000 £64,140 £62,500
% change year-on-year -8.01% +2.62% +8.70%

All Cloud Skills
England

Azure is in the Cloud Services category. The following table is for comparison with the above and provides summary statistics for all permanent job vacancies advertised in England with a requirement for cloud computing skills.

Permanent vacancies with a requirement for cloud computing skills 30,291 38,963 63,733
As % of all permanent jobs advertised in England 35.31% 43.16% 48.05%
Number of salaries quoted 24,205 25,890 36,549
10th Percentile £30,000 £34,723 £33,750
25th Percentile £41,250 £46,250 £45,000
Median annual salary (50th Percentile) £57,500 £65,000 £62,500
Median % change year-on-year -11.54% +4.00% +4.17%
75th Percentile £77,500 £85,000 £83,750
90th Percentile £97,500 £105,000 £100,000
UK median annual salary £57,500 £65,000 £62,500
% change year-on-year -11.54% +4.00% +8.70%

Azure
Job Vacancy Trend in England

Job postings citing Azure as a proportion of all IT jobs advertised in England.
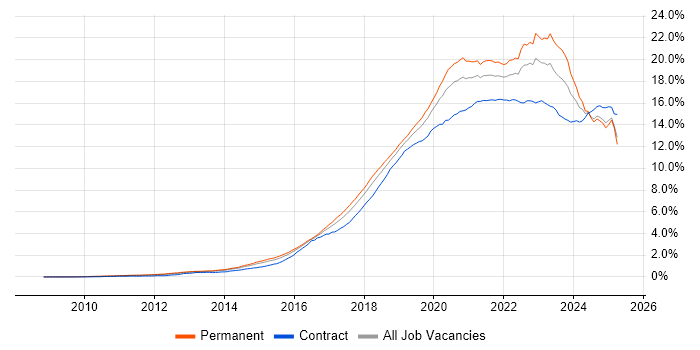
Job vacancy trend for Azure in England

Azure
Salary Trend in England

3-month moving average salary quoted in jobs citing Azure in England.

Salary trend for Azure in England

Azure
Salary Histogram in England

Salary distribution for jobs citing Azure in England over the 6 months to 9 May 2024.

Salary histogram for Azure in England

Azure
Job Locations in England

The table below looks at the demand and provides a guide to the median salaries quoted in IT jobs citing Azure within the England region over the 6 months to 9 May 2024. The 'Rank Change' column provides an indication of the change in demand within each location based on the same 6 month period last year.

Location Rank Change
on Same Period
Last Year
Matching
Permanent
IT Job Ads
Median Salary
Past 6 Months
Median Salary
% Change
on Same Period
Last Year
Live
Jobs
London 0 4,665 £75,000 - 1,274
North of England 0 3,086 £55,000 - 640
South East -2 2,789 £54,000 -6.09% 485
Midlands +2 1,931 £50,000 -9.09% 478
North West 0 1,644 £57,500 +4.55% 352
South West -2 1,411 £55,000 +4.76% 328
West Midlands +1 1,154 £54,395 -1.10% 281
Yorkshire 0 1,059 £55,000 - 222
East of England 0 793 £50,000 - 184
East Midlands +4 773 £48,500 -7.62% 196
North East +4 385 £47,500 -13.64% 69
Azure
UK

Azure
Co-occurring Skills and Capabilities in England by Category

The follow tables expand on the table above by listing co-occurrences grouped by category. The same employment type, locality and period is covered with up to 20 co-occurrences shown in each of the following categories:

Application Platforms
1 1,075 (7.25%) SharePoint
2 1,023 (6.90%) Microsoft Exchange
3 262 (1.77%) IIS
4 231 (1.56%) Apache
5 200 (1.35%) ArcGIS
6 198 (1.34%) GeoServer
7 197 (1.33%) Apache Spark
8 172 (1.16%) Apache Airflow
9 131 (0.88%) CMS
10 121 (0.82%) Confluence
11 89 (0.60%) Umbraco
12 54 (0.36%) Sitecore CMS
13 50 (0.34%) Kentico
14 49 (0.33%) OpenStack
15 41 (0.28%) Headless CMS
16 36 (0.24%) nginx
16 36 (0.24%) WordPress
17 35 (0.24%) Exchange Server 2010
17 35 (0.24%) WebLogic
18 31 (0.21%) Exchange Server 2013
Applications
1 526 (3.55%) Microsoft Office
2 219 (1.48%) Microsoft Excel
3 46 (0.31%) Microsoft PowerPoint
3 46 (0.31%) MS Visio
4 37 (0.25%) Microsoft Project
5 30 (0.20%) Trello
6 21 (0.14%) Simulink
7 10 (0.067%) Chatbot
8 8 (0.054%) Photoshop
9 6 (0.040%) LightWave 3D
10 4 (0.027%) Adobe XD
10 4 (0.027%) SPSS
11 3 (0.020%) Spreadsheet
12 2 (0.013%) 1Password
12 2 (0.013%) Adobe Illustrator
12 2 (0.013%) CATIA
12 2 (0.013%) NASTRAN
12 2 (0.013%) Sketch
12 2 (0.013%) S-PLUS
13 1 (0.007%) Notion
Business Applications
1 229 (1.54%) Dynamics CRM
2 64 (0.43%) Sparx Enterprise Architect
3 36 (0.24%) Dynamics NAV
4 20 (0.13%) Dynamics AX
5 13 (0.088%) SAP S/4HANA
5 13 (0.088%) Teamcenter
6 11 (0.074%) Maximo
7 10 (0.067%) Elite 3E
7 10 (0.067%) Payment Gateway
8 9 (0.061%) Remedy ITSM
8 9 (0.061%) Unit4 Business World
9 8 (0.054%) Salesforce CRM
10 6 (0.040%) Oracle General Ledger
10 6 (0.040%) Oracle Subledger Accounting
10 6 (0.040%) Primavera
10 6 (0.040%) SAP PLM
11 5 (0.034%) NetSuite
11 5 (0.034%) SAP ERP
11 5 (0.034%) SAP IBP
11 5 (0.034%) SAP PP
Cloud Services
1 4,298 (29.00%) AWS
2 3,479 (23.47%) Microsoft 365
3 2,077 (14.01%) Azure DevOps
4 1,728 (11.66%) GCP
5 1,704 (11.50%) Power Platform
6 1,589 (10.72%) Entra ID
7 878 (5.92%) SaaS
8 634 (4.28%) Serverless
9 614 (4.14%) PaaS
10 575 (3.88%) Dynamics 365
11 541 (3.65%) IaaS
12 469 (3.16%) Azure Data Factory
13 425 (2.87%) PowerApps
14 402 (2.71%) GitHub
15 371 (2.50%) Cloud Computing
16 352 (2.37%) Power Automate
17 341 (2.30%) Azure Functions
18 332 (2.24%) OneDrive
19 330 (2.23%) Azure Service Bus
20 322 (2.17%) Azure Logic Apps
Communications & Networking
1 1,603 (10.81%) Firewall
2 1,070 (7.22%) DNS
3 774 (5.22%) WAN
4 693 (4.68%) DHCP
5 625 (4.22%) LAN
6 587 (3.96%) VPN
7 482 (3.25%) TCP/IP
8 383 (2.58%) SAN
9 373 (2.52%) Wi-Fi
10 319 (2.15%) Internet
11 309 (2.08%) Wireless
12 300 (2.02%) Broadband
13 299 (2.02%) Network Security
14 285 (1.92%) VLAN
15 233 (1.57%) SD-WAN
16 212 (1.43%) 5G
17 190 (1.28%) VoIP
18 111 (0.75%) NAS
18 111 (0.75%) Remote Desktop
19 110 (0.74%) BGP
Database & Business Intelligence
1 2,602 (17.55%) SQL Server
2 1,206 (8.14%) Power BI
3 957 (6.46%) Data Warehouse
4 843 (5.69%) PostgreSQL
5 677 (4.57%) MongoDB
6 654 (4.41%) NoSQL
7 570 (3.85%) Azure SQL Database
8 531 (3.58%) Data Lake
9 448 (3.02%) Relational Database
10 419 (2.83%) SQL Server Integration Services
11 359 (2.42%) Elasticsearch
12 295 (1.99%) MySQL
13 266 (1.79%) DB2
14 262 (1.77%) SQL Server Reporting Services
15 245 (1.65%) GIS
16 242 (1.63%) BigQuery
17 227 (1.53%) Big Data
18 196 (1.32%) QGIS
19 192 (1.30%) Looker
20 187 (1.26%) Amazon RDS
Development Applications
1 870 (5.87%) Git
2 496 (3.35%) JIRA
3 411 (2.77%) Jenkins
4 297 (2.00%) GitLab
5 266 (1.79%) Visual Studio
6 133 (0.90%) Selenium
7 124 (0.84%) Cypress.io
8 115 (0.78%) Team Foundation Server
9 82 (0.55%) Postman
10 75 (0.51%) NUnit
11 66 (0.45%) TeamCity
12 58 (0.39%) SonarQube
13 57 (0.38%) Octopus Deploy
13 57 (0.38%) Visual Studio Code
14 53 (0.36%) Bitbucket
15 51 (0.34%) Cucumber
16 48 (0.32%) JMeter
17 46 (0.31%) Jasmine
18 40 (0.27%) Artifactory
19 37 (0.25%) CircleCI
General
1 3,370 (22.73%) Social Skills
2 2,354 (15.88%) Finance
3 1,369 (9.24%) Analytical Skills
4 878 (5.92%) Public Sector
5 726 (4.90%) Inclusion and Diversity
6 576 (3.89%) Retail
7 507 (3.42%) Law
8 393 (2.65%) Banking
9 382 (2.58%) Legal
10 325 (2.19%) Marketing
11 286 (1.93%) Front Office
12 276 (1.86%) Presentation Skills
13 262 (1.77%) Manufacturing
14 209 (1.41%) Telecoms
15 199 (1.34%) Organisational Skills
16 178 (1.20%) Aerospace
17 152 (1.03%) Games
18 142 (0.96%) Advertising
19 128 (0.86%) Documentation Skills
20 111 (0.75%) Back Office
Job Titles
1 3,672 (24.77%) Developer
2 2,497 (16.85%) Senior
3 1,671 (11.27%) .NET Developer
4 1,584 (10.69%) Architect
5 1,251 (8.44%) Lead
6 1,031 (6.96%) Software Engineer
7 991 (6.69%) Analyst
8 888 (5.99%) Infrastructure Engineer
9 753 (5.08%) Support Engineer
10 711 (4.80%) Azure Engineer
10 711 (4.80%) C# Developer
11 680 (4.59%) IT Support
12 661 (4.46%) IT Engineer
13 650 (4.39%) Senior Developer
14 594 (4.01%) Data Engineer
15 549 (3.70%) Solutions Architect
16 535 (3.61%) C# .NET Developer
17 485 (3.27%) Full Stack Developer
18 464 (3.13%) DevOps Engineer
19 428 (2.89%) Consultant
Libraries, Frameworks & Software Standards
1 3,762 (25.38%) .NET
2 1,808 (12.20%) React
3 1,697 (11.45%) AngularJS
4 1,663 (11.22%) ASP.NET
5 1,525 (10.29%) .NET Core
6 1,385 (9.34%) HTML
7 1,336 (9.01%) CSS
8 1,014 (6.84%) .NET Framework
9 942 (6.35%) ASP.NET Web API
10 874 (5.90%) Entity Framework
11 831 (5.61%) ASP.NET MVC
12 828 (5.59%) Vue
13 716 (4.83%) REST
14 714 (4.82%) Node.js
15 645 (4.35%) RESTful
16 559 (3.77%) HTML5
17 549 (3.70%) Web Services
18 486 (3.28%) Twitter Bootstrap
19 416 (2.81%) jQuery
20 410 (2.77%) Blazor
Miscellaneous
1 597 (4.03%) Public Cloud
2 454 (3.06%) Management Information System
3 443 (2.99%) Hybrid Cloud
4 438 (2.95%) Data Structures
5 424 (2.86%) Self-Motivation
6 402 (2.71%) Product Ownership
7 384 (2.59%) Greenfield Project
8 365 (2.46%) Cloud Native
9 358 (2.42%) Algorithms
9 358 (2.42%) Data Centre
10 308 (2.08%) Blockchain
11 278 (1.88%) Social Media
12 261 (1.76%) Fixed Income
13 244 (1.65%) Hedge funds
14 229 (1.54%) Driving Licence
15 221 (1.49%) Enterprise Software
16 209 (1.41%) Equities
17 202 (1.36%) Mobile App
18 194 (1.31%) Private Cloud
19 190 (1.28%) Onboarding
Operating Systems
1 3,197 (21.57%) Windows
2 1,616 (10.90%) Linux
3 1,555 (10.49%) Windows Server
4 567 (3.83%) Windows 10
5 501 (3.38%) Android
6 448 (3.02%) Apple iOS
7 372 (2.51%) Ubuntu
8 312 (2.10%) Windows Server 2016
9 253 (1.71%) Windows Server 2019
10 238 (1.61%) Windows Server 2012
11 168 (1.13%) Red Hat Enterprise Linux
12 163 (1.10%) Unix
13 141 (0.95%) VMS
14 138 (0.93%) Mac OS
15 137 (0.92%) CentOS
16 95 (0.64%) Debian
17 48 (0.32%) Windows Server 2008
18 40 (0.27%) Alpine Linux
19 31 (0.21%) Windows 7
20 30 (0.20%) Mac OS X
Processes & Methodologies
1 4,665 (31.47%) Agile
2 3,884 (26.20%) DevOps
3 2,209 (14.90%) Problem-Solving
4 2,167 (14.62%) Full Stack Development
5 1,800 (12.14%) CI/CD
6 1,772 (11.95%) Software Engineering
7 1,616 (10.90%) Microservices
8 1,408 (9.50%) MVC
9 1,345 (9.07%) Mentoring
10 1,287 (8.68%) Business Intelligence
11 1,268 (8.55%) Scrum
12 1,246 (8.41%) Cybersecurity
13 1,235 (8.33%) Artificial Intelligence
14 1,210 (8.16%) Infrastructure Engineering
15 1,165 (7.86%) ITIL
16 1,061 (7.16%) Roadmaps
17 1,041 (7.02%) ETL
17 1,041 (7.02%) Migration
18 1,022 (6.89%) Analytics
19 902 (6.09%) TDD
Programming Languages
1 3,689 (24.89%) C#
2 3,684 (24.85%) SQL
3 2,973 (20.06%) JavaScript
4 2,249 (15.17%) Python
5 1,374 (9.27%) PowerShell
6 1,116 (7.53%) TypeScript
7 1,064 (7.18%) Java
8 572 (3.86%) T-SQL
9 560 (3.78%) Bash
10 167 (1.13%) Bicep
11 140 (0.94%) Go
12 139 (0.94%) R
13 134 (0.90%) Data Analysis Expressions
14 124 (0.84%) C++
15 103 (0.69%) PHP
16 99 (0.67%) Kotlin
17 90 (0.61%) Scala
18 84 (0.57%) Ruby
19 78 (0.53%) VB.NET
20 74 (0.50%) VB
Qualifications
1 1,675 (11.30%) Degree
2 1,319 (8.90%) Security Cleared
3 937 (6.32%) SC Cleared
4 757 (5.11%) Microsoft Certification
5 756 (5.10%) Azure Certification
6 447 (3.02%) Computer Science Degree
7 389 (2.62%) Cisco Certification
8 270 (1.82%) DV Cleared
9 256 (1.73%) CCNA
9 256 (1.73%) CISSP
10 251 (1.69%) AWS Certification
11 211 (1.42%) DBS Check
12 189 (1.28%) MCSE
13 168 (1.13%) Master's Degree
14 134 (0.90%) CCNP
15 113 (0.76%) CISM
15 113 (0.76%) TOGAF Certification
16 112 (0.76%) MCSA
17 106 (0.72%) BPSS Clearance
18 93 (0.63%) (ISC)2 CCSP
Quality Assurance & Compliance
1 595 (4.01%) QA
2 437 (2.95%) Data Quality
3 404 (2.73%) GDPR
4 366 (2.47%) ISO/IEC 27001
5 280 (1.89%) SLA
6 197 (1.33%) Cyber Essentials
7 186 (1.25%) NIST
8 134 (0.90%) Accessibility
9 106 (0.72%) PCI DSS
10 49 (0.33%) Cyber Essentials PLUS
11 46 (0.31%) PMO
12 42 (0.28%) NCSC
13 33 (0.22%) ISO/IEC 27002 (supersedes ISO/IEC 17799)
14 29 (0.20%) COBIT
15 27 (0.18%) HIPAA
16 25 (0.17%) GRC
17 20 (0.13%) ISO 9001
17 20 (0.13%) SOC 2
18 17 (0.11%) Sarbanes-Oxley
19 16 (0.11%) ISO/IEC 20000
System Software
1 2,753 (18.57%) Active Directory
2 1,076 (7.26%) Docker
3 998 (6.73%) VMware Infrastructure
4 864 (5.83%) Hyper-V
5 352 (2.37%) Virtual Machines
6 203 (1.37%) VMware ESXi
7 181 (1.22%) Virtual Desktop
8 171 (1.15%) vSphere
9 90 (0.61%) Virtual Servers
10 52 (0.35%) XenApp
11 35 (0.24%) XenDesktop
12 34 (0.23%) Firmware
13 31 (0.21%) Terminal Services
14 27 (0.18%) VMware NSX
15 19 (0.13%) KVM
15 19 (0.13%) VMware Server
16 18 (0.12%) HDFS
17 12 (0.081%) vCloud
18 11 (0.074%) Citrix Hypervisor
18 11 (0.074%) Microsoft Virtual Server
Systems Management
1 1,391 (9.38%) Microsoft Intune
2 1,247 (8.41%) Kubernetes
3 1,151 (7.76%) Terraform
4 531 (3.58%) Ansible
5 303 (2.04%) SCCM
6 268 (1.81%) Jamf Pro
7 180 (1.21%) Puppet
8 158 (1.07%) Single Sign-On
9 143 (0.96%) vCenter Server
10 109 (0.74%) Active Directory Federation Services
10 109 (0.74%) Progress Chef
11 89 (0.60%) Grafana
11 89 (0.60%) WSUS
12 81 (0.55%) Prometheus
13 79 (0.53%) SCOM
14 58 (0.39%) FortiGate
15 44 (0.30%) Nagios
16 42 (0.28%) CASB
17 37 (0.25%) Microsoft Clustering
18 34 (0.23%) Failover Clustering
Vendors
1 6,547 (44.17%) Microsoft
2 1,541 (10.40%) VMware
3 935 (6.31%) Google
4 742 (5.01%) Cisco
5 570 (3.85%) Databricks
6 427 (2.88%) Citrix
7 425 (2.87%) Red Hat
8 415 (2.80%) Oracle
9 386 (2.60%) IBM
10 326 (2.20%) Veeam
11 251 (1.69%) CyberArk
12 219 (1.48%) HP
13 210 (1.42%) Tanium
14 208 (1.40%) Meraki
15 201 (1.36%) ESRI
16 167 (1.13%) ServiceNow
17 162 (1.09%) Fortinet
18 154 (1.04%) Apple
19 150 (1.01%) Dell
20 146 (0.98%) SolarWinds