Salesforce Jobs with Hybrid/Remote/WFH Options

Salesforce
UK > Work from Home

The table below provides summary statistics for permanent remote or hybrid work requiring knowledge or experience of Salesforce products and/or services. It includes a benchmarking guide to the annual salaries offered in vacancies that cited Salesforce over the 6 months leading up to 3 May 2025, comparing them to the same period in the previous two years.

The figures below represent the IT labour market in general and are not representative of salaries within Salesforce.

6 months to
3 May 2025
Same period 2024 Same period 2023
Rank 163 157 169
Rank change year-on-year -6 +12 +24
Permanent jobs citing Salesforce 313 697 889
As % of all permanent jobs with a WFH option 2.06% 2.06% 2.09%
As % of the Vendors category 4.48% 4.96% 5.18%
Number of salaries quoted 158 586 679
10th Percentile £34,075 £35,700 £40,000
25th Percentile £43,750 £38,000 £46,570
Median annual salary (50th Percentile) £56,250 £40,000 £60,000
Median % change year-on-year +40.63% -33.33% -7.69%
75th Percentile £77,500 £58,750 £80,000
90th Percentile £89,875 £83,750 £90,250
UK median annual salary £55,500 £46,000 £62,500
% change year-on-year +20.65% -26.40% -

All Vendors
Work from Home

Salesforce falls under the Vendor Products and Services category. For comparison with the information above, the following table provides summary statistics for all permanent job vacancies with a remote or hybrid options requiring knowledge or experience of all vendor products and services.

Permanent vacancies with a requirement for knowledge or experience of vendor products and services 6,985 14,063 17,156
As % of all permanent jobs with a WFH option 46.04% 41.57% 40.30%
Number of salaries quoted 4,506 10,069 11,423
10th Percentile £25,087 £31,250 £32,500
25th Percentile £37,170 £41,250 £43,750
Median annual salary (50th Percentile) £57,000 £55,000 £59,191
Median % change year-on-year +3.64% -7.08% +2.94%
75th Percentile £72,500 £71,222 £77,500
90th Percentile £93,764 £87,500 £92,500
UK median annual salary £55,000 £50,000 £57,500
% change year-on-year +10.00% -13.04% +4.55%

Salesforce
Trend for Jobs with a WFH Option

Job vacancies with remote working options citing Salesforce as a proportion of all IT jobs advertised.
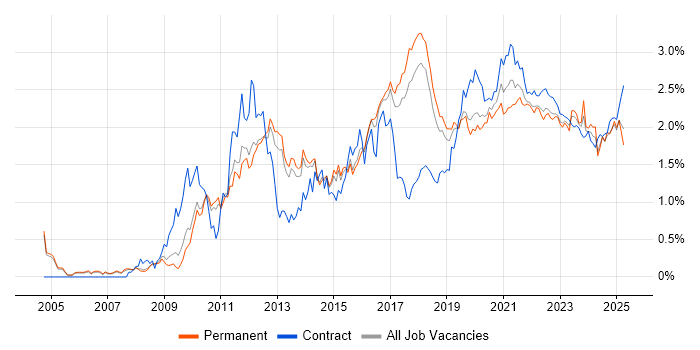
Salesforce trend for jobs with Hybrid/Remote/WFH options

Salesforce
Salary Trend for Jobs with a WFH Option

3-month moving average salary quoted in job vacancies with remote working options citing Salesforce.

Salesforce salary trend for jobs with a WFH option

Salesforce
Salary Histogram for Jobs with a WFH Option

Salary distribution for jobs with remote working options citing Salesforce over the 6 months to 3 May 2025.

Salesforce salary histogram for jobs with a WFH option

Salesforce
Co-occurring Skills and Capabilities with WFH Options by Category

The follow tables expand on the table above by listing co-occurrences grouped by category. The same employment type, locality and period is covered with up to 20 co-occurrences shown in each of the following categories:

Application Platforms
1 21 (6.71%) Microsoft Exchange
2 19 (6.07%) SharePoint
3 18 (5.75%) CMS
4 7 (2.24%) Sitecore CMS
5 6 (1.92%) Confluence
6 4 (1.28%) Drupal
7 2 (0.64%) Umbraco
8 1 (0.32%) Apache Airflow
8 1 (0.32%) IIS
8 1 (0.32%) Moodle
8 1 (0.32%) Totara
Applications
1 50 (15.97%) Microsoft Excel
2 29 (9.27%) Microsoft Office
3 18 (5.75%) Microsoft PowerPoint
4 4 (1.28%) Adobe Premiere
4 4 (1.28%) Photoshop
5 1 (0.32%) Chatbot
5 1 (0.32%) Microsoft Project
5 1 (0.32%) MS Visio
5 1 (0.32%) Spreadsheet
Business Applications
1 27 (8.63%) Salesforce CRM
2 19 (6.07%) NetSuite
3 11 (3.51%) JDE OneWorld
4 9 (2.88%) Dynamics CRM
5 2 (0.64%) Odoo
6 1 (0.32%) Oracle ERP
6 1 (0.32%) SAP S/4HANA
6 1 (0.32%) Summit
Cloud Services
1 42 (13.42%) Microsoft 365
2 39 (12.46%) Power Platform
3 32 (10.22%) SaaS
4 16 (5.11%) AWS
4 16 (5.11%) Azure
4 16 (5.11%) Google Analytics
5 13 (4.15%) Entra ID
6 11 (3.51%) Boomi
7 10 (3.19%) Salesforce Service Cloud
8 9 (2.88%) Google Workspace
9 8 (2.56%) Salesforce Sales Cloud
9 8 (2.56%) Zapier
10 6 (1.92%) Salesforce Commerce Cloud
11 5 (1.60%) GCP
12 4 (1.28%) Canva
12 4 (1.28%) Fivetran
12 4 (1.28%) Power Automate
12 4 (1.28%) Snowflake
13 3 (0.96%) Dynamics 365
13 3 (0.96%) Google Ads
Communications & Networking
1 3 (0.96%) DNS
1 3 (0.96%) SMS
2 2 (0.64%) DHCP
2 2 (0.64%) TCP/IP
2 2 (0.64%) VLAN
2 2 (0.64%) Wi-Fi
3 1 (0.32%) FTP
3 1 (0.32%) HTTP
3 1 (0.32%) SMTP
3 1 (0.32%) SSL
3 1 (0.32%) Unified Communications
3 1 (0.32%) WAN
Database & Business Intelligence
1 39 (12.46%) Power BI
2 19 (6.07%) Tableau
3 8 (2.56%) Data Warehouse
4 4 (1.28%) SQL Server
5 3 (0.96%) Data Mining
5 3 (0.96%) MySQL
6 2 (0.64%) Relational Database
7 1 (0.32%) Azure SQL Database
7 1 (0.32%) Data Lake
7 1 (0.32%) PostgreSQL
Development Applications
1 11 (3.51%) JIRA
2 3 (0.96%) Visual Studio Code
3 2 (0.64%) Git
4 1 (0.32%) kappa
4 1 (0.32%) Log4Net
4 1 (0.32%) Selenium
4 1 (0.32%) Team Foundation Server
General
1 125 (39.94%) Social Skills
2 72 (23.00%) Marketing
3 68 (21.73%) Finance
4 64 (20.45%) Analytical Skills
5 28 (8.95%) Presentation Skills
6 25 (7.99%) Inclusion and Diversity
6 25 (7.99%) Public Sector
7 24 (7.67%) German Language
8 18 (5.75%) Advertising
9 14 (4.47%) Retail
10 13 (4.15%) Publishing
11 11 (3.51%) Organisational Skills
12 10 (3.19%) Legal
13 7 (2.24%) Manufacturing
14 6 (1.92%) Local Government
15 4 (1.28%) Brand Awareness
15 4 (1.28%) Law
15 4 (1.28%) Pharmaceutical
15 4 (1.28%) Public Speaking
16 3 (0.96%) Billing
Job Titles
1 34 (10.86%) Senior
2 33 (10.54%) Developer
3 25 (7.99%) Lead
4 23 (7.35%) Consultant
5 21 (6.71%) Administrator
5 21 (6.71%) Information Security Specialist
5 21 (6.71%) Information Specialist
5 21 (6.71%) Security Specialist
6 19 (6.07%) Analyst
6 19 (6.07%) Architect
6 19 (6.07%) Project Manager
7 18 (5.75%) Salesforce Administrator
7 18 (5.75%) Salesforce Developer
8 15 (4.79%) IT Manager
9 14 (4.47%) Solutions Architect
10 12 (3.83%) Salesforce Consultant
11 11 (3.51%) Data Manager
11 11 (3.51%) NetSuite Developer
12 10 (3.19%) Account Manager
13 9 (2.88%) Operations Manager
Libraries, Frameworks & Software Standards
1 21 (6.71%) SailPoint
2 18 (5.75%) HTML
3 17 (5.43%) Lightning Web Components
4 15 (4.79%) CSS
5 14 (4.47%) REST
5 14 (4.47%) SOAP
6 13 (4.15%) XML
7 12 (3.83%) jQuery
7 12 (3.83%) JSON
8 11 (3.51%) CSS3
8 11 (3.51%) Hibernate
8 11 (3.51%) Web Services
9 6 (1.92%) Middleware
9 6 (1.92%) Visualforce
10 5 (1.60%) .NET
11 3 (0.96%) Laravel
12 2 (0.64%) AngularJS
12 2 (0.64%) ASP.NET
12 2 (0.64%) Vue
13 1 (0.32%) .NET Framework
Miscellaneous
1 54 (17.25%) Management Information System
2 25 (7.99%) Self-Motivation
3 22 (7.03%) Virtual Team
4 21 (6.71%) Social Media
5 13 (4.15%) Product Ownership
6 12 (3.83%) Blog
7 11 (3.51%) Onboarding
8 10 (3.19%) Life Science
9 9 (2.88%) Analytical Mindset
10 5 (1.60%) Legacy Systems
11 4 (1.28%) Cloud Native
11 4 (1.28%) Data Structures
11 4 (1.28%) NHS
12 3 (0.96%) Educational Technology
12 3 (0.96%) IoT
12 3 (0.96%) Tandem
13 2 (0.64%) Enterprise Software
13 2 (0.64%) Marketing Technology
14 1 (0.32%) Handset
14 1 (0.32%) Learning Management System
Operating Systems
1 4 (1.28%) Windows
2 2 (0.64%) Debian
2 2 (0.64%) Linux
2 2 (0.64%) SUSE
2 2 (0.64%) Ubuntu
3 1 (0.32%) Windows Server
Processes & Methodologies
1 109 (34.82%) CRM
2 79 (25.24%) Problem-Solving
3 63 (20.13%) Agile
4 58 (18.53%) Decision-Making
5 50 (15.97%) Analytics
6 49 (15.65%) Continuous Improvement
7 48 (15.34%) Project Management
8 47 (15.02%) Business Intelligence
9 42 (13.42%) Collaborative Working
10 38 (12.14%) Visualisation
11 36 (11.50%) Data Management
11 36 (11.50%) Mentoring
12 35 (11.18%) Data Visualisation
13 32 (10.22%) Information Security
14 31 (9.90%) User Experience
15 30 (9.58%) Roadmaps
16 29 (9.27%) Customer Service
16 29 (9.27%) Stakeholder Management
17 27 (8.63%) Actionable Insight
18 25 (7.99%) Risk Management
Programming Languages
1 38 (12.14%) SQL
2 21 (6.71%) PowerShell
3 20 (6.39%) JavaScript
4 17 (5.43%) Apex Code
5 6 (1.92%) PHP
6 4 (1.28%) Python
6 4 (1.28%) T-SQL
7 3 (0.96%) SOQL
8 2 (0.64%) C#
8 2 (0.64%) PL/SQL
9 1 (0.32%) C
9 1 (0.32%) Java
9 1 (0.32%) R
9 1 (0.32%) TypeScript
Qualifications
1 83 (26.52%) Degree
2 17 (5.43%) Computer Science Degree
3 16 (5.11%) PMI Certification
4 15 (4.79%) PMP
5 12 (3.83%) CISSP
6 7 (2.24%) DBS Check
7 5 (1.60%) Master's Degree
7 5 (1.60%) Numerate Degree
8 3 (0.96%) Security Cleared
9 1 (0.32%) SC Cleared
Quality Assurance & Compliance
1 15 (4.79%) Accessibility
2 11 (3.51%) Data Quality
3 10 (3.19%) QA
4 9 (2.88%) GDPR
5 4 (1.28%) Cyber Essentials
6 3 (0.96%) PMBOK
7 2 (0.64%) 21 CFR Part 11
7 2 (0.64%) GMP
8 1 (0.32%) Actionable Recommendations
8 1 (0.32%) Disclosure Scotland
8 1 (0.32%) ISO/IEC 27001
8 1 (0.32%) SLA
System Software
1 23 (7.35%) Active Directory
2 2 (0.64%) VMware ESXi
2 2 (0.64%) VMware Infrastructure
2 2 (0.64%) vSphere
3 1 (0.32%) Docker
Systems Management
1 2 (0.64%) Systems Management Server (SMS)
2 1 (0.32%) Microsoft Intune
2 1 (0.32%) Terraform
Vendors
1 58 (18.53%) Microsoft
2 33 (10.54%) Google
3 21 (6.71%) Okta
4 14 (4.47%) Oracle
4 14 (4.47%) SAP
5 13 (4.15%) Dell
6 10 (3.19%) HubSpot
7 9 (2.88%) Salesforce Marketing Cloud
8 7 (2.24%) Ahrefs
8 7 (2.24%) IBM
8 7 (2.24%) Screaming Frog
8 7 (2.24%) Sitecore
9 6 (1.92%) Adyen
9 6 (1.92%) ServiceNow
10 5 (1.60%) MuleSoft
10 5 (1.60%) Orchard
11 4 (1.28%) Conga
11 4 (1.28%) Pardot
11 4 (1.28%) TippingPoint
11 4 (1.28%) Xero