Statistics Jobs

Statistics
UK

The table below provides summary statistics for permanent job vacancies requiring Statistics skills. It includes a benchmarking guide to the annual salaries offered in vacancies that cited Statistics over the 6 months leading up to 17 July 2025, comparing them to the same period in the previous two years.

6 months to
17 Jul 2025
Same period 2024 Same period 2023
Rank 279 306 368
Rank change year-on-year +27 +62 -112
Permanent jobs citing Statistics 645 914 738
As % of all permanent jobs advertised in the UK 1.07% 0.91% 0.87%
As % of the Processes & Methodologies category 1.20% 1.10% 0.91%
Number of salaries quoted 182 425 530
10th Percentile £28,025 £26,500 £32,770
25th Percentile £37,500 £35,500 £43,750
Median annual salary (50th Percentile) £53,744 £54,043 £60,000
Median % change year-on-year -0.55% -9.93% +8.70%
75th Percentile £73,750 £75,000 £77,500
90th Percentile £97,250 £100,000 £101,375
UK excluding London median annual salary £43,710 £49,742 £49,000
% change year-on-year -12.13% +1.51% -2.00%

All Process and Methodology Skills
UK

Statistics falls under the Processes and Methodologies category. For comparison with the information above, the following table provides summary statistics for all permanent job vacancies requiring process or methodology skills.

Permanent vacancies with a requirement for process or methodology skills 53,944 82,826 80,895
As % of all permanent jobs advertised in the UK 89.68% 82.49% 95.48%
Number of salaries quoted 28,417 56,101 51,969
10th Percentile £27,500 £30,000 £33,750
25th Percentile £38,000 £40,000 £45,000
Median annual salary (50th Percentile) £55,000 £55,000 £60,249
Median % change year-on-year - -8.71% +0.42%
75th Percentile £73,886 £72,500 £80,000
90th Percentile £95,000 £92,500 £100,000
UK excluding London median annual salary £50,000 £50,000 £55,000
% change year-on-year - -9.09% +4.76%

Statistics
Job Vacancy Trend

Job postings citing Statistics as a proportion of all IT jobs advertised.
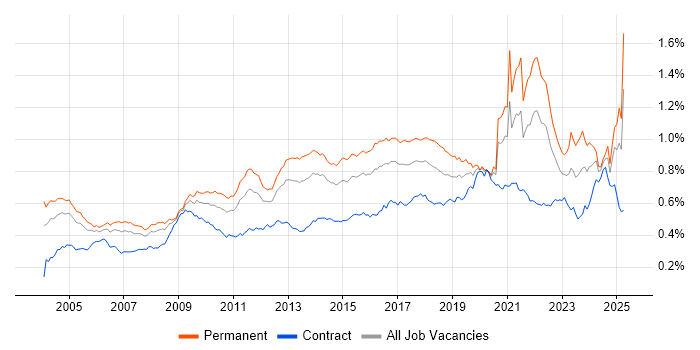
Job vacancy trend for Statistics in the UK

Statistics
Salary Trend

3-month moving average salary quoted in jobs citing Statistics.

Salary trend for Statistics in the UK

Statistics
Salary Histogram

Salary distribution for jobs citing Statistics over the 6 months to 17 July 2025.

Salary histogram for Statistics in the UK

Statistics
Top 18 Job Locations

The table below looks at the demand and provides a guide to the median salaries quoted in IT jobs citing Statistics within the UK over the 6 months to 17 July 2025. The 'Rank Change' column provides an indication of the change in demand within each location based on the same 6 month period last year.

Location Rank Change
on Same Period
Last Year
Matching
Permanent
IT Job Ads
Median Salary
Past 6 Months
Median Salary
% Change
on Same Period
Last Year
Live
Jobs
England -13 536 £52,500 -4.55% 686
Work from Home +76 421 £45,136 -17.93% 275
UK excluding London +146 418 £43,710 -12.13% 244
London -90 169 £80,000 +33.33% 494
North of England +78 97 £55,000 +22.22% 52
South West +119 87 £35,536 -43.14% 22
South East +51 68 £42,500 -22.73% 71
Midlands +56 62 £45,000 +5.88% 36
North West +28 60 £55,000 +20.22% 36
East of England +37 48 £25,000 -64.29% 27
Scotland +119 46 £41,563 -33.02% 20
East Midlands +44 33 £40,000 -11.11% 11
West Midlands +43 29 £55,000 +44.74% 25
Yorkshire +45 27 £55,000 +11.13% 15
North East +36 10 - - 1
Wales +23 8 £69,000 +62.35% 13
Northern Ireland +37 1 - - 10
Isle of Man - 1 - -

Statistics
Co-occurring Skills and Capabilities by Category

The follow tables expand on the table above by listing co-occurrences grouped by category. The same employment type, locality and period is covered with up to 20 co-occurrences shown in each of the following categories:

Application Platforms
1 25 (3.88%) Jupyter
2 13 (2.02%) Microsoft Exchange
3 9 (1.40%) Apache Spark
4 7 (1.09%) SAS
5 6 (0.93%) Apache Airflow
6 4 (0.62%) SharePoint
7 3 (0.47%) WordPress
8 2 (0.31%) Apache
8 2 (0.31%) R Markdown
Applications
1 181 (28.06%) Chatbot
2 48 (7.44%) Microsoft Excel
3 14 (2.17%) Microsoft PowerPoint
4 13 (2.02%) Microsoft Office
5 3 (0.47%) Adobe Premiere
5 3 (0.47%) Final Cut Pro
5 3 (0.47%) Photoshop
5 3 (0.47%) Spreadsheet
6 1 (0.16%) GNU Octave
6 1 (0.16%) Stata
Business Applications
1 1 (0.16%) Elite 3E
1 1 (0.16%) Oracle EBS
1 1 (0.16%) Oracle ERP
Cloud Services
1 108 (16.74%) Azure
2 88 (13.64%) AWS
3 52 (8.06%) Power Platform
4 51 (7.91%) Amazon EKS
5 49 (7.60%) AWS CloudFormation
6 22 (3.41%) SaaS
7 17 (2.64%) Adobe Analytics
8 16 (2.48%) GCP
9 13 (2.02%) Amazon SageMaker
10 12 (1.86%) Microsoft 365
11 9 (1.40%) Azure Machine Learning
11 9 (1.40%) Google Analytics
12 7 (1.09%) GitHub
13 6 (0.93%) Canva
14 4 (0.62%) Azure DevOps
14 4 (0.62%) Azure Synapse Analytics
14 4 (0.62%) ChatGPT
14 4 (0.62%) Google Workspace
15 3 (0.47%) Cloud Computing
15 3 (0.47%) Prefect
Communications & Networking
1 10 (1.55%) LAN
1 10 (1.55%) SD-WAN
1 10 (1.55%) WAN
2 8 (1.24%) LTE
2 8 (1.24%) VSAT
3 6 (0.93%) 802.11
3 6 (0.93%) Intranet
3 6 (0.93%) Wireless
4 4 (0.62%) Wi-Fi
5 3 (0.47%) FTP
6 2 (0.31%) Firewall
6 2 (0.31%) Network Security
7 1 (0.16%) Broadband
7 1 (0.16%) Cisco ISE
7 1 (0.16%) Cisco Nexus
7 1 (0.16%) Internet
7 1 (0.16%) Multicast
7 1 (0.16%) VPN
7 1 (0.16%) WLAN
Database & Business Intelligence
1 70 (10.85%) Big Data
2 54 (8.37%) Tableau
3 52 (8.06%) Power BI
4 50 (7.75%) Elasticsearch
5 20 (3.10%) SQL Server
6 19 (2.95%) Metadata
7 14 (2.17%) SQL Server Reporting Services
8 13 (2.02%) Data Hub
8 13 (2.02%) SQL CLR
8 13 (2.02%) SQL Server Analysis Services
9 10 (1.55%) Data Mining
10 8 (1.24%) NoSQL
11 7 (1.09%) Data Warehouse
12 6 (0.93%) Relational Database
13 4 (0.62%) Data Lake
14 3 (0.47%) EDRMS
14 3 (0.47%) Hadoop
15 2 (0.31%) Electronic Patient Records
15 2 (0.31%) MongoDB
15 2 (0.31%) Oracle Reports
Development Applications
1 36 (5.58%) Git
2 5 (0.78%) MLflow
3 3 (0.47%) RStudio
4 1 (0.16%) GitLab
4 1 (0.16%) gulp
4 1 (0.16%) Jenkins
4 1 (0.16%) JIRA
4 1 (0.16%) Katalon Studio
4 1 (0.16%) PostCSS
4 1 (0.16%) rollup.js
4 1 (0.16%) Selenium
4 1 (0.16%) Sonatype Nexus
4 1 (0.16%) Subversion
4 1 (0.16%) Vite
General
1 171 (26.51%) Finance
2 167 (25.89%) Analytical Skills
3 119 (18.45%) Inclusion and Diversity
4 113 (17.52%) Social Skills
5 46 (7.13%) Law
6 39 (6.05%) Marketing
7 37 (5.74%) Retail
8 31 (4.81%) Presentation Skills
9 29 (4.50%) Games
9 29 (4.50%) Legal
10 25 (3.88%) Banking
10 25 (3.88%) Front Office
11 23 (3.57%) Manufacturing
12 19 (2.95%) Telecoms
13 13 (2.02%) Advertising
13 13 (2.02%) Back Office
13 13 (2.02%) Public Sector
14 12 (1.86%) Pharmaceutical
15 10 (1.55%) Automotive
16 9 (1.40%) Billing
Job Titles
1 184 (28.53%) Trainer
2 108 (16.74%) Data Scientist
3 99 (15.35%) Analyst
4 87 (13.49%) Developer
5 81 (12.56%) Senior
6 61 (9.46%) Data Analyst
7 49 (7.60%) Software Developer
8 43 (6.67%) Senior Data Scientist
9 32 (4.96%) Support Engineer
10 24 (3.72%) Technical Engineer
10 24 (3.72%) Technical Support
10 24 (3.72%) Technical Support Engineer
11 23 (3.57%) Statistician
12 21 (3.26%) Senior Analyst
13 17 (2.64%) Mathematician
13 17 (2.64%) Senior Developer
14 16 (2.48%) Qualitative Analyst
14 16 (2.48%) Quantitative Analyst
15 15 (2.33%) Lead
16 13 (2.02%) SaaS Developer
Libraries, Frameworks & Software Standards
1 70 (10.85%) Pandas
2 54 (8.37%) .NET
3 49 (7.60%) Node.js
4 33 (5.12%) scikit-learn
4 33 (5.12%) TensorFlow
5 20 (3.10%) PyTorch
6 18 (2.79%) NumPy
7 12 (1.86%) Keras
7 12 (1.86%) PySpark
8 9 (1.40%) HTML
9 8 (1.24%) Kafka
10 7 (1.09%) CSS
11 6 (0.93%) 802.1X
11 6 (0.93%) Hugging Face
12 5 (0.78%) Lightning Web Components
12 5 (0.78%) React
13 4 (0.62%) XGBoost
14 3 (0.47%) Google JAX
14 3 (0.47%) JAX
14 3 (0.47%) ONNX
Miscellaneous
1 113 (17.52%) Algorithms
2 95 (14.73%) Cyberattack
3 25 (3.88%) Management Information System
4 19 (2.95%) Self-Motivation
5 15 (2.33%) Credit Risk
6 13 (2.02%) Private Cloud
7 10 (1.55%) Renewable Energy
8 9 (1.40%) Digital Media
9 8 (1.24%) Onboarding
9 8 (1.24%) Social Media
10 7 (1.09%) Data Structures
11 6 (0.93%) Blog
11 6 (0.93%) Driving Licence
12 5 (0.78%) Distributed Systems
12 5 (0.78%) FMCG
13 4 (0.62%) Equities
13 4 (0.62%) Hedge funds
13 4 (0.62%) NHS
13 4 (0.62%) Product Ownership
13 4 (0.62%) Robotics
Operating Systems
1 58 (8.99%) Linux
2 49 (7.60%) Android
3 4 (0.62%) Unix
4 3 (0.47%) Windows
4 3 (0.47%) Windows Server
5 1 (0.16%) FreeRTOS
Processes & Methodologies
1 457 (70.85%) Mathematics
2 325 (50.39%) Computer Science
3 305 (47.29%) Artificial Intelligence
4 189 (29.30%) Data Science
5 182 (28.22%) Conversational UI
6 170 (26.36%) Analytics
7 155 (24.03%) Machine Learning
8 153 (23.72%) Problem-Solving
9 137 (21.24%) Visualisation
10 128 (19.84%) Data Analysis
11 107 (16.59%) Software Engineering
12 90 (13.95%) Decision-Making
13 75 (11.63%) Data Analytics
14 73 (11.32%) Agile
15 64 (9.92%) CI/CD
16 63 (9.77%) Predictive Modelling
17 62 (9.61%) Business Intelligence
18 57 (8.84%) Collaborative Working
19 55 (8.53%) Containerisation
19 55 (8.53%) OO
Programming Languages
1 286 (44.34%) Python
2 138 (21.40%) SQL
3 91 (14.11%) Java
4 79 (12.25%) JavaScript
5 74 (11.47%) C++
6 49 (7.60%) Go
6 49 (7.60%) R
6 49 (7.60%) Rust
7 21 (3.26%) T-SQL
8 16 (2.48%) C#
9 13 (2.02%) MATLAB
10 9 (1.40%) C
11 3 (0.47%) F#
11 3 (0.47%) Groovy
12 2 (0.31%) Scala
12 2 (0.31%) TypeScript
12 2 (0.31%) VB.NET
13 1 (0.16%) Data Analysis Expressions
13 1 (0.16%) Julia
13 1 (0.16%) VBA
Qualifications
1 463 (71.78%) Degree
2 307 (47.60%) Master's Degree
3 264 (40.93%) PhD
4 120 (18.60%) Security Cleared
5 96 (14.88%) DV Cleared
6 52 (8.06%) Numerate Degree
7 31 (4.81%) Computer Science Degree
8 25 (3.88%) DBS Check
9 22 (3.41%) SC Cleared
10 13 (2.02%) Postgraduate
11 9 (1.40%) Cisco Certification
12 8 (1.24%) CCNA
12 8 (1.24%) JNCIA
13 6 (0.93%) GCSC
14 4 (0.62%) MBA
15 2 (0.31%) CFA
15 2 (0.31%) CISM
15 2 (0.31%) CISSP
16 1 (0.16%) BPSS Clearance
16 1 (0.16%) ISTQB
Quality Assurance & Compliance
1 25 (3.88%) Data Quality
2 14 (2.17%) GDPR
3 7 (1.09%) IFRS
3 7 (1.09%) IFRS 9
4 5 (0.78%) Accessibility
5 4 (0.62%) CDISC
6 3 (0.47%) Actionable Recommendations
6 3 (0.47%) QA
7 2 (0.31%) NIST
8 1 (0.16%) California Consumer Privacy Act
8 1 (0.16%) DICOM
8 1 (0.16%) Disclosure Scotland
8 1 (0.16%) HIPAA
8 1 (0.16%) HL7
8 1 (0.16%) MiFID
8 1 (0.16%) SNOMED CT
System Software
1 82 (12.71%) Docker
2 13 (2.02%) VMware Infrastructure
3 9 (1.40%) Virtual Desktop
Systems Management
1 79 (12.25%) Kubernetes
2 53 (8.22%) Terraform
3 51 (7.91%) Ansible
4 13 (2.02%) Failover Clustering
5 3 (0.47%) Kubeflow
6 1 (0.16%) Cisco CUCM
Vendors
1 181 (28.06%) PayPal
2 64 (9.92%) Microsoft
3 27 (4.19%) Databricks
4 21 (3.26%) Adobe
5 20 (3.10%) Google
6 17 (2.64%) Salesforce
7 13 (2.02%) VMware
8 9 (1.40%) Citrix
8 9 (1.40%) Marketo
8 9 (1.40%) Salesforce Marketing Cloud
9 8 (1.24%) Freshdesk
10 7 (1.09%) Instagram
11 4 (0.62%) Capita
11 4 (0.62%) Oracle
12 3 (0.47%) Bloomberg
12 3 (0.47%) Facebook
13 2 (0.31%) Omniture
13 2 (0.31%) SAP
13 2 (0.31%) Talend
13 2 (0.31%) Zoho