Local Government Jobs with Work from Home Options

Local Government (Local Authority, Local Council)
UK > Work from Home

The table below looks at the prevalence of the term Local Government in permanent job vacancies with an option to work from home (WFH). Included is a benchmarking guide to the salaries offered in vacancies that have cited Local Government over the 6 months to 27 May 2024 with a comparison to the same period over the previous 2 years.

6 months to
27 May 2024
Same period 2023 Same period 2022
Rank 357 248 377
Rank change year-on-year -109 +129 +54
Permanent jobs citing Local Government 254 554 661
As % of all permanent jobs with a WFH option 0.74% 1.38% 0.91%
As % of the General category 1.22% 2.10% 1.42%
Number of salaries quoted 197 196 223
10th Percentile £32,500 £36,466 £31,902
25th Percentile £35,462 £42,250 £37,500
Median annual salary (50th Percentile) £46,068 £53,000 £45,000
Median % change year-on-year -13.08% +17.78% +1.49%
75th Percentile £53,750 £70,000 £62,817
90th Percentile £71,700 £78,750 £71,800
UK median annual salary £39,882 £50,000 £45,250
% change year-on-year -20.24% +10.50% +0.56%

All General Skills
Work from Home

Local Government is in the General Skills category. The following table is for comparison with the above and provides summary statistics for all permanent job vacancies with a WFH option and a requirement for common skills.

Permanent vacancies with a requirement for common skills 20,902 26,328 46,644
As % of all permanent jobs with a WFH option 61.15% 65.80% 63.94%
Number of salaries quoted 15,103 17,567 24,951
10th Percentile £31,750 £36,250 £35,000
25th Percentile £41,252 £46,570 £45,000
Median annual salary (50th Percentile) £55,000 £62,500 £60,000
Median % change year-on-year -12.00% +4.17% +9.09%
75th Percentile £75,000 £82,548 £79,600
90th Percentile £95,000 £103,750 £95,000
UK median annual salary £52,500 £60,000 £60,000
% change year-on-year -12.50% - +9.09%

Local Government
Trend for Jobs with a WFH Option

Job vacancies with a work from home option citing Local Government as a proportion of all IT jobs advertised.
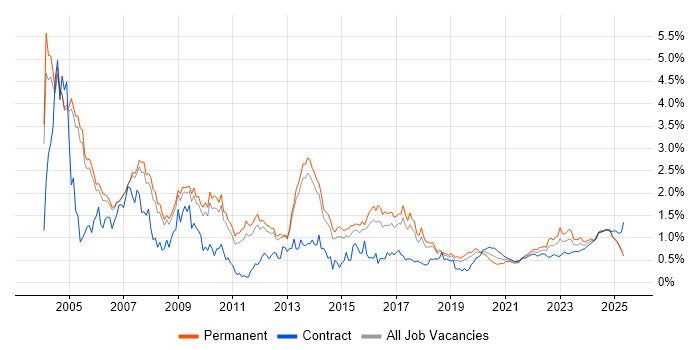
Local Government trend for jobs with a WFH option

Local Government
Salary Trend for Jobs with a WFH Option

3-month moving average salary quoted in job vacancies with a work from home option citing Local Government.

Local Government salary trend for jobs with a WFH option

Local Government
Salary Histogram for Jobs with a WFH Option

Salary distribution for jobs with a work from home option citing Local Government over the 6 months to 27 May 2024.

Local Government salary histogram for jobs with a WFH option

Local Government
Co-occurring Skills and Capabilities with WFH Options by Category

The follow tables expand on the table above by listing co-occurrences grouped by category. The same employment type, locality and period is covered with up to 20 co-occurrences shown in each of the following categories:

Application Platforms
1 27 (10.63%) Apache
1 27 (10.63%) IIS
1 27 (10.63%) Tomcat
2 9 (3.54%) SharePoint
3 4 (1.57%) ArcGIS
4 3 (1.18%) CMS
4 3 (1.18%) Microsoft Exchange
4 3 (1.18%) Totara
Applications
1 23 (9.06%) Microsoft Office
2 18 (7.09%) Microsoft Excel
3 9 (3.54%) AutoCAD
4 5 (1.97%) Microsoft PowerPoint
5 1 (0.39%) Acrobat
5 1 (0.39%) Microsoft Project
Business Applications
1 45 (17.72%) NEC Housing
2 2 (0.79%) Oracle ERP
3 1 (0.39%) Primavera
Cloud Services
1 30 (11.81%) Power Platform
2 25 (9.84%) Azure
3 16 (6.30%) Microsoft 365
4 13 (5.12%) SaaS
5 7 (2.76%) Azure DevOps
5 7 (2.76%) PowerApps
6 6 (2.36%) Power Automate
7 5 (1.97%) Entra ID
8 3 (1.18%) OneDrive
9 2 (0.79%) AWS
9 2 (0.79%) Cloud Computing
9 2 (0.79%) Google Analytics
9 2 (0.79%) Google Tag Manager
9 2 (0.79%) Siteimprove
10 1 (0.39%) Dynamics 365
10 1 (0.39%) OCI
10 1 (0.39%) WhatsApp
Communications & Networking
1 5 (1.97%) Firewall
1 5 (1.97%) WAN
2 4 (1.57%) TETRA
2 4 (1.57%) Wireless
3 3 (1.18%) LAN
4 2 (0.79%) DHCP
4 2 (0.79%) Network Security
5 1 (0.39%) TCP/IP
5 1 (0.39%) Unified Communications
5 1 (0.39%) VoIP
5 1 (0.39%) VPN
Database & Business Intelligence
1 32 (12.60%) Oracle Database
2 24 (9.45%) Power BI
3 17 (6.69%) Data Warehouse
4 15 (5.91%) SQL Server
5 13 (5.12%) SQL Server Reporting Services
6 11 (4.33%) SQL Server Integration Services
7 9 (3.54%) BusinessObjects
7 9 (3.54%) Relational Database
7 9 (3.54%) Semantic Layer
8 7 (2.76%) BusinessObjects Web Intelligence
8 7 (2.76%) GIS
8 7 (2.76%) Oracle Reports
9 5 (1.97%) Tableau
10 4 (1.57%) MS Access
10 4 (1.57%) SQL Server Analysis Services
11 3 (1.18%) Geospatial Data
12 2 (0.79%) QlikView
13 1 (0.39%) Metadata
13 1 (0.39%) NoSQL
Development Applications
1 7 (2.76%) SQL Server Management Studio (SSMS)
1 7 (2.76%) Visual Studio
2 5 (1.97%) JIRA
2 5 (1.97%) Oracle APEX
3 3 (1.18%) Oracle Forms
3 3 (1.18%) Selenium
3 3 (1.18%) Team Foundation Server
General
1 96 (37.80%) Finance
2 71 (27.95%) Social Skills
3 69 (27.17%) Public Sector
4 52 (20.47%) Police
5 35 (13.78%) Marketing
6 26 (10.24%) Analytical Skills
7 23 (9.06%) Inclusion and Diversity
8 17 (6.69%) Legal
9 16 (6.30%) Fire and Rescue
10 11 (4.33%) Retail
11 7 (2.76%) Presentation Skills
12 6 (2.36%) Social Housing
13 5 (1.97%) Influencing Skills
14 4 (1.57%) Organisational Skills
15 3 (1.18%) Environmental Health
15 3 (1.18%) Portuguese Language
16 2 (0.79%) Electronics
16 2 (0.79%) Law
17 1 (0.39%) Back Office
17 1 (0.39%) Games
Job Titles
1 45 (17.72%) Senior
2 36 (14.17%) Analyst
3 32 (12.60%) Applications Support
4 21 (8.27%) Lead
4 21 (8.27%) Project Manager
5 16 (6.30%) Developer
5 16 (6.30%) Development Manager
6 11 (4.33%) Data Analyst
7 10 (3.94%) Architect
8 9 (3.54%) Bid Writer
8 9 (3.54%) Consultant
8 9 (3.54%) Senior Bid Writer
8 9 (3.54%) Trainer
9 7 (2.76%) Business Analyst
9 7 (2.76%) Senior Manager
10 6 (2.36%) Business Intelligence Developer
10 6 (2.36%) Senior Consultant
11 5 (1.97%) Oracle Developer
11 5 (1.97%) PL/SQL Developer
11 5 (1.97%) Senior Developer
Libraries, Frameworks & Software Standards
1 32 (12.60%) Web Services
2 7 (2.76%) CSS
2 7 (2.76%) HTML
3 6 (2.36%) JSON
3 6 (2.36%) XML
4 5 (1.97%) REST
4 5 (1.97%) Ruby on Rails
4 5 (1.97%) SOAP
5 3 (1.18%) .NET
6 2 (0.79%) TAPI
7 1 (0.39%) HTML5 Canvas
7 1 (0.39%) jQuery
7 1 (0.39%) Twitter Bootstrap
Miscellaneous
1 27 (10.63%) Public Cloud
2 21 (8.27%) Management Information System
3 20 (7.87%) Driving Licence
4 17 (6.69%) Social Media
5 13 (5.12%) Onboarding
6 9 (3.54%) Blog
7 7 (2.76%) Self-Motivation
8 6 (2.36%) Housing Association
8 6 (2.36%) Legacy Systems
8 6 (2.36%) Renewable Energy
9 5 (1.97%) Acoustics
9 5 (1.97%) Low-Code
10 4 (1.57%) Freedom of Information
10 4 (1.57%) IoT
10 4 (1.57%) NHS
11 3 (1.18%) Learning Management System
11 3 (1.18%) Product Ownership
11 3 (1.18%) PropTech
12 2 (0.79%) Data Protection Act
12 2 (0.79%) SystemC
Operating Systems
1 37 (14.57%) Windows
2 29 (11.42%) Unix
3 27 (10.63%) Linux
3 27 (10.63%) Solaris
4 5 (1.97%) Windows 10
5 2 (0.79%) Windows Server
6 1 (0.39%) Android
6 1 (0.39%) Apple iOS
6 1 (0.39%) VMS
6 1 (0.39%) Windows 7
6 1 (0.39%) Windows 8
Processes & Methodologies
1 64 (25.20%) Project Management
2 36 (14.17%) Agile
3 33 (12.99%) Continuous Improvement
4 32 (12.60%) Problem-Solving
5 30 (11.81%) Business Intelligence
5 30 (11.81%) Data Security
6 27 (10.63%) Network Architecture
6 27 (10.63%) Server Management
6 27 (10.63%) Task Automation
7 26 (10.24%) Customer Service
7 26 (10.24%) Service Delivery
8 24 (9.45%) Change Management
9 23 (9.06%) Analytics
9 23 (9.06%) Visualisation
10 22 (8.66%) PRINCE2
11 21 (8.27%) ITIL
11 21 (8.27%) Project Delivery
12 20 (7.87%) Business Analysis
13 18 (7.09%) Business Development
14 16 (6.30%) Collaborative Working
Programming Languages
1 35 (13.78%) SQL
2 27 (10.63%) Shell Script
3 12 (4.72%) PL/SQL
4 8 (3.15%) T-SQL
5 7 (2.76%) JavaScript
6 6 (2.36%) Python
7 5 (1.97%) Java
7 5 (1.97%) R
7 5 (1.97%) Ruby
8 4 (1.57%) C#
9 2 (0.79%) C
9 2 (0.79%) Data Analysis Expressions
10 1 (0.39%) VB.NET
Qualifications
1 85 (33.46%) Degree
2 44 (17.32%) Security Cleared
3 15 (5.91%) DBS Check
4 11 (4.33%) SC Cleared
5 5 (1.97%) PMP
6 4 (1.57%) Computer Science Degree
6 4 (1.57%) HNC
6 4 (1.57%) HND
7 2 (0.79%) Master's Degree
7 2 (0.79%) PMI Certification
8 1 (0.39%) A+ Certification
8 1 (0.39%) ACCA
8 1 (0.39%) CCNA
8 1 (0.39%) CCNP
8 1 (0.39%) CIMA
8 1 (0.39%) Cisco Certification
8 1 (0.39%) MCP
8 1 (0.39%) MCSE
8 1 (0.39%) Microsoft Certification
8 1 (0.39%) TOGAF Certification
Quality Assurance & Compliance
1 43 (16.93%) Accessibility
2 18 (7.09%) QA
3 13 (5.12%) Data Quality
4 4 (1.57%) PMO
5 2 (0.79%) Actionable Recommendations
5 2 (0.79%) Cyber Essentials
5 2 (0.79%) GDPR
5 2 (0.79%) NIST
6 1 (0.39%) SLA
System Software
1 7 (2.76%) Active Directory
2 5 (1.97%) Firmware
3 2 (0.79%) Embedded Firmware
Systems Management
1 4 (1.57%) Microsoft Intune
Vendors
1 88 (34.65%) Microsoft
2 47 (18.50%) Oracle
3 45 (17.72%) NEC
4 5 (1.97%) Cisco
4 5 (1.97%) Google
5 4 (1.57%) HubSpot
6 3 (1.18%) Civica
7 2 (0.79%) Aruba
7 2 (0.79%) Liquidlogic
7 2 (0.79%) SAP
8 1 (0.39%) Adobe
8 1 (0.39%) Alteryx
8 1 (0.39%) Capita
8 1 (0.39%) Databricks
8 1 (0.39%) GUPTA
8 1 (0.39%) Pega
8 1 (0.39%) Samsung
8 1 (0.39%) ServiceNow
8 1 (0.39%) VMware