Capacity Planning
UK

The following table provides summary statistics for permanent job vacancies with a requirement for Capacity Planning skills. Included is a benchmarking guide to the salaries offered in vacancies that have cited Capacity Planning over the 6 months to 28 November 2023 with a comparison to the same period in the previous 2 years.

6 months to
28 Nov 2023
Same period 2022 Same period 2021
Rank 404 616 624
Rank change year-on-year +212 +8 -138
Permanent jobs citing Capacity Planning 365 536 505
As % of all permanent jobs advertised in the UK 0.67% 0.43% 0.39%
As % of the Processes & Methodologies category 0.71% 0.45% 0.41%
Number of salaries quoted 265 322 335
10th Percentile £31,250 £39,750 £36,443
25th Percentile £46,015 £45,500 £45,000
Median annual salary (50th Percentile) £60,000 £52,500 £55,000
Median % change year-on-year +14.29% -4.55% -4.35%
75th Percentile £72,500 £70,000 £74,000
90th Percentile £85,000 £86,250 £89,500
UK excluding London median annual salary £52,500 £50,000 £50,000
% change year-on-year +5.00% - -9.28%

All Process and Methodology Skills
UK

Capacity Planning is in the Processes and Methodologies category. The following table is for comparison with the above and provides summary statistics for all permanent job vacancies with a requirement for process or methodology skills.

Permanent vacancies with a requirement for process or methodology skills 51,121 120,104 122,523
As % of all permanent jobs advertised in the UK 94.09% 95.72% 95.43%
Number of salaries quoted 36,956 73,203 81,032
10th Percentile £32,500 £34,313 £32,500
25th Percentile £43,750 £45,000 £42,500
Median annual salary (50th Percentile) £60,000 £60,000 £59,000
Median % change year-on-year - +1.69% +7.27%
75th Percentile £80,000 £81,250 £77,500
90th Percentile £98,750 £100,000 £95,000
UK excluding London median annual salary £52,500 £53,000 £50,000
% change year-on-year -0.94% +6.00% +4.17%

Capacity Planning
Job Vacancy Trend

Job postings citing Capacity Planning as a proportion of all IT jobs advertised.
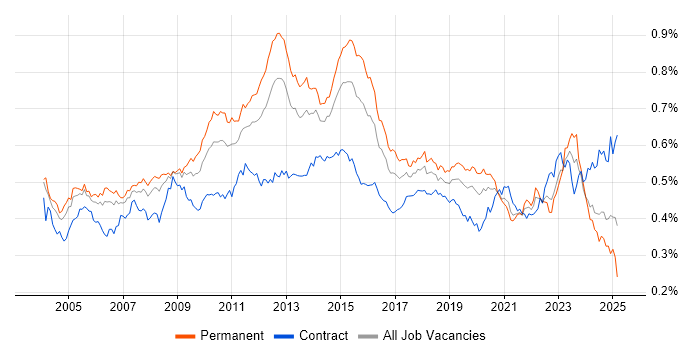
Job vacancy trend for Capacity Planning in the UK

Capacity Planning
Salary Trend

3-month moving average salary quoted in jobs citing Capacity Planning.

Salary trend for Capacity Planning in the UK

Capacity Planning
Salary Histogram

Salary distribution for jobs citing Capacity Planning over the 6 months to 28 November 2023.

Salary histogram for Capacity Planning in the UK

Capacity Planning
Top 17 Job Locations

The table below looks at the demand and provides a guide to the median salaries quoted in IT jobs citing Capacity Planning within the UK over the 6 months to 28 November 2023. The 'Rank Change' column provides an indication of the change in demand within each location based on the same 6 month period last year.

Location Rank Change
on Same Period
Last Year
Matching
Permanent
IT Job Ads
Median Salary
Past 6 Months
Median Salary
% Change
on Same Period
Last Year
Live
Jobs
England +193 303 £60,000 +14.29% 124
UK excluding London +145 247 £52,500 +5.00% 84
Work from Home +223 191 £62,000 +18.10% 56
London +198 98 £77,500 +10.71% 53
North of England +122 68 £50,000 - 21
South East +138 64 £62,500 +4.17% 27
North West +121 43 £52,500 +5.00% 16
Midlands +61 37 £47,017 -7.45% 12
Scotland +45 32 £47,557 -2.94% 5
West Midlands +59 25 £32,500 -35.00% 10
South West +60 24 £47,557 -6.83% 6
Yorkshire +82 23 £48,500 -39.09% 3
East Midlands +37 12 £60,000 +14.29% 2
East of England +112 10 £55,000 +10.00% 9
Wales +12 10 £43,190 -38.30% 3
Northern Ireland +37 2 - - 2
North East +35 2 £48,131 +20.33% 2

Capacity Planning
Co-occurring Skills and Capabilities by Category

The follow tables expand on the table above by listing co-occurrences grouped by category. The same employment type, locality and period is covered with up to 20 co-occurrences shown in each of the following categories:

Application Platforms
1 22 (6.03%) IIS
2 14 (3.84%) SharePoint
3 8 (2.19%) Oracle Service Bus
3 8 (2.19%) WebLogic
4 7 (1.92%) MS Exchange
5 5 (1.37%) Confluence
6 3 (0.82%) Apache
6 3 (0.82%) JBoss
6 3 (0.82%) nginx
7 2 (0.55%) CICS
7 2 (0.55%) Cloud Foundry
8 1 (0.27%) Apache Airflow
8 1 (0.27%) Oracle Workflow
Applications
1 19 (5.21%) Microsoft Excel
2 17 (4.66%) Microsoft Office
3 9 (2.47%) Microsoft PowerPoint
4 8 (2.19%) MS Visio
5 2 (0.55%) Microsoft Project
Business Applications
1 8 (2.19%) Remedy ITSM
2 6 (1.64%) SAP Business One
3 1 (0.27%) Changepoint
3 1 (0.27%) SAP PP
3 1 (0.27%) SAP S/4HANA
3 1 (0.27%) SAP SCM
Cloud Services
1 108 (29.59%) Azure
2 76 (20.82%) AWS
3 60 (16.44%) Microsoft 365
4 32 (8.77%) Cloud Computing
5 30 (8.22%) Entra ID
6 20 (5.48%) IaaS
7 13 (3.56%) SaaS
8 11 (3.01%) GCP
8 11 (3.01%) Power Platform
9 6 (1.64%) AWS CloudFormation
9 6 (1.64%) GitHub
9 6 (1.64%) GitHub Actions
9 6 (1.64%) PaaS
9 6 (1.64%) Serverless
10 5 (1.37%) Apple Pay
10 5 (1.37%) Azure DevOps
11 4 (1.10%) Amazon EC2
11 4 (1.10%) Nutanix
12 3 (0.82%) Amazon S3
12 3 (0.82%) AWS CodePipeline
Communications & Networking
1 48 (13.15%) WAN
2 37 (10.14%) DNS
3 31 (8.49%) Firewall
4 25 (6.85%) DHCP
4 25 (6.85%) LAN
5 22 (6.03%) Wi-Fi
5 22 (6.03%) Wireless
6 21 (5.75%) VPN
7 14 (3.84%) TCP/IP
8 12 (3.29%) Internet
8 12 (3.29%) Network Security
8 12 (3.29%) SD-WAN
9 10 (2.74%) WLAN
10 9 (2.47%) SSL
10 9 (2.47%) VLAN
11 8 (2.19%) IPsec
12 7 (1.92%) BGP
12 7 (1.92%) Cisco ASA
12 7 (1.92%) OSPF
13 6 (1.64%) Remote Desktop
Database & Business Intelligence
1 51 (13.97%) SQL Server
2 33 (9.04%) MySQL
2 33 (9.04%) Relational Database
3 32 (8.77%) RDBMS
4 20 (5.48%) Oracle Database
5 19 (5.21%) NoSQL
6 13 (3.56%) Amazon Redshift
7 11 (3.01%) Data Warehouse
8 9 (2.47%) Power BI
9 8 (2.19%) Oracle Database 10g
9 8 (2.19%) Oracle Database 11g
9 8 (2.19%) VLDB
10 7 (1.92%) PostgreSQL
11 4 (1.10%) Microsoft Analysis Services
11 4 (1.10%) SQL Server Analysis Services
12 2 (0.55%) Amazon RDS
12 2 (0.55%) Elasticsearch
12 2 (0.55%) Oracle Database 12c
12 2 (0.55%) SQL Server Integration Services
12 2 (0.55%) Tableau
Development Applications
1 13 (3.56%) JIRA
2 8 (2.19%) Git
3 6 (1.64%) Jenkins
4 5 (1.37%) GitLab
5 1 (0.27%) Appium
5 1 (0.27%) Cucumber
5 1 (0.27%) Cypress.io
5 1 (0.27%) Gradle
5 1 (0.27%) Maven
5 1 (0.27%) Oracle Forms
5 1 (0.27%) Postman
5 1 (0.27%) REST Assured
5 1 (0.27%) Selenium
5 1 (0.27%) SoapUI
5 1 (0.27%) SonarQube
5 1 (0.27%) Visual Studio Team System
General
1 100 (27.40%) Social Skills
2 84 (23.01%) Finance
3 80 (21.92%) Analytical Skills
4 37 (10.14%) Banking
5 29 (7.95%) Retail
6 17 (4.66%) Inclusion and Diversity
7 16 (4.38%) Influencing Skills
8 14 (3.84%) Documentation Skills
9 12 (3.29%) Games
10 9 (2.47%) Telecoms
11 8 (2.19%) Public Sector
12 6 (1.64%) Organisational Skills
12 6 (1.64%) Presentation Skills
13 5 (1.37%) Legal
13 5 (1.37%) Local Government
14 4 (1.10%) Automotive
14 4 (1.10%) Back Office
14 4 (1.10%) Law
14 4 (1.10%) Manufacturing
15 3 (0.82%) Italian Language
Job Titles
1 58 (15.89%) DBA
2 52 (14.25%) Senior
3 38 (10.41%) Infrastructure Engineer
4 30 (8.22%) MySQL DBA
5 25 (6.85%) Analyst
6 24 (6.58%) Lead
7 22 (6.03%) Administrator
7 22 (6.03%) Network Engineer
8 20 (5.48%) Architect
9 17 (4.66%) Consultant
10 16 (4.38%) Infrastructure Architect
10 16 (4.38%) Senior Manager
11 15 (4.11%) Site Reliability Engineer
12 14 (3.84%) Cloud Engineer
12 14 (3.84%) Developer
12 14 (3.84%) Systems Engineer
13 13 (3.56%) IT Manager
13 13 (3.56%) Java Developer
13 13 (3.56%) Site Engineer
14 12 (3.29%) Oracle DBA
Libraries, Frameworks & Software Standards
1 14 (3.84%) .NET
2 13 (3.56%) REST
3 9 (2.47%) Kafka
3 9 (2.47%) Node.js
4 8 (2.19%) Middleware
5 6 (1.64%) Web Services
6 5 (1.37%) Elastic Stack
6 5 (1.37%) Velocity
7 4 (1.10%) web3js
7 4 (1.10%) XML
8 3 (0.82%) 802.1X
9 2 (0.55%) LDAP
9 2 (0.55%) NestJS
10 1 (0.27%) EDI
10 1 (0.27%) FIX Protocol
10 1 (0.27%) Gherkin
10 1 (0.27%) JSON
10 1 (0.27%) Regular Expression
10 1 (0.27%) SOAP
10 1 (0.27%) YAML
Miscellaneous
1 52 (14.25%) Data Centre
2 38 (10.41%) Public Cloud
3 31 (8.49%) Replication
4 28 (7.67%) Clustering
5 26 (7.12%) Distributed Systems
6 22 (6.03%) Management Information System
7 20 (5.48%) Private Cloud
8 16 (4.38%) Mainframe
8 16 (4.38%) Self-Motivation
9 12 (3.29%) CMDB
9 12 (3.29%) Sports Betting
10 8 (2.19%) Product Ownership
11 7 (1.92%) Onboarding
12 6 (1.64%) Algorithms
13 5 (1.37%) Cyber Threat
13 5 (1.37%) IoT
13 5 (1.37%) NHS
13 5 (1.37%) Web3
14 4 (1.10%) Blockchain
14 4 (1.10%) Cloud Native
Operating Systems
1 109 (29.86%) Windows
2 83 (22.74%) Linux
3 48 (13.15%) Unix
4 37 (10.14%) Windows Server
5 24 (6.58%) Solaris
6 23 (6.30%) Red Hat Enterprise Linux
7 16 (4.38%) HPUX
8 5 (1.37%) CentOS
9 4 (1.10%) Apple iOS
9 4 (1.10%) Mac OS
10 2 (0.55%) Ubuntu
10 2 (0.55%) Windows 10
10 2 (0.55%) zOS
11 1 (0.27%) AIX
11 1 (0.27%) Android
11 1 (0.27%) Rocky
11 1 (0.27%) Windows Server 2012
11 1 (0.27%) Windows Server 2016
11 1 (0.27%) Windows Server 2019
Processes & Methodologies
1 113 (30.96%) Problem-Solving
2 91 (24.93%) Continuous Improvement
3 83 (22.74%) Agile
4 81 (22.19%) Disaster Recovery
5 79 (21.64%) High Availability
6 65 (17.81%) Incident Management
7 61 (16.71%) Roadmaps
8 60 (16.44%) DevOps
9 58 (15.89%) Service Delivery
10 56 (15.34%) ITIL
11 54 (14.79%) CI/CD
12 48 (13.15%) Change Management
12 48 (13.15%) Infrastructure Engineering
13 43 (11.78%) Artificial Intelligence
13 43 (11.78%) Performance Tuning
14 40 (10.96%) Service Management
15 38 (10.41%) Actionable Insight
16 37 (10.14%) Incident Response
16 37 (10.14%) ITSM
17 34 (9.32%) Root Cause Analysis
Programming Languages
1 85 (23.29%) SQL
2 55 (15.07%) Java
3 40 (10.96%) Python
4 36 (9.86%) PowerShell
5 33 (9.04%) Bash
6 14 (3.84%) PL/SQL
7 11 (3.01%) C#
8 9 (2.47%) Go
9 8 (2.19%) Perl
10 3 (0.82%) Kotlin
10 3 (0.82%) Ruby
10 3 (0.82%) T-SQL
11 2 (0.55%) COBOL
11 2 (0.55%) JavaScript
11 2 (0.55%) JCL
11 2 (0.55%) REXX
11 2 (0.55%) Shell Script
12 1 (0.27%) Groovy
12 1 (0.27%) Korn
12 1 (0.27%) TypeScript
Qualifications
1 82 (22.47%) Degree
2 73 (20.00%) Security Cleared
3 55 (15.07%) SC Cleared
4 20 (5.48%) Azure Certification
5 15 (4.11%) Cisco Certification
6 12 (3.29%) Master's Degree
7 10 (2.74%) CCNA
7 10 (2.74%) ITIL Certification
7 10 (2.74%) Microsoft Certification
8 9 (2.47%) CCNP
8 9 (2.47%) Computer Science Degree
9 6 (1.64%) MBA
10 5 (1.37%) PMP
11 4 (1.10%) PMI Certification
12 3 (0.82%) Chartered Engineer
12 3 (0.82%) MCSA
12 3 (0.82%) PRINCE2 Certification
13 2 (0.55%) CCENT
13 2 (0.55%) VMware Certified Professional (VCP)
14 1 (0.27%) CWNA
Quality Assurance & Compliance
1 19 (5.21%) PMO
2 11 (3.01%) SLA
3 9 (2.47%) QA
4 6 (1.64%) Data Quality
5 3 (0.82%) Accessibility
5 3 (0.82%) ISO/IEC 27001
6 2 (0.55%) Cyber Essentials
7 1 (0.27%) GDPR
7 1 (0.27%) NIST
7 1 (0.27%) PCI DSS
System Software
1 59 (16.16%) Active Directory
2 48 (13.15%) VMware Infrastructure
3 22 (6.03%) Hyper-V
4 21 (5.75%) Docker
4 21 (5.75%) VMware NSX
5 8 (2.19%) Oracle RAC
6 7 (1.92%) Virtual Machines
7 6 (1.64%) Firmware
8 5 (1.37%) Virtual Servers
9 4 (1.10%) VMware ESXi
10 3 (0.82%) Squid
10 3 (0.82%) VMware Server
10 3 (0.82%) vSphere
11 2 (0.55%) RACF
11 2 (0.55%) Time Sharing Option
12 1 (0.27%) KVM
12 1 (0.27%) LXC
12 1 (0.27%) PowerHA
12 1 (0.27%) Virtual Desktop
Systems Management
1 26 (7.12%) Ansible
1 26 (7.12%) Kubernetes
2 24 (6.58%) Terraform
3 18 (4.93%) Microsoft Intune
4 11 (3.01%) Oracle RMAN
5 9 (2.47%) Data Guard
5 9 (2.47%) Prometheus
6 8 (2.19%) Grafana
7 6 (1.64%) Nagios
8 5 (1.37%) Icinga
8 5 (1.37%) Puppet
9 4 (1.10%) Active Directory Federation Services
9 4 (1.10%) Jamf Pro
10 3 (0.82%) SCCM
11 2 (0.55%) FortiGate
11 2 (0.55%) HAProxy
11 2 (0.55%) MAINVIEW
11 2 (0.55%) SCOM
11 2 (0.55%) WSUS
11 2 (0.55%) yum
Vendors
1 107 (29.32%) Microsoft
2 102 (27.95%) VMware
3 26 (7.12%) Cisco
3 26 (7.12%) Oracle
4 25 (6.85%) HP
4 25 (6.85%) Sun
5 22 (6.03%) Citrix
6 20 (5.48%) IBM
7 18 (4.93%) BMC
8 16 (4.38%) Unisys
9 14 (3.84%) Splunk
10 10 (2.74%) ServiceNow
11 8 (2.19%) CheckPoint
11 8 (2.19%) Remedy
12 7 (1.92%) Meraki
12 7 (1.92%) SAP
13 6 (1.64%) NetApp
14 5 (1.37%) Apple
14 5 (1.37%) Dell
14 5 (1.37%) Palo Alto