AngularJS Jobs with Hybrid/Remote/WFH Options

Angular
UK > Work from Home

The table below provides summary statistics for permanent remote or hybrid work requiring AngularJS skills. It includes a benchmarking guide to the annual salaries offered in vacancies that cited AngularJS over the 6 months leading up to 2 May 2025, comparing them to the same period in the previous two years.

6 months to
2 May 2025
Same period 2024 Same period 2023
Rank 108 57 74
Rank change year-on-year -51 +17 -28
Permanent jobs citing AngularJS 434 1,565 1,846
As % of all permanent jobs with a WFH option 2.90% 4.62% 4.32%
As % of the Libraries, Frameworks & Software Standards category 11.03% 17.43% 12.76%
Number of salaries quoted 411 1,413 1,336
10th Percentile £47,500 £40,200 £41,250
25th Percentile £55,625 £45,000 £50,000
Median annual salary (50th Percentile) £70,000 £60,000 £63,000
Median % change year-on-year +16.67% -4.76% +5.00%
75th Percentile £90,000 £76,250 £82,500
90th Percentile £110,000 £95,000 £98,750
UK median annual salary £70,000 £60,000 £65,000
% change year-on-year +16.67% -7.69% +8.33%

All Software Libraries and Frameworks
Work from Home

AngularJS falls under the Software Libraries and Frameworks category. For comparison with the information above, the following table provides summary statistics for all permanent job vacancies with remote or hybrid options requiring technical specification, industry standards, software libraries and framework skills.

Permanent vacancies with a requirement for technical specification, industry standards, software libraries and framework skills 3,933 8,978 14,466
As % of all permanent jobs with a WFH option 26.28% 26.53% 33.88%
Number of salaries quoted 3,186 7,510 10,860
10th Percentile £40,000 £39,225 £41,250
25th Percentile £51,250 £47,500 £51,000
Median annual salary (50th Percentile) £65,000 £60,000 £65,000
Median % change year-on-year +8.33% -7.69% +4.00%
75th Percentile £86,250 £79,500 £86,250
90th Percentile £115,000 £100,000 £102,500
UK median annual salary £65,000 £60,000 £67,500
% change year-on-year +8.33% -11.11% +8.00%

AngularJS
Trend for Jobs with a WFH Option

Job vacancies with remote working options citing AngularJS as a proportion of all IT jobs advertised.
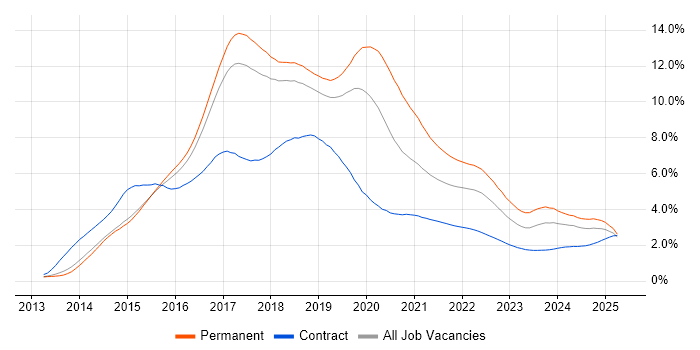
AngularJS trend for jobs with Hybrid/Remote/WFH options

AngularJS
Salary Trend for Jobs with a WFH Option

3-month moving average salary quoted in job vacancies with remote working options citing AngularJS.

AngularJS salary trend for jobs with a WFH option

AngularJS
Salary Histogram for Jobs with a WFH Option

Salary distribution for jobs with remote working options citing AngularJS over the 6 months to 2 May 2025.

AngularJS salary histogram for jobs with a WFH option

AngularJS
Co-occurring Skills and Capabilities with WFH Options by Category

The follow tables expand on the table above by listing co-occurrences grouped by category. The same employment type, locality and period is covered with up to 20 co-occurrences shown in each of the following categories:

Application Platforms
1 61 (14.06%) Apache Airflow
2 20 (4.61%) Apache
3 7 (1.61%) CMS
4 6 (1.38%) IIS
5 5 (1.15%) Confluence
6 4 (0.92%) Umbraco
6 4 (0.92%) WordPress
7 2 (0.46%) Headless CMS
7 2 (0.46%) OpenStack
8 1 (0.23%) ColdFusion
8 1 (0.23%) EPiServer
8 1 (0.23%) nginx
8 1 (0.23%) NServiceBus
8 1 (0.23%) Oracle SOA Suite
8 1 (0.23%) SharePoint
Applications
1 3 (0.69%) Trello
2 2 (0.46%) Microsoft Excel
3 1 (0.23%) Adobe Creative Suite
3 1 (0.23%) Adobe Illustrator
3 1 (0.23%) Microsoft Office
3 1 (0.23%) Photoshop
Business Applications
1 3 (0.69%) Dynamics CRM
2 2 (0.46%) Magento
2 2 (0.46%) Shopify
Cloud Services
1 195 (44.93%) Azure
2 190 (43.78%) AWS
3 97 (22.35%) GCP
4 60 (13.82%) dbt
5 53 (12.21%) Azure DevOps
6 49 (11.29%) SaaS
7 24 (5.53%) Serverless
8 20 (4.61%) GitHub
9 12 (2.76%) AWS Lambda
10 9 (2.07%) Power Platform
11 8 (1.84%) PaaS
12 7 (1.61%) Dynamics 365
13 6 (1.38%) Apigee
13 6 (1.38%) Azure Service Bus
13 6 (1.38%) GitHub Actions
14 5 (1.15%) Azure Functions
14 5 (1.15%) Azure Logic Apps
14 5 (1.15%) npm
15 4 (0.92%) Amazon Cognito
15 4 (0.92%) Power Automate
Communications & Networking
1 3 (0.69%) Internet
2 1 (0.23%) Broadband
2 1 (0.23%) DNS
2 1 (0.23%) FTP
2 1 (0.23%) HTTP
2 1 (0.23%) HTTPS
2 1 (0.23%) MQTT
2 1 (0.23%) SMTP
2 1 (0.23%) SSL
Database & Business Intelligence
1 77 (17.74%) SQL Server
2 74 (17.05%) PostgreSQL
3 60 (13.82%) Amazon Athena
3 60 (13.82%) Apache Arrow
3 60 (13.82%) Apache Iceberg
3 60 (13.82%) Dremio
4 44 (10.14%) MongoDB
5 41 (9.45%) MySQL
6 35 (8.06%) NoSQL
7 32 (7.37%) Azure SQL Database
8 23 (5.30%) Elasticsearch
9 20 (4.61%) Apache Ignite
10 10 (2.30%) Relational Database
11 7 (1.61%) SQL Server Integration Services
11 7 (1.61%) SQL Server Reporting Services
12 6 (1.38%) NonStop SQL
12 6 (1.38%) Redis
13 4 (0.92%) Amazon RDS
14 3 (0.69%) Apache Cassandra
14 3 (0.69%) DynamoDB
Development Applications
1 71 (16.36%) Git
2 34 (7.83%) Jasmine
3 29 (6.68%) JUnit
4 28 (6.45%) Karma Test Runner
5 27 (6.22%) Mockito
6 22 (5.07%) Eclipse
6 22 (5.07%) IntelliJ
6 22 (5.07%) Protractor
7 20 (4.61%) JIRA
8 15 (3.46%) Jenkins
9 9 (2.07%) NUnit
9 9 (2.07%) TeamCity
10 8 (1.84%) Cypress.io
10 8 (1.84%) Visual Studio
11 7 (1.61%) GitLab
11 7 (1.61%) Postman
12 6 (1.38%) Cucumber
12 6 (1.38%) Team Foundation Server
12 6 (1.38%) webpack
13 5 (1.15%) SoapUI
General
1 132 (30.41%) Finance
2 82 (18.89%) Front Office
3 65 (14.98%) Social Skills
4 28 (6.45%) Inclusion and Diversity
5 26 (5.99%) Analytical Skills
6 20 (4.61%) Banking
7 16 (3.69%) Retail
8 15 (3.46%) Public Sector
9 12 (2.76%) Games
10 8 (1.84%) Tech for Good
11 6 (1.38%) Marketing
12 5 (1.15%) Automotive
12 5 (1.15%) Law
12 5 (1.15%) Telecoms
13 4 (0.92%) Advertising
13 4 (0.92%) Investment Banking
14 3 (0.69%) Manufacturing
15 2 (0.46%) Electronics
15 2 (0.46%) Military
16 1 (0.23%) Back Office
Job Titles
1 294 (67.74%) Developer
2 123 (28.34%) Software Engineer
3 121 (27.88%) Senior
4 74 (17.05%) Developer/Software Engineer
5 66 (15.21%) Senior Developer
6 61 (14.06%) AWS Developer
6 61 (14.06%) AWS Engineer
7 60 (13.82%) AWS Software Engineer
8 55 (12.67%) Full-Stack Developer
9 53 (12.21%) Python Developer
10 52 (11.98%) Python Engineer
11 51 (11.75%) Python Software Engineer
12 47 (10.83%) .NET Developer
13 46 (10.60%) Java Developer
14 36 (8.29%) C# Developer
15 31 (7.14%) Consultant
15 31 (7.14%) ServiceNow Consultant
15 31 (7.14%) Technical Consultant
16 26 (5.99%) Lead
17 22 (5.07%) Senior ServiceNow Consultant
Libraries, Frameworks & Software Standards
1 264 (60.83%) React
2 172 (39.63%) .NET
3 161 (37.10%) Vue
4 116 (26.73%) HTML
5 115 (26.50%) Node.js
6 98 (22.58%) .NET Core
7 86 (19.82%) CSS
8 72 (16.59%) RESTful
9 61 (14.06%) Pandas
10 60 (13.82%) .NET Framework
10 60 (13.82%) NumPy
10 60 (13.82%) SciPy
11 58 (13.36%) ASP.NET
12 46 (10.60%) ASP.NET Web API
13 40 (9.22%) HTML5
14 39 (8.99%) Entity Framework
15 37 (8.53%) ASP.NET MVC
16 33 (7.60%) Laravel
17 31 (7.14%) Redux
18 30 (6.91%) REST
Miscellaneous
1 74 (17.05%) Fixed Income
2 42 (9.68%) Equities
3 39 (8.99%) Foreign Exchange (FX)
4 30 (6.91%) Algorithms
5 22 (5.07%) Product Ownership
6 17 (3.92%) Hedge funds
7 13 (3.00%) Greenfield Project
8 11 (2.53%) Distributed Systems
9 10 (2.30%) Cloud Native
10 8 (1.84%) Data Structures
10 8 (1.84%) IoT
11 7 (1.61%) Enterprise Software
11 7 (1.61%) Virtual Team
12 6 (1.38%) DataPower
12 6 (1.38%) Public Cloud
13 5 (1.15%) Client/Server
13 5 (1.15%) Mobile App
14 4 (0.92%) Distributed Architecture
14 4 (0.92%) Team-Oriented Environment
15 3 (0.69%) Low-Code
Operating Systems
1 33 (7.60%) Linux
2 14 (3.23%) Android
3 11 (2.53%) Apple iOS
4 2 (0.46%) Unix
4 2 (0.46%) Windows
5 1 (0.23%) CentOS
5 1 (0.23%) Debian
5 1 (0.23%) Red Hat Enterprise Linux
5 1 (0.23%) Windows Server
Processes & Methodologies
1 264 (60.83%) Agile
2 193 (44.47%) Software Engineering
3 131 (30.18%) Full-Stack Development
4 125 (28.80%) Microservices
5 99 (22.81%) DevOps
6 79 (18.20%) Fintech
7 76 (17.51%) Asset Management
8 74 (17.05%) TDD
9 72 (16.59%) Investment Management
10 68 (15.67%) CI/CD
11 64 (14.75%) MVC
12 61 (14.06%) Problem-Solving
13 60 (13.82%) Performance Attribution
14 58 (13.36%) Unit Testing
15 50 (11.52%) Mentoring
16 46 (10.60%) Containerisation
17 45 (10.37%) Risk Management
18 42 (9.68%) Design Patterns
19 40 (9.22%) Order Management
20 39 (8.99%) Technical Leadership
Programming Languages
1 300 (69.12%) JavaScript
2 188 (43.32%) TypeScript
3 174 (40.09%) C#
4 147 (33.87%) SQL
5 87 (20.05%) Java
5 87 (20.05%) Python
6 49 (11.29%) PHP
7 7 (1.61%) Ruby
8 6 (1.38%) C
9 4 (0.92%) PL/SQL
10 3 (0.69%) Bash
10 3 (0.69%) Kotlin
10 3 (0.69%) PowerShell
10 3 (0.69%) T-SQL
11 2 (0.46%) C++
11 2 (0.46%) Groovy
11 2 (0.46%) Rust
11 2 (0.46%) Shell Script
12 1 (0.23%) COBOL
12 1 (0.23%) VB.NET
Qualifications
1 41 (9.45%) Degree
2 27 (6.22%) Security Cleared
3 17 (3.92%) SC Cleared
4 14 (3.23%) Computer Science Degree
5 6 (1.38%) Numerate Degree
6 5 (1.15%) Master's Degree
7 2 (0.46%) DV Cleared
8 1 (0.23%) Azure Certification
8 1 (0.23%) CISSP
8 1 (0.23%) ISTQB
8 1 (0.23%) ISTQB Foundation Certification
8 1 (0.23%) ITIL Foundation Certificate
Quality Assurance & Compliance
1 19 (4.38%) QA
2 10 (2.30%) Accessibility
3 6 (1.38%) ISO/IEC 27001
4 4 (0.92%) PCI DSS
4 4 (0.92%) SOC 2
5 2 (0.46%) GRC
5 2 (0.46%) SLA
6 1 (0.23%) ISO 15022
6 1 (0.23%) ISO 20022
System Software
1 78 (17.97%) Docker
2 1 (0.23%) Active Directory
Systems Management
1 39 (8.99%) Kubernetes
2 14 (3.23%) Terraform
3 6 (1.38%) Ansible
4 3 (0.69%) Rundeck
5 2 (0.46%) Marathon
5 2 (0.46%) Prometheus
5 2 (0.46%) Single Sign-On
6 1 (0.23%) HP Quality Center
Vendors
1 74 (17.05%) Microsoft
2 34 (7.83%) ServiceNow
3 33 (7.60%) IBM
4 9 (2.07%) Telerik
5 7 (1.61%) Oracle
6 6 (1.38%) Apple
7 5 (1.15%) Google
8 4 (0.92%) Facebook
8 4 (0.92%) YouTube
9 3 (0.69%) Adobe
9 3 (0.69%) Optimizely
9 3 (0.69%) Twitter
10 2 (0.46%) CA Agile Central
10 2 (0.46%) Dynatrace
10 2 (0.46%) Red Hat
10 2 (0.46%) Rollbar
10 2 (0.46%) Salesforce
10 2 (0.46%) SAP
10 2 (0.46%) Splunk
10 2 (0.46%) WooCommerce