Web Services Jobs with Hybrid/Remote/WFH Options

Web Services
UK > Work from Home

The table below provides summary statistics for permanent remote or hybrid work requiring Web Services skills. It includes a benchmarking guide to the annual salaries offered in vacancies that cited Web Services over the 6 months leading up to 5 July 2025, comparing them to the same period in the previous two years.

6 months to
5 Jul 2025
Same period 2024 Same period 2023
Rank 232 206 163
Rank change year-on-year -26 -43 -20
Permanent jobs citing Web Services 255 552 775
As % of all permanent jobs with a WFH option 1.24% 1.62% 2.15%
As % of the Libraries, Frameworks & Software Standards category 4.99% 6.11% 6.55%
Number of salaries quoted 145 428 634
10th Percentile £42,500 £42,500 £37,986
25th Percentile £50,000 £46,250 £48,063
Median annual salary (50th Percentile) £65,000 £57,500 £60,000
Median % change year-on-year +13.04% -4.17% +2.64%
75th Percentile £80,000 £64,063 £77,715
90th Percentile £115,000 £75,750 £89,956
UK median annual salary £65,000 £55,173 £65,000
% change year-on-year +17.81% -15.12% +8.33%

All Software Libraries and Frameworks
Work from Home

Web Services falls under the Software Libraries and Frameworks category. For comparison with the information above, the following table provides summary statistics for all permanent job vacancies with remote or hybrid options requiring technical specification, industry standards, software libraries and framework skills.

Permanent vacancies with a requirement for technical specification, industry standards, software libraries and framework skills 5,107 9,028 11,825
As % of all permanent jobs with a WFH option 24.82% 26.46% 32.78%
Number of salaries quoted 2,936 7,384 9,318
10th Percentile £37,500 £38,750 £41,250
25th Percentile £51,250 £47,496 £50,500
Median annual salary (50th Percentile) £66,225 £60,000 £65,351
Median % change year-on-year +10.38% -8.19% +4.56%
75th Percentile £86,250 £81,250 £85,000
90th Percentile £115,000 £110,000 £105,000
UK median annual salary £67,500 £60,000 £67,000
% change year-on-year +12.50% -10.45% +4.69%

Web Services
Trend for Jobs with a WFH Option

Job vacancies with remote working options citing Web Services as a proportion of all IT jobs advertised.
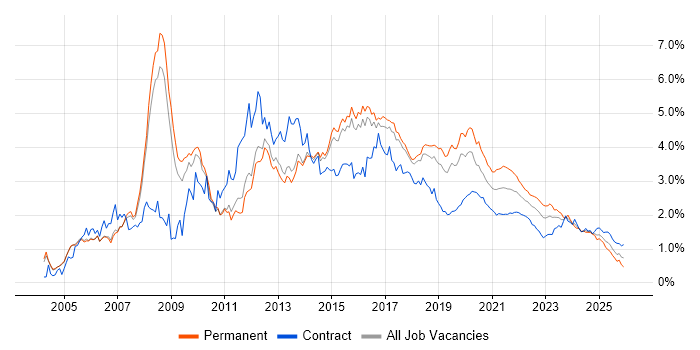
Web Services trend for jobs with Hybrid/Remote/WFH options

Web Services
Salary Trend for Jobs with a WFH Option

3-month moving average salary quoted in job vacancies with remote working options citing Web Services.

Web Services salary trend for jobs with a WFH option

Web Services
Salary Histogram for Jobs with a WFH Option

Salary distribution for jobs with remote working options citing Web Services over the 6 months to 5 July 2025.

Web Services salary histogram for jobs with a WFH option

Web Services
Co-occurring Skills and Capabilities with WFH Options by Category

The follow tables expand on the table above by listing co-occurrences grouped by category. The same employment type, locality and period is covered with up to 20 co-occurrences shown in each of the following categories:

Application Platforms
1 10 (3.92%) CMS
2 5 (1.96%) SharePoint
3 3 (1.18%) Apache Solr
3 3 (1.18%) Confluence
3 3 (1.18%) WordPress
4 2 (0.78%) Apache
4 2 (0.78%) IIS
4 2 (0.78%) nginx
5 1 (0.39%) ColdFusion
5 1 (0.39%) EPiServer
5 1 (0.39%) Headless CMS
5 1 (0.39%) OpenEdge
5 1 (0.39%) Umbraco
5 1 (0.39%) WebLogic
Applications
1 2 (0.78%) Microsoft Office
2 1 (0.39%) Microsoft Excel
2 1 (0.39%) Trello
Business Applications
1 21 (8.24%) NetSuite
2 11 (4.31%) JDE OneWorld
3 10 (3.92%) Dynamics CRM
4 7 (2.75%) Infor CloudSuite
4 7 (2.75%) Infor CloudSuite Industrial (formerly SyteLine)
5 5 (1.96%) SAP S/4HANA
6 4 (1.57%) Orchestrade
7 2 (0.78%) Elite 3E
8 1 (0.39%) Adobe Campaign
8 1 (0.39%) Remedy ITSM
Cloud Services
1 103 (40.39%) AWS
2 89 (34.90%) Serverless
3 86 (33.73%) AWS Lambda
4 67 (26.27%) Azure
5 21 (8.24%) Boomi
6 16 (6.27%) GitHub
7 14 (5.49%) GCP
7 14 (5.49%) npm
8 13 (5.10%) Power Platform
8 13 (5.10%) SaaS
9 12 (4.71%) Azure DevOps
9 12 (4.71%) Dynamics 365
10 10 (3.92%) PowerApps
11 7 (2.75%) Power Automate
12 6 (2.35%) ChatGPT
13 5 (1.96%) iPaaS
14 4 (1.57%) Azure Logic Apps
14 4 (1.57%) Cloudflare
15 3 (1.18%) Azure Service Bus
15 3 (1.18%) GitHub Actions
Communications & Networking
1 83 (32.55%) SSL
2 82 (32.16%) Broadband
2 82 (32.16%) SSH
3 4 (1.57%) HTTP
4 1 (0.39%) DNS
4 1 (0.39%) Internet
4 1 (0.39%) VPN
4 1 (0.39%) Wi-Fi
Database & Business Intelligence
1 49 (19.22%) SQL Server
2 20 (7.84%) MySQL
2 20 (7.84%) SQL Server Reporting Services
3 17 (6.67%) Relational Database
4 13 (5.10%) SQL Server Integration Services
5 10 (3.92%) Power BI
6 7 (2.75%) Crystal Reports
6 7 (2.75%) Elasticsearch
7 6 (2.35%) Data Warehouse
7 6 (2.35%) NoSQL
7 6 (2.35%) PostgreSQL
7 6 (2.35%) Redis
7 6 (2.35%) SQL Server Analysis Services
8 5 (1.96%) Microsoft Analysis Services
9 3 (1.18%) Amazon RDS
9 3 (1.18%) DynamoDB
9 3 (1.18%) Oracle Database
10 2 (0.78%) RDBMS
11 1 (0.39%) Azure SQL Data Warehouse
Development Applications
1 76 (29.80%) Git
2 23 (9.02%) JIRA
3 13 (5.10%) webpack
4 11 (4.31%) Cucumber
4 11 (4.31%) Cypress.io
4 11 (4.31%) Sonatype Nexus
5 10 (3.92%) Jenkins
6 7 (2.75%) SonarQube
7 6 (2.35%) Xcode
8 5 (1.96%) SQL Server Management Studio (SSMS)
8 5 (1.96%) Subversion
9 4 (1.57%) Appium
9 4 (1.57%) Mocha
9 4 (1.57%) Postman
9 4 (1.57%) SoapUI
9 4 (1.57%) Team Foundation Server
9 4 (1.57%) XCUITest
10 3 (1.18%) Jasmine
10 3 (1.18%) PHPUnit
10 3 (1.18%) Visual Studio
General
1 116 (45.49%) Social Skills
2 44 (17.25%) Finance
3 20 (7.84%) Banking
4 10 (3.92%) Law
4 10 (3.92%) Retail
5 8 (3.14%) Analytical Skills
6 7 (2.75%) Front Office
6 7 (2.75%) Investment Banking
6 7 (2.75%) Marketing
7 4 (1.57%) Automotive
7 4 (1.57%) Back Office
7 4 (1.57%) Public Sector
8 3 (1.18%) Advertising
8 3 (1.18%) Inclusion and Diversity
8 3 (1.18%) Legal
9 2 (0.78%) Agriculture
9 2 (0.78%) Local Government
9 2 (0.78%) Manufacturing
10 1 (0.39%) Billing
10 1 (0.39%) German Language
Job Titles
1 112 (43.92%) Developer
2 82 (32.16%) Cloud Engineer
2 82 (32.16%) DevOps Engineer
3 36 (14.12%) Senior
4 22 (8.63%) Senior Developer
5 21 (8.24%) NetSuite Developer
6 20 (7.84%) .NET Developer
6 20 (7.84%) Full-Stack Developer
7 17 (6.67%) Lead
7 17 (6.67%) Software Engineer
8 15 (5.88%) C# Developer
9 14 (5.49%) Software Developer
10 9 (3.53%) C# .NET Developer
10 9 (3.53%) Technical Developer
11 8 (3.14%) Dynamics 365 Developer
11 8 (3.14%) Java Engineer
12 7 (2.75%) Analyst
12 7 (2.75%) Energy Trading Developer
12 7 (2.75%) Senior Software Engineer
13 6 (2.35%) SQL Developer
Libraries, Frameworks & Software Standards
1 127 (49.80%) RESTful
2 58 (22.75%) HTML
3 55 (21.57%) CSS
4 54 (21.18%) .NET
4 54 (21.18%) REST
5 38 (14.90%) XML
6 32 (12.55%) JSON
7 30 (11.76%) SOAP
8 26 (10.20%) React
9 22 (8.63%) CSS3
9 22 (8.63%) Spring Boot
10 21 (8.24%) jQuery
11 19 (7.45%) .NET Core
12 18 (7.06%) .NET Framework
13 17 (6.67%) AngularJS
13 17 (6.67%) Jest
13 17 (6.67%) Middleware
14 16 (6.27%) Vue
15 15 (5.88%) ASP.NET
16 13 (5.10%) Hibernate
Miscellaneous
1 84 (32.94%) Onboarding
2 82 (32.16%) Cyber Threat
2 82 (32.16%) Cyberattack
2 82 (32.16%) Management Information System
2 82 (32.16%) PKI
3 13 (5.10%) Cloud Native
4 9 (3.53%) Legacy Systems
4 9 (3.53%) Product Ownership
4 9 (3.53%) Virtual Team
5 7 (2.75%) Distributed Applications
5 7 (2.75%) Enterprise Software
5 7 (2.75%) Foreign Exchange (FX)
5 7 (2.75%) Team-Oriented Environment
6 6 (2.35%) BYOD
6 6 (2.35%) Public Cloud
6 6 (2.35%) Self-Motivation
7 4 (1.57%) Mobile App
8 3 (1.18%) Greenfield Project
9 2 (0.78%) Distributed Systems
9 2 (0.78%) Low-Code
Operating Systems
1 12 (4.71%) Windows
2 11 (4.31%) Linux
3 7 (2.75%) Apple iOS
4 5 (1.96%) Windows Server
5 4 (1.57%) Android
6 3 (1.18%) Unix
7 1 (0.39%) CentOS
7 1 (0.39%) Debian
Processes & Methodologies
1 118 (46.27%) DevOps
2 89 (34.90%) Roadmaps
3 87 (34.12%) Cybersecurity
4 82 (32.16%) Deployment Automation
4 82 (32.16%) Key Management
4 82 (32.16%) Programme Delivery
4 82 (32.16%) Use Case
4 82 (32.16%) Vulnerability Assessment
5 80 (31.37%) Agile
6 47 (18.43%) CI/CD
7 46 (18.04%) Problem-Solving
8 43 (16.86%) Microservices
9 35 (13.73%) Full-Stack Development
10 33 (12.94%) Software Engineering
11 28 (10.98%) MVC
12 25 (9.80%) User Experience
13 22 (8.63%) CRM
13 22 (8.63%) OO
13 22 (8.63%) OOP
13 22 (8.63%) Test Automation
Programming Languages
1 93 (36.47%) JavaScript
1 93 (36.47%) Python
2 73 (28.63%) SQL
3 70 (27.45%) C#
4 26 (10.20%) Java
5 14 (5.49%) PowerShell
6 13 (5.10%) PHP
7 9 (3.53%) TypeScript
7 9 (3.53%) VB.NET
8 8 (3.14%) T-SQL
9 4 (1.57%) Swift
10 3 (1.18%) C++
10 3 (1.18%) Groovy
11 2 (0.78%) Go
11 2 (0.78%) Shell Script
12 1 (0.39%) ABAP
12 1 (0.39%) C
12 1 (0.39%) PL/SQL
Qualifications
1 17 (6.67%) Degree
2 8 (3.14%) Computer Science Degree
3 5 (1.96%) SAP Certification
4 4 (1.57%) Master's Degree
5 2 (0.78%) Microsoft Certification
5 2 (0.78%) Oracle Certification
5 2 (0.78%) Security Cleared
6 1 (0.39%) CHECK Team Leader
6 1 (0.39%) OCP
6 1 (0.39%) SC Cleared
Quality Assurance & Compliance
1 87 (34.12%) ISO/IEC 27001
2 82 (32.16%) NIST
3 18 (7.06%) QA
4 13 (5.10%) Accessibility
5 1 (0.39%) GDPR
System Software
1 82 (32.16%) Active Directory
2 34 (13.33%) Docker
3 2 (0.78%) VMware ESXi
3 2 (0.78%) VMware Infrastructure
Systems Management
1 88 (34.51%) Terraform
2 20 (7.84%) Kubernetes
3 9 (3.53%) Single Sign-On
4 1 (0.39%) HP UCMDB
Vendors
1 82 (32.16%) Thales
2 54 (21.18%) Microsoft
3 12 (4.71%) Dell
4 11 (4.31%) Salesforce
5 10 (3.92%) MuleSoft
6 8 (3.14%) DevExpress
6 8 (3.14%) Trayport
7 7 (2.75%) Infor
7 7 (2.75%) ServiceNow
8 5 (1.96%) Oracle
8 5 (1.96%) SAP
9 3 (1.18%) Twitter
10 2 (0.78%) Apple
10 2 (0.78%) CA Agile Central
10 2 (0.78%) Dynatrace
10 2 (0.78%) Intapp
10 2 (0.78%) Splunk
10 2 (0.78%) VMware
11 1 (0.39%) ATG
11 1 (0.39%) BMC