Administrator Jobs with Hybrid/Remote/WFH Options

Administrator
UK > Work from Home

The median Administrator salary for remote or hybrid work is £47,500 per year, according to job vacancies posted during the 6 months leading to 13 May 2025.

The table below provides salary benchmarking and summary statistics, comparing them to the same period in the previous two years.

6 months to
13 May 2025
Same period 2024 Same period 2023
Rank 282 219 251
Rank change year-on-year -63 +32 +93
Permanent jobs requiring an Administrator 200 501 577
As % of all permanent jobs with a WFH option 1.11% 1.48% 1.39%
As % of the Job Titles category 1.21% 1.54% 1.45%
Number of salaries quoted 162 411 396
10th Percentile £25,038 £23,250 £27,125
25th Percentile £30,250 £28,250 £38,750
Median annual salary (50th Percentile) £47,500 £45,000 £50,000
Median % change year-on-year +5.56% -10.00% +5.26%
75th Percentile £59,688 £59,750 £60,000
90th Percentile £80,000 £63,750 £73,125
UK median annual salary £45,000 £35,000 £45,625
% change year-on-year +28.57% -23.29% +1.39%

All Permanent IT Job Vacancies
Work from Home

For comparison with the information above, the following table provides summary statistics for all permanent IT job vacancies with WFH or hybrid options. Most job vacancies include a discernible job title that can be normalized. As such, the figures in the second row provide an indication of the number of permanent jobs in our overall sample.

Permanent vacancies in Work from Home with a recognized job title 16,480 32,444 39,722
% of permanent jobs with a recognized job title 91.55% 95.98% 96.01%
Number of salaries quoted 9,871 24,899 28,264
10th Percentile £29,000 £33,010 £36,750
25th Percentile £42,500 £42,500 £47,447
Median annual salary (50th Percentile) £57,500 £56,318 £62,500
Median % change year-on-year +2.10% -9.89% +4.17%
75th Percentile £76,250 £75,000 £81,250
90th Percentile £100,000 £93,750 £100,000
UK median annual salary £56,500 £52,500 £60,000
% change year-on-year +7.62% -12.50% -

Administrator
Trend for Jobs with a WFH Option

Job vacancies with remote working options which featured Administrator in the job title as a proportion of all IT jobs advertised.
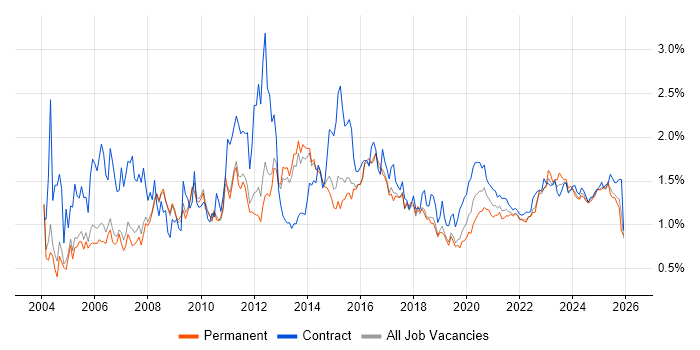
Administrator trend for jobs with Hybrid/Remote/WFH options

Administrator
Salary Trend for Jobs with a WFH Option

3-month moving average salary quoted in job vacancies with remote working options citing Administrator.

Administrator salary trend for jobs with a WFH option

Administrator
Salary Histogram for Jobs with a WFH Option

Salary distribution for jobs with remote working options citing Administrator over the 6 months to 13 May 2025.

Administrator salary histogram for jobs with a WFH option

Administrator Skill Set
Top 30 Co-occurring Skills and Capabilities in Job Vacancies with WFH Options

For the 6 months to 13 May 2025, Administrator job roles required the following skills and capabilities in order of popularity. The figures indicate the absolute number co-occurrences and as a proportion of all permanent jobs with hybrid or remote work options featuring Administrator in the job title.

1 80 (40.00%) Social Skills
2 67 (33.50%) Microsoft
3 59 (29.50%) Finance
4 57 (28.50%) Problem-Solving
5 56 (28.00%) Linux
6 43 (21.50%) Windows
7 41 (20.50%) SQL
8 36 (18.00%) Microsoft 365
9 35 (17.50%) Customer Service
9 35 (17.50%) Azure
10 34 (17.00%) Active Directory
11 33 (16.50%) Analytical Skills
12 26 (13.00%) Microsoft Office
12 26 (13.00%) PowerShell
13 25 (12.50%) Agile
14 24 (12.00%) SQL Server
14 24 (12.00%) Microsoft Excel
14 24 (12.00%) Red Hat
15 23 (11.50%) Salesforce
15 23 (11.50%) DevOps
16 21 (10.50%) Analytics
16 21 (10.50%) Windows Server
17 20 (10.00%) Management Information System
17 20 (10.00%) VMware
18 19 (9.50%) SaaS
18 19 (9.50%) Organisational Skills
19 18 (9.00%) Degree
19 18 (9.00%) CRM
19 18 (9.00%) Oracle
20 17 (8.50%) Continuous Improvement

Administrator Skill Set
Co-occurring Skills and Capabilities with WFH Options by Category

The follow tables expand on the table above by listing co-occurrences grouped by category. The same employment type, locality and period is covered with up to 20 co-occurrences shown in each of the following categories:

Application Platforms
1 11 (5.50%) SharePoint
2 9 (4.50%) Tomcat
3 8 (4.00%) IIS
4 6 (3.00%) nginx
5 5 (2.50%) Microsoft Exchange
6 3 (1.50%) SharePoint Server
7 2 (1.00%) Confluence
8 1 (0.50%) Apache
Applications
1 26 (13.00%) Microsoft Office
2 24 (12.00%) Microsoft Excel
3 11 (5.50%) Spreadsheet
4 5 (2.50%) Microsoft Project
5 1 (0.50%) Microsoft PowerPoint
Business Applications
1 16 (8.00%) NetSuite
2 5 (2.50%) Oracle EBS
3 3 (1.50%) Maximo
4 1 (0.50%) Dynamics CRM
4 1 (0.50%) Oracle Payables
4 1 (0.50%) Salesforce CRM
4 1 (0.50%) SAP Business ByDesign
4 1 (0.50%) SAP Oil and Gas
4 1 (0.50%) SAP S/4HANA
Cloud Services
1 36 (18.00%) Microsoft 365
2 35 (17.50%) Azure
3 19 (9.50%) SaaS
4 14 (7.00%) AWS
5 10 (5.00%) Power Platform
6 9 (4.50%) Azure DevOps
7 8 (4.00%) Entra ID
7 8 (4.00%) Power Automate
8 7 (3.50%) Microsoft Copilot
9 6 (3.00%) OneDrive
10 4 (2.00%) Amazon CloudWatch
10 4 (2.00%) AWS CloudTrail
10 4 (2.00%) GCP
11 3 (1.50%) Boomi
12 2 (1.00%) Google Analytics
12 2 (1.00%) Google Docs
12 2 (1.00%) Google Drive
12 2 (1.00%) Google Sheets
12 2 (1.00%) Sentry
12 2 (1.00%) Snowflake
Communications & Networking
1 12 (6.00%) Firewall
2 8 (4.00%) SSL
3 7 (3.50%) DMARC
3 7 (3.50%) DNS
4 4 (2.00%) DHCP
4 4 (2.00%) TCP/IP
4 4 (2.00%) VPN
5 3 (1.50%) LAN
5 3 (1.50%) VLAN
5 3 (1.50%) WAN
6 2 (1.00%) Multicast
6 2 (1.00%) Network Security
6 2 (1.00%) SSH
7 1 (0.50%) FTP
7 1 (0.50%) HTTP
7 1 (0.50%) HTTPS
7 1 (0.50%) IPsec
7 1 (0.50%) Softphone
7 1 (0.50%) WebEx
Database & Business Intelligence
1 24 (12.00%) SQL Server
2 10 (5.00%) Azure SQL Database
3 9 (4.50%) MySQL
3 9 (4.50%) PostgreSQL
4 8 (4.00%) MariaDB
4 8 (4.00%) SQL Server Integration Services
5 7 (3.50%) Amazon RDS
5 7 (3.50%) Data Lake
5 7 (3.50%) SQL Server Reporting Services
6 5 (2.50%) Oracle Reports
7 4 (2.00%) Power BI
7 4 (2.00%) RDBMS
7 4 (2.00%) Relational Database
8 2 (1.00%) Cloud Spanner
8 2 (1.00%) Couchbase
8 2 (1.00%) Data Mining
8 2 (1.00%) Data Warehouse
8 2 (1.00%) Elasticsearch
8 2 (1.00%) NoSQL
8 2 (1.00%) Oracle Database
Development Applications
1 11 (5.50%) JIRA
2 4 (2.00%) Git
3 2 (1.00%) GitLab
4 1 (0.50%) Visual Studio
General
1 80 (40.00%) Social Skills
2 59 (29.50%) Finance
3 33 (16.50%) Analytical Skills
4 19 (9.50%) Organisational Skills
5 13 (6.50%) Law
6 12 (6.00%) Billing
6 12 (6.00%) Inclusion and Diversity
7 9 (4.50%) Marketing
7 9 (4.50%) Presentation Skills
8 8 (4.00%) Banking
8 8 (4.00%) Manufacturing
9 7 (3.50%) Czech Language
9 7 (3.50%) Legal
10 6 (3.00%) Retail
11 4 (2.00%) Public Sector
12 3 (1.50%) Military
13 2 (1.00%) Documentation Skills
13 2 (1.00%) Local Government
14 1 (0.50%) Influencing Skills
14 1 (0.50%) Police
Libraries, Frameworks & Software Standards
1 8 (4.00%) JSON
1 8 (4.00%) XML
2 7 (3.50%) REST
2 7 (3.50%) SOAP
3 2 (1.00%) LEMP Stack
3 2 (1.00%) Lightning Web Components
3 2 (1.00%) Node.js
3 2 (1.00%) RabbitMQ
3 2 (1.00%) SAP Basis
4 1 (0.50%) ADO
4 1 (0.50%) EDI
4 1 (0.50%) LAMP
4 1 (0.50%) Loki
4 1 (0.50%) Middleware
Miscellaneous
1 20 (10.00%) Management Information System
2 11 (5.50%) Onboarding
3 10 (5.00%) Self-Motivation
4 9 (4.50%) CMDB
5 8 (4.00%) Enterprise Software
6 7 (3.50%) Data Structures
7 6 (3.00%) Data Centre
8 5 (2.50%) e-Learning
9 4 (2.00%) Hybrid Cloud
9 4 (2.00%) Pricing Data
9 4 (2.00%) Renewable Energy
10 3 (1.50%) Cloud Native
11 2 (1.00%) Analytical Mindset
11 2 (1.00%) Cyber Security Posture
11 2 (1.00%) Learning Management System
11 2 (1.00%) Mobile App
11 2 (1.00%) Replication
12 1 (0.50%) Device Driver
12 1 (0.50%) Handset
12 1 (0.50%) Life Science
Operating Systems
1 56 (28.00%) Linux
2 43 (21.50%) Windows
3 21 (10.50%) Windows Server
4 16 (8.00%) Red Hat Enterprise Linux
5 15 (7.50%) Windows 10
6 14 (7.00%) Unix
7 12 (6.00%) CentOS
8 9 (4.50%) AIX
9 7 (3.50%) Solaris
10 6 (3.00%) Ubuntu
11 5 (2.50%) Windows Server 2019
12 3 (1.50%) Oracle Linux
13 2 (1.00%) Rocky
13 2 (1.00%) VMS
14 1 (0.50%) Mac OS
Processes & Methodologies
1 57 (28.50%) Problem-Solving
2 35 (17.50%) Customer Service
3 25 (12.50%) Agile
4 23 (11.50%) DevOps
5 21 (10.50%) Analytics
6 18 (9.00%) CRM
7 17 (8.50%) Continuous Improvement
8 16 (8.00%) CI/CD
8 16 (8.00%) Data Analysis
8 16 (8.00%) Disaster Recovery
9 14 (7.00%) Collaborative Working
9 14 (7.00%) Requirements Gathering
9 14 (7.00%) Roadmaps
9 14 (7.00%) Root Cause Analysis
10 13 (6.50%) ITIL
11 12 (6.00%) Change Management
11 12 (6.00%) Project Management
12 11 (5.50%) Artificial Intelligence
12 11 (5.50%) Data Management
12 11 (5.50%) ETL
Programming Languages
1 41 (20.50%) SQL
2 26 (13.00%) PowerShell
3 14 (7.00%) Bash
4 13 (6.50%) Python
4 13 (6.50%) T-SQL
5 9 (4.50%) JavaScript
6 7 (3.50%) Java
6 7 (3.50%) VBA
7 2 (1.00%) PL/SQL
8 1 (0.50%) AWK
8 1 (0.50%) C
8 1 (0.50%) C++
8 1 (0.50%) Korn
8 1 (0.50%) Perl
8 1 (0.50%) PHP
8 1 (0.50%) Shell Script
Qualifications
1 18 (9.00%) Degree
2 11 (5.50%) Cisco Certification
3 10 (5.00%) ITIL Certification
4 7 (3.50%) AWS Certification
4 7 (3.50%) RHCSA
5 6 (3.00%) DBS Check
5 6 (3.00%) DV Cleared
5 6 (3.00%) IBM AIX Certification
5 6 (3.00%) Security Cleared
6 5 (2.50%) CCNP
6 5 (2.50%) SC Cleared
7 4 (2.00%) RHCE
8 1 (0.50%) ACCA
8 1 (0.50%) AWS Certified DevOps Engineer
8 1 (0.50%) AWS Certified SysOps Administrator
8 1 (0.50%) CIPD
8 1 (0.50%) Microsoft Certification
Quality Assurance & Compliance
1 14 (7.00%) QA
2 9 (4.50%) ISO/IEC 27001
2 9 (4.50%) SLA
3 8 (4.00%) Data Quality
4 2 (1.00%) Cyber Essentials
4 2 (1.00%) Cyber Essentials PLUS
4 2 (1.00%) GDPR
4 2 (1.00%) ISO 9001
5 1 (0.50%) PMO
System Software
1 34 (17.00%) Active Directory
2 15 (7.50%) VMware Infrastructure
3 6 (3.00%) vSphere
4 4 (2.00%) Virtual Servers
4 4 (2.00%) VMware ESXi
5 2 (1.00%) Oracle RAC
5 2 (1.00%) Virtual Machines
6 1 (0.50%) Docker
6 1 (0.50%) KVM
6 1 (0.50%) LXC
6 1 (0.50%) Postfix
6 1 (0.50%) Samba
6 1 (0.50%) Sendmail
Systems Management
1 13 (6.50%) Microsoft Intune
2 9 (4.50%) Ansible
3 8 (4.00%) Single Sign-On
4 6 (3.00%) Nagios
4 6 (3.00%) SCCM
4 6 (3.00%) Terraform
5 4 (2.00%) Kubernetes
5 4 (2.00%) Puppet
6 3 (1.50%) Grafana
6 3 (1.50%) Opsgenie
7 2 (1.00%) Prometheus
7 2 (1.00%) Red Hat Satellite
8 1 (0.50%) Backup Exec
8 1 (0.50%) Nessus
Vendors
1 67 (33.50%) Microsoft
2 24 (12.00%) Red Hat
3 23 (11.50%) Salesforce
4 20 (10.00%) VMware
5 18 (9.00%) Oracle
6 11 (5.50%) Cisco
7 10 (5.00%) SAP
8 6 (3.00%) Citrix
9 5 (2.50%) Progress
9 5 (2.50%) ServiceNow
10 4 (2.00%) Google
10 4 (2.00%) SolarWinds
11 3 (1.50%) Atlassian
11 3 (1.50%) IFS
11 3 (1.50%) iManage
11 3 (1.50%) Xero
12 2 (1.00%) Adobe
12 2 (1.00%) Freshdesk
12 2 (1.00%) IBM
12 2 (1.00%) New Relic