Mathematics Jobs with Hybrid/Remote/WFH Options

Mathematics (Maths)
UK > Work from Home

The table below provides summary statistics for permanent remote or hybrid work requiring Mathematics skills. It includes a benchmarking guide to the annual salaries offered in vacancies that cited Mathematics over the 6 months leading up to 11 May 2025, comparing them to the same period in the previous two years.

6 months to
11 May 2025
Same period 2024 Same period 2023
Rank 90 155 193
Rank change year-on-year +65 +38 -9
Permanent jobs citing Mathematics 621 725 784
As % of all permanent jobs with a WFH option 3.67% 2.14% 1.90%
As % of the Processes & Methodologies category 3.92% 2.35% 1.98%
Number of salaries quoted 222 420 336
10th Percentile £25,000 £24,000 £32,838
25th Percentile £25,313 £31,250 £45,000
Median annual salary (50th Percentile) £25,625 £51,528 £65,000
Median % change year-on-year -50.27% -20.73% +8.33%
75th Percentile £59,688 £67,813 £85,000
90th Percentile £73,886 £91,250 £113,750
UK median annual salary £52,600 £45,000 £62,500
% change year-on-year +16.89% -28.00% +4.17%

All Process and Methodology Skills
Work from Home

Mathematics falls under the Processes and Methodologies category. For comparison with the information above, the following table provides summary statistics for all permanent job vacancies with remote or hybrid options requiring process or methodology skills.

Permanent vacancies with a requirement for process or methodology skills 15,858 30,902 39,630
As % of all permanent jobs with a WFH option 93.81% 91.40% 96.10%
Number of salaries quoted 9,902 23,451 27,583
10th Percentile £29,444 £33,750 £37,500
25th Percentile £43,750 £42,500 £47,500
Median annual salary (50th Percentile) £60,000 £57,500 £62,500
Median % change year-on-year +4.35% -8.00% +4.17%
75th Percentile £77,500 £75,000 £82,500
90th Percentile £102,500 £95,000 £100,000
UK median annual salary £57,500 £55,000 £61,180
% change year-on-year +4.55% -10.10% +1.97%

Mathematics
Trend for Jobs with a WFH Option

Job vacancies with remote working options citing Mathematics as a proportion of all IT jobs advertised.
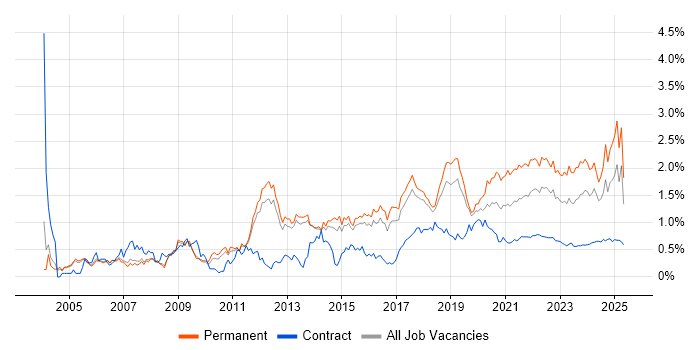
Mathematics trend for jobs with Hybrid/Remote/WFH options

Mathematics
Salary Trend for Jobs with a WFH Option

3-month moving average salary quoted in job vacancies with remote working options citing Mathematics.

Mathematics salary trend for jobs with a WFH option

Mathematics
Salary Histogram for Jobs with a WFH Option

Salary distribution for jobs with remote working options citing Mathematics over the 6 months to 11 May 2025.

Mathematics salary histogram for jobs with a WFH option

Mathematics
Co-occurring Skills and Capabilities with WFH Options by Category

The follow tables expand on the table above by listing co-occurrences grouped by category. The same employment type, locality and period is covered with up to 20 co-occurrences shown in each of the following categories:

Application Platforms
1 23 (3.70%) Jupyter
2 8 (1.29%) Microsoft Exchange
2 8 (1.29%) SAS
3 5 (0.81%) SharePoint
4 2 (0.32%) Apache Spark
4 2 (0.32%) CMS
5 1 (0.16%) Apache
5 1 (0.16%) Confluence
Applications
1 143 (23.03%) Chatbot
2 8 (1.29%) Microsoft Excel
3 4 (0.64%) Simulink
4 3 (0.48%) Microsoft Office
4 3 (0.48%) Microsoft PowerPoint
5 2 (0.32%) Blender
Business Applications
1 2 (0.32%) IBM Planning Analytics
Cloud Services
1 74 (11.92%) AWS
2 65 (10.47%) Azure
3 49 (7.89%) Amazon EKS
3 49 (7.89%) AWS CloudFormation
4 12 (1.93%) Power Platform
5 9 (1.45%) Amazon SageMaker
6 8 (1.29%) Adobe Analytics
7 7 (1.13%) Azure DevOps
7 7 (1.13%) GitHub
7 7 (1.13%) Microsoft 365
8 5 (0.81%) Amazon CloudWatch
8 5 (0.81%) Amazon ECS
9 4 (0.64%) AWS Lambda
9 4 (0.64%) Serverless
10 3 (0.48%) GCP
11 2 (0.32%) Azure Data Factory
11 2 (0.32%) Azure Synapse Analytics
11 2 (0.32%) IaaS
11 2 (0.32%) PowerApps
12 1 (0.16%) Azure Service Bus
Communications & Networking
1 71 (11.43%) Cisco IOS
1 71 (11.43%) VPN
2 9 (1.45%) Network Security
3 6 (0.97%) 5G
3 6 (0.97%) Internet
3 6 (0.97%) SD-WAN
3 6 (0.97%) WAN
4 4 (0.64%) DNS
4 4 (0.64%) HTTP
4 4 (0.64%) SMTP
4 4 (0.64%) TCP/IP
5 3 (0.48%) Multicast
5 3 (0.48%) Software-Defined Radio
6 2 (0.32%) Intranet
7 1 (0.16%) Firewall
7 1 (0.16%) SMS
Database & Business Intelligence
1 87 (14.01%) Big Data
2 53 (8.53%) Elasticsearch
3 45 (7.25%) Tableau
4 12 (1.93%) Power BI
5 11 (1.77%) SQL Server
6 8 (1.29%) Redis
7 5 (0.81%) Amazon Athena
7 5 (0.81%) PostgreSQL
8 3 (0.48%) DynamoDB
8 3 (0.48%) NoSQL
8 3 (0.48%) Relational Database
9 2 (0.32%) KDB
9 2 (0.32%) Kdb+
9 2 (0.32%) MongoDB
9 2 (0.32%) MySQL
9 2 (0.32%) QGIS
10 1 (0.16%) Azure SQL Database
10 1 (0.16%) GIS
10 1 (0.16%) Metadata
10 1 (0.16%) QlikView
Development Applications
1 38 (6.12%) Git
2 10 (1.61%) JIRA
3 7 (1.13%) Visual Studio
4 4 (0.64%) Subversion
5 1 (0.16%) Bitbucket
5 1 (0.16%) CMake
General
1 211 (33.98%) Finance
2 188 (30.27%) Analytical Skills
3 177 (28.50%) Inclusion and Diversity
4 128 (20.61%) Banking
5 75 (12.08%) Social Skills
6 46 (7.41%) Presentation Skills
6 46 (7.41%) Retail
7 12 (1.93%) Manufacturing
8 10 (1.61%) Pharmaceutical
9 9 (1.45%) Law
10 8 (1.29%) Games
11 7 (1.13%) Marketing
12 6 (0.97%) Retail Banking
13 5 (0.81%) Electronics
13 5 (0.81%) Front Office
13 5 (0.81%) Influencing Skills
14 3 (0.48%) Billing
14 3 (0.48%) Organisational Skills
15 2 (0.32%) Legal
16 1 (0.16%) Public Speaking
Job Titles
1 143 (23.03%) Trainer
2 103 (16.59%) Analyst
3 98 (15.78%) Senior
4 84 (13.53%) Data Analyst
5 72 (11.59%) Developer
6 71 (11.43%) Infrastructure Engineer
7 65 (10.47%) Data Scientist
8 55 (8.86%) Software Developer
9 38 (6.12%) Software Engineer
10 34 (5.48%) Senior Data Scientist
11 24 (3.86%) Senior Analyst
12 18 (2.90%) Senior Software Engineer
13 12 (1.93%) Senior Data Analyst
13 12 (1.93%) Senior Developer
14 10 (1.61%) C++ Software Engineer
14 10 (1.61%) Technologist
15 9 (1.45%) Principal Data Scientist
16 8 (1.29%) Data Insight Analyst
16 8 (1.29%) Insight Data Analyst
16 8 (1.29%) Lead
Libraries, Frameworks & Software Standards
1 71 (11.43%) Elastic Stack
2 62 (9.98%) .NET
3 60 (9.66%) Software Packaging
4 59 (9.50%) Node.js
5 58 (9.34%) Pandas
6 18 (2.90%) scikit-learn
6 18 (2.90%) TensorFlow
7 12 (1.93%) React
8 11 (1.77%) PySpark
9 9 (1.45%) Keras
9 9 (1.45%) NumPy
9 9 (1.45%) PyTorch
10 7 (1.13%) AngularJS
11 6 (0.97%) ASP.NET
11 6 (0.97%) ASP.NET MVC
11 6 (0.97%) Kafka
12 5 (0.81%) Lambda Expressions
13 3 (0.48%) Boost C++ Libraries
13 3 (0.48%) GraphQL
13 3 (0.48%) pytest
Miscellaneous
1 166 (26.73%) Cyberattack
2 106 (17.07%) Algorithms
3 22 (3.54%) Management Information System
4 15 (2.42%) Self-Motivation
5 10 (1.61%) Credit Risk
6 8 (1.29%) FPGA
7 6 (0.97%) Cloud Native
7 6 (0.97%) Data Structures
7 6 (0.97%) Derivative
7 6 (0.97%) GNSS
7 6 (0.97%) Mainframe
7 6 (0.97%) Public Cloud
7 6 (0.97%) Self-Driving Car
8 5 (0.81%) Greenfield Project
9 4 (0.64%) Analytical Mindset
9 4 (0.64%) Fixed Income
9 4 (0.64%) MicroBlaze
9 4 (0.64%) Tandem
10 3 (0.48%) e-Learning
10 3 (0.48%) Onboarding
Operating Systems
1 146 (23.51%) Linux
2 121 (19.48%) Android
3 85 (13.69%) Windows
4 15 (2.42%) Unix
5 1 (0.16%) Windows Server
Processes & Methodologies
1 302 (48.63%) Artificial Intelligence
2 293 (47.18%) Statistics
3 208 (33.49%) Computer Science
4 207 (33.33%) Line Management
5 192 (30.92%) Problem-Solving
6 188 (30.27%) Software Engineering
7 143 (23.03%) Conversational UI
8 138 (22.22%) Visualisation
9 127 (20.45%) Analytics
10 113 (18.20%) Physics
11 108 (17.39%) Data Science
12 107 (17.23%) DevOps
13 84 (13.53%) Risk Management
14 83 (13.37%) Machine Learning
15 80 (12.88%) Predictive Modelling
16 79 (12.72%) Storytelling
17 78 (12.56%) Fintech
18 75 (12.08%) Agile
19 74 (11.92%) Data Analysis
19 74 (11.92%) Infrastructure Engineering
Programming Languages
1 259 (41.71%) Python
2 118 (19.00%) SQL
3 88 (14.17%) C++
4 85 (13.69%) JavaScript
5 82 (13.20%) Java
6 79 (12.72%) Bash
7 72 (11.59%) PowerShell
8 53 (8.53%) Go
8 53 (8.53%) Rust
9 22 (3.54%) C#
10 21 (3.38%) C
11 17 (2.74%) R
12 14 (2.25%) MATLAB
13 10 (1.61%) TypeScript
14 8 (1.29%) Fortran
15 3 (0.48%) VBA
16 2 (0.32%) PHP
16 2 (0.32%) Shell Script
16 2 (0.32%) Solidity
16 2 (0.32%) T-SQL
Qualifications
1 452 (72.79%) Degree
2 194 (31.24%) Master's Degree
3 175 (28.18%) PhD
4 114 (18.36%) Security Cleared
5 105 (16.91%) DV Cleared
6 50 (8.05%) Numerate Degree
7 34 (5.48%) Computer Science Degree
8 32 (5.15%) DBS Check
9 19 (3.06%) SC Cleared
10 2 (0.32%) CISM
10 2 (0.32%) CISSP
11 1 (0.16%) Azure Certification
11 1 (0.16%) CIPD
11 1 (0.16%) HND
11 1 (0.16%) MCT
11 1 (0.16%) Microsoft Certification
Quality Assurance & Compliance
1 8 (1.29%) QA
2 7 (1.13%) GDPR
3 4 (0.64%) Data Quality
4 3 (0.48%) CDISC
5 2 (0.32%) Accessibility
5 2 (0.32%) NIST
6 1 (0.16%) Actionable Recommendations
6 1 (0.16%) IFRS
6 1 (0.16%) IFRS 9
System Software
1 148 (23.83%) Docker
2 71 (11.43%) Hyper-V
2 71 (11.43%) VMware NSX
2 71 (11.43%) vSphere
3 7 (1.13%) Firmware
4 4 (0.64%) Embedded Firmware
5 2 (0.32%) Active Directory
Systems Management
1 122 (19.65%) Terraform
2 120 (19.32%) Ansible
3 78 (12.56%) Kubernetes
4 1 (0.16%) Microsoft Intune
Vendors
1 143 (23.03%) PayPal
2 72 (11.59%) Cisco
3 71 (11.43%) 3PAR
3 71 (11.43%) Juniper
3 71 (11.43%) Splunk
4 31 (4.99%) Databricks
5 18 (2.90%) Microsoft
6 15 (2.42%) Adobe
7 9 (1.45%) Salesforce
8 7 (1.13%) Google
8 7 (1.13%) Omniture
8 7 (1.13%) TikTok
9 3 (0.48%) Xilinx
10 2 (0.32%) IBM
10 2 (0.32%) Oracle
10 2 (0.32%) Palantir
11 1 (0.16%) Facebook
11 1 (0.16%) Foundry
11 1 (0.16%) Meraki
11 1 (0.16%) Progress