Translating Business Requirements Jobs with Hybrid/Remote/WFH Options

Translate Business Requirements
UK > Work from Home

The table below provides summary statistics for permanent remote or hybrid work requiring Translating Business Requirements skills. It includes a benchmarking guide to the annual salaries offered in vacancies that cited Translating Business Requirements over the 6 months leading up to 21 May 2025, comparing them to the same period in the previous two years.

6 months to
21 May 2025
Same period 2024 Same period 2023
Rank 326 329 358
Rank change year-on-year +3 +29 +70
Permanent jobs citing Translating Business Requirements 141 269 338
As % of all permanent jobs with a WFH option 0.75% 0.80% 0.83%
As % of the Processes & Methodologies category 0.79% 0.87% 0.87%
Number of salaries quoted 117 223 294
10th Percentile £40,750 £33,000 £41,117
25th Percentile £51,250 £45,625 £50,000
Median annual salary (50th Percentile) £65,000 £59,000 £67,071
Median % change year-on-year +10.17% -12.03% +9.63%
75th Percentile £82,500 £72,500 £80,000
90th Percentile £87,152 £95,731 £89,852
UK median annual salary £67,500 £60,000 £66,500
% change year-on-year +12.50% -9.77% +10.83%

All Process and Methodology Skills
Work from Home

Translating Business Requirements falls under the Processes and Methodologies category. For comparison with the information above, the following table provides summary statistics for all permanent job vacancies with remote or hybrid options requiring process or methodology skills.

Permanent vacancies with a requirement for process or methodology skills 17,828 30,838 38,971
As % of all permanent jobs with a WFH option 94.30% 91.21% 96.04%
Number of salaries quoted 9,671 23,338 27,094
10th Percentile £28,000 £33,750 £37,500
25th Percentile £42,500 £42,500 £47,500
Median annual salary (50th Percentile) £59,000 £57,500 £62,500
Median % change year-on-year +2.61% -8.00% +4.17%
75th Percentile £77,500 £75,000 £82,500
90th Percentile £102,500 £95,000 £100,000
UK median annual salary £57,500 £55,000 £61,180
% change year-on-year +4.55% -10.10% +1.97%

Translating Business Requirements
Trend for Jobs with a WFH Option

Job vacancies with remote working options citing Translating Business Requirements as a proportion of all IT jobs advertised.
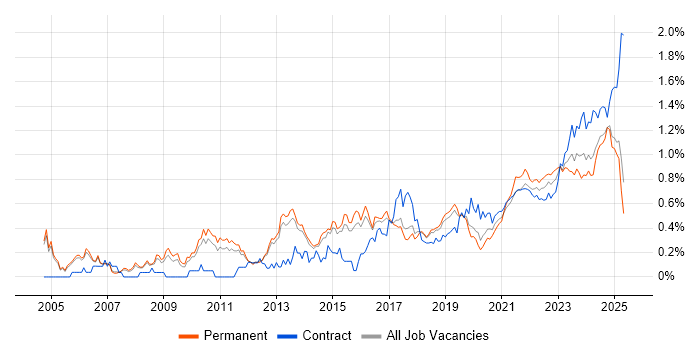
Translating Business Requirements trend for jobs with Hybrid/Remote/WFH options

Translating Business Requirements
Salary Trend for Jobs with a WFH Option

3-month moving average salary quoted in job vacancies with remote working options citing Translating Business Requirements.

Translating Business Requirements salary trend for jobs with a WFH option

Translating Business Requirements
Salary Histogram for Jobs with a WFH Option

Salary distribution for jobs with remote working options citing Translating Business Requirements over the 6 months to 21 May 2025.

Translating Business Requirements salary histogram for jobs with a WFH option

Translating Business Requirements
Co-occurring Skills and Capabilities with WFH Options by Category

The follow tables expand on the table above by listing co-occurrences grouped by category. The same employment type, locality and period is covered with up to 20 co-occurrences shown in each of the following categories:

Application Platforms
1 6 (4.26%) SharePoint
2 5 (3.55%) Confluence
3 3 (2.13%) Apache Airflow
3 3 (2.13%) IIS
4 1 (0.71%) Mendix
Applications
1 8 (5.67%) Microsoft Excel
2 4 (2.84%) MS Visio
2 4 (2.84%) Trello
3 1 (0.71%) Microsoft Office
3 1 (0.71%) Microsoft PowerPoint
3 1 (0.71%) Microsoft Project
Business Applications
1 7 (4.96%) SAP S/4HANA
2 4 (2.84%) Dynamics CRM
3 2 (1.42%) Oracle Assets
3 2 (1.42%) Oracle EBS
3 2 (1.42%) Oracle EBS R12
3 2 (1.42%) Oracle Payables
3 2 (1.42%) Oracle Receivables
4 1 (0.71%) Dynamics AX
4 1 (0.71%) SAP LE
4 1 (0.71%) SAP SD
4 1 (0.71%) Visualfiles
Cloud Services
1 48 (34.04%) Azure
2 37 (26.24%) GCP
3 21 (14.89%) AWS
4 20 (14.18%) Power Platform
5 16 (11.35%) SaaS
6 11 (7.80%) Apigee
6 11 (7.80%) Google Kubernetes Engine
7 10 (7.09%) Dynamics 365
8 8 (5.67%) OpenShift
9 6 (4.26%) Azure DevOps
9 6 (4.26%) Microsoft 365
9 6 (4.26%) PaaS
9 6 (4.26%) PowerApps
10 5 (3.55%) Microsoft Copilot
10 5 (3.55%) Power Automate
11 4 (2.84%) Azure Cosmos DB
11 4 (2.84%) GitHub
11 4 (2.84%) Google Data Studio
11 4 (2.84%) Google Sheets
11 4 (2.84%) Google Tag Manager
Communications & Networking
1 1 (0.71%) Firewall
1 1 (0.71%) LAN
1 1 (0.71%) SD-WAN
1 1 (0.71%) Unified Communications
1 1 (0.71%) VoIP
1 1 (0.71%) WAN
1 1 (0.71%) Wi-Fi
Database & Business Intelligence
1 17 (12.06%) NoSQL
2 13 (9.22%) Power BI
3 7 (4.96%) Data Warehouse
3 7 (4.96%) SQL Server
4 5 (3.55%) Azure SQL Database
5 4 (2.84%) MySQL
5 4 (2.84%) Power Query
6 3 (2.13%) Elasticsearch
7 2 (1.42%) Airbyte
7 2 (1.42%) PostgreSQL
7 2 (1.42%) Tableau
8 1 (0.71%) Big Data
8 1 (0.71%) Flink
8 1 (0.71%) Geospatial Data
8 1 (0.71%) GIS
8 1 (0.71%) Relational Database
8 1 (0.71%) Spatial Data
Development Applications
1 17 (12.06%) Git
2 14 (9.93%) Jenkins
3 11 (7.80%) JUnit
3 11 (7.80%) Maven
3 11 (7.80%) SonarQube
3 11 (7.80%) Sonatype Nexus
4 8 (5.67%) JIRA
5 4 (2.84%) Visual Studio
6 3 (2.13%) Jasmine
6 3 (2.13%) MLflow
6 3 (2.13%) NUnit
6 3 (2.13%) TeamCity
7 2 (1.42%) webpack
8 1 (0.71%) ESLint
8 1 (0.71%) Storybook
General
1 72 (51.06%) Social Skills
2 52 (36.88%) Finance
3 29 (20.57%) Analytical Skills
4 23 (16.31%) Banking
5 20 (14.18%) Inclusion and Diversity
6 17 (12.06%) Manufacturing
7 11 (7.80%) Marketing
7 11 (7.80%) Public Sector
8 10 (7.09%) Retail
9 7 (4.96%) Games
10 4 (2.84%) Telecoms
11 3 (2.13%) Electronics
11 3 (2.13%) Presentation Skills
12 2 (1.42%) Automotive
12 2 (1.42%) Billing
12 2 (1.42%) Documentation Skills
12 2 (1.42%) Influencing Skills
13 1 (0.71%) Aerospace
13 1 (0.71%) Law
13 1 (0.71%) Legal
Job Titles
1 42 (29.79%) Senior
2 29 (20.57%) Analyst
2 29 (20.57%) Architect
3 26 (18.44%) Developer
4 18 (12.77%) Solutions Architect
5 17 (12.06%) Senior Developer
6 15 (10.64%) Software Engineer
7 12 (8.51%) Business Analyst
7 12 (8.51%) Senior Software Engineer
8 10 (7.09%) Product Manager
9 9 (6.38%) Applications Support
9 9 (6.38%) Applications Support Analyst
9 9 (6.38%) Consultant
9 9 (6.38%) Support Analyst
10 7 (4.96%) Senior Architect
11 6 (4.26%) Business Development Analyst
11 6 (4.26%) Development Analyst
11 6 (4.26%) Project Analyst
11 6 (4.26%) Software Analyst
11 6 (4.26%) Software Development Analyst
Libraries, Frameworks & Software Standards
1 24 (17.02%) .NET
2 17 (12.06%) Blazor
2 17 (12.06%) RESTful
3 15 (10.64%) Spring
3 15 (10.64%) Spring Boot
4 14 (9.93%) HTML
5 11 (7.80%) Hibernate
5 11 (7.80%) HTML5
6 8 (5.67%) Bootstrap
7 7 (4.96%) JSON
7 7 (4.96%) React
8 6 (4.26%) CSS
8 6 (4.26%) RabbitMQ
8 6 (4.26%) SAP Fiori
9 5 (3.55%) Kafka
9 5 (3.55%) OpenAPI
10 4 (2.84%) Jest
10 4 (2.84%) PyTorch
10 4 (2.84%) scikit-learn
10 4 (2.84%) TensorFlow
Miscellaneous
1 16 (11.35%) Self-Motivation
2 14 (9.93%) Product Ownership
3 10 (7.09%) Cloud Native
4 9 (6.38%) Manufacturing Execution System
5 8 (5.67%) Private Cloud
6 7 (4.96%) Legacy Systems
6 7 (4.96%) Mobile App
7 5 (3.55%) IoT
7 5 (3.55%) Mobile Games
8 4 (2.84%) Social Media
9 3 (2.13%) Onboarding
9 3 (2.13%) Public Cloud
10 2 (1.42%) Distributed Computing
10 2 (1.42%) Distributed Systems
10 2 (1.42%) Enterprise Software
10 2 (1.42%) Greenfield Project
10 2 (1.42%) LIMS
10 2 (1.42%) Management Information System
10 2 (1.42%) Replication
11 1 (0.71%) PMI
Operating Systems
1 18 (12.77%) Linux
2 11 (7.80%) Unix
Processes & Methodologies
1 66 (46.81%) Agile
2 63 (44.68%) Problem-Solving
3 37 (26.24%) Microservices
3 37 (26.24%) Roadmaps
4 34 (24.11%) Software Engineering
5 28 (19.86%) CI/CD
6 27 (19.15%) Computer Science
7 24 (17.02%) DevOps
8 19 (13.48%) B2B
8 19 (13.48%) Infrastructure as Code
9 17 (12.06%) Analytics
9 17 (12.06%) Architectural Patterns
9 17 (12.06%) Business Intelligence
9 17 (12.06%) Event-Driven
9 17 (12.06%) Test Automation
10 16 (11.35%) Strategic Thinking
11 15 (10.64%) API Design
12 14 (9.93%) Workflow
13 13 (9.22%) B2C
13 13 (9.22%) Stakeholder Management
Programming Languages
1 60 (42.55%) SQL
2 26 (18.44%) JavaScript
3 24 (17.02%) Python
4 17 (12.06%) Java
5 14 (9.93%) C#
6 12 (8.51%) Go
7 9 (6.38%) C-shell
7 9 (6.38%) Korn
7 9 (6.38%) Shell Script
8 8 (5.67%) PL/SQL
9 5 (3.55%) TypeScript
10 3 (2.13%) PowerShell
11 1 (0.71%) ABAP
11 1 (0.71%) Apex Code
Qualifications
1 40 (28.37%) Degree
2 25 (17.73%) Computer Science Degree
3 14 (9.93%) DBS Check
3 14 (9.93%) Security Cleared
4 10 (7.09%) PhD
4 10 (7.09%) SC Cleared
5 9 (6.38%) Master's Degree
6 7 (4.96%) BPSS Clearance
7 4 (2.84%) Microsoft Certification
8 2 (1.42%) Azure Certification
8 2 (1.42%) Oracle Certification
8 2 (1.42%) PMI Certification
8 2 (1.42%) SAP Certification
9 1 (0.71%) CBAP
9 1 (0.71%) CISSP
9 1 (0.71%) GISP
9 1 (0.71%) PMP
9 1 (0.71%) PRINCE2 Practitioner
Quality Assurance & Compliance
1 8 (5.67%) QA
2 3 (2.13%) Accessibility
2 3 (2.13%) Data Quality
3 2 (1.42%) GDPR
3 2 (1.42%) SLA
4 1 (0.71%) HIPAA
4 1 (0.71%) PMO
4 1 (0.71%) Sarbanes-Oxley
System Software
1 25 (17.73%) Docker
2 3 (2.13%) Active Directory
Systems Management
1 25 (17.73%) Kubernetes
2 18 (12.77%) Terraform
3 11 (7.80%) Istio
4 1 (0.71%) FortiGate
4 1 (0.71%) Grafana
4 1 (0.71%) Marathon
Vendors
1 25 (17.73%) Microsoft
2 19 (13.48%) Google
3 12 (8.51%) Oracle
4 10 (7.09%) SAP
5 4 (2.84%) Avaloq
6 3 (2.13%) Rollbar
7 2 (1.42%) Cisco
7 2 (1.42%) Sun
8 1 (0.71%) Cognos
8 1 (0.71%) Conga
8 1 (0.71%) Databricks
8 1 (0.71%) DocuSign
8 1 (0.71%) IBM
8 1 (0.71%) Mapbox
8 1 (0.71%) Mitel
8 1 (0.71%) MuleSoft
8 1 (0.71%) Salesforce