Information Management
UK

The following table provides summary statistics for permanent job vacancies with a requirement for Information Management skills. Included is a benchmarking guide to the salaries offered in vacancies that have cited Information Management over the 6 months to 10 May 2024 with a comparison to the same period in the previous 2 years.

6 months to
10 May 2024
Same period 2023 Same period 2022
Rank 495 421 471
Rank change year-on-year -74 +50 +33
Permanent jobs citing Information Management 459 760 1,173
As % of all permanent jobs advertised in the UK 0.46% 0.75% 0.75%
As % of the Processes & Methodologies category 0.54% 0.79% 0.78%
Number of salaries quoted 271 297 498
10th Percentile £30,000 £35,500 £35,985
25th Percentile £41,250 £39,437 £41,250
Median annual salary (50th Percentile) £52,500 £53,519 £55,000
Median % change year-on-year -1.90% -2.69% +10.00%
75th Percentile £65,000 £70,000 £72,500
90th Percentile £87,500 £88,750 £83,750
UK excluding London median annual salary £53,100 £46,350 £50,000
% change year-on-year +14.56% -7.30% +5.26%

All Process and Methodology Skills
UK

Information Management is in the Processes and Methodologies category. The following table is for comparison with the above and provides summary statistics for all permanent job vacancies with a requirement for process or methodology skills.

Permanent vacancies with a requirement for process or methodology skills 84,917 96,578 150,488
As % of all permanent jobs advertised in the UK 85.59% 95.61% 95.67%
Number of salaries quoted 59,883 56,844 82,330
10th Percentile £29,008 £34,000 £33,515
25th Percentile £40,000 £45,000 £43,750
Median annual salary (50th Percentile) £55,000 £61,190 £60,000
Median % change year-on-year -10.12% +1.98% +9.09%
75th Percentile £72,500 £81,250 £80,000
90th Percentile £92,500 £100,000 £96,250
UK excluding London median annual salary £50,000 £55,000 £52,500
% change year-on-year -9.09% +4.76% +9.38%

Information Management
Job Vacancy Trend

Job postings citing Information Management as a proportion of all IT jobs advertised.
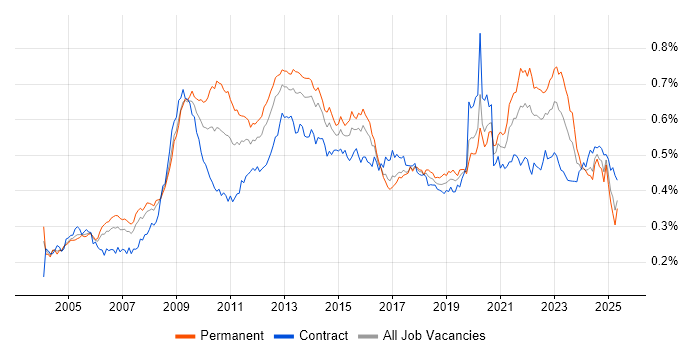
Job vacancy trend for Information Management in the UK

Information Management
Salary Trend

3-month moving average salary quoted in jobs citing Information Management.

Salary trend for Information Management in the UK

Information Management
Salary Histogram

Salary distribution for jobs citing Information Management over the 6 months to 10 May 2024.

Salary histogram for Information Management in the UK

Information Management
Top 17 Job Locations

The table below looks at the demand and provides a guide to the median salaries quoted in IT jobs citing Information Management within the UK over the 6 months to 10 May 2024. The 'Rank Change' column provides an indication of the change in demand within each location based on the same 6 month period last year.

Location Rank Change
on Same Period
Last Year
Matching
Permanent
IT Job Ads
Median Salary
Past 6 Months
Median Salary
% Change
on Same Period
Last Year
Live
Jobs
England -50 411 £54,650 -0.64% 177
UK excluding London -103 341 £53,100 +14.56% 140
Work from Home +74 148 £55,000 -6.78% 55
Midlands -28 96 £55,000 +41.03% 15
London +17 89 £53,750 -17.94% 52
North of England +34 79 £60,000 +33.33% 47
South East -63 69 £53,100 +14.56% 24
West Midlands +9 67 £59,300 +52.05% 7
North West +51 59 £50,000 +5.26% 23
East of England -3 37 £47,500 -3.06% 19
South West -29 36 £58,000 +16.00% 19
East Midlands -39 29 £41,492 -26.56% 8
Yorkshire +35 16 £85,000 +29.77% 14
Northern Ireland +35 15 £30,000 -20.00% 1
Wales -4 8 £52,956 +2.68% 2
North East -15 4 £60,000 +60.00% 10
Scotland -97 1 £97,500 - 15

Information Management
Co-occurring Skills and Capabilities by Category

The follow tables expand on the table above by listing co-occurrences grouped by category. The same employment type, locality and period is covered with up to 20 co-occurrences shown in each of the following categories:

Application Platforms
1 27 (5.88%) WebLogic
2 21 (4.58%) SharePoint
3 10 (2.18%) Microsoft Exchange
4 8 (1.74%) SAS
5 6 (1.31%) IIS
6 3 (0.65%) CMS
6 3 (0.65%) Smallworld
7 2 (0.44%) Kentico
8 1 (0.22%) Alfresco
8 1 (0.22%) Documentum
8 1 (0.22%) Drupal
8 1 (0.22%) Sitecore CMS
8 1 (0.22%) Umbraco
Applications
1 55 (11.98%) Microsoft Excel
2 34 (7.41%) Microsoft Office
3 27 (5.88%) Microsoft PowerPoint
4 10 (2.18%) Spreadsheet
5 6 (1.31%) AutoCAD
6 5 (1.09%) MS Visio
7 4 (0.87%) Trello
8 3 (0.65%) SPSS
9 2 (0.44%) Adobe Creative Suite
9 2 (0.44%) Sketch
10 1 (0.22%) Revit
Business Applications
1 3 (0.65%) SAP CRM
1 3 (0.65%) SAP ERP
1 3 (0.65%) SAP PM
2 2 (0.44%) MIS ActiveH
2 2 (0.44%) NEC Housing
2 2 (0.44%) SAP S/4HANA
3 1 (0.22%) Salesforce CRM
3 1 (0.22%) SAP HR
3 1 (0.22%) SAP MDM
3 1 (0.22%) SAP Retail
Cloud Services
1 41 (8.93%) Azure
2 26 (5.66%) Power Platform
3 18 (3.92%) SaaS
4 13 (2.83%) Microsoft 365
4 13 (2.83%) PaaS
5 12 (2.61%) AWS
6 11 (2.40%) IaaS
7 8 (1.74%) Azure Stack
8 6 (1.31%) Entra ID
9 3 (0.65%) Collibra
9 3 (0.65%) GCP
9 3 (0.65%) Google Sheets
9 3 (0.65%) Power Automate
10 2 (0.44%) Figma
10 2 (0.44%) Mimecast
10 2 (0.44%) OneDrive
10 2 (0.44%) PowerApps
11 1 (0.22%) Azure DevOps
11 1 (0.22%) Boomi
11 1 (0.22%) SuccessFactors
Communications & Networking
1 19 (4.14%) Firewall
2 16 (3.49%) Network Security
3 15 (3.27%) DNS
4 6 (1.31%) Intranet
5 4 (0.87%) TCP/IP
6 2 (0.44%) DHCP
6 2 (0.44%) LAN
6 2 (0.44%) VoIP
6 2 (0.44%) Wireless
7 1 (0.22%) Internet
Database & Business Intelligence
1 52 (11.33%) Data Warehouse
2 48 (10.46%) Metadata
3 27 (5.88%) Elasticsearch
4 26 (5.66%) Power BI
5 14 (3.05%) Relational Database
6 12 (2.61%) SQL Server
7 8 (1.74%) Data Mining
7 8 (1.74%) Tableau
8 6 (1.31%) Power Query
8 6 (1.31%) RDBMS
9 5 (1.09%) Amazon Redshift
9 5 (1.09%) Azure SQL Data Warehouse
10 4 (0.87%) Geospatial Data
10 4 (0.87%) SAS Data Integration Studio
10 4 (0.87%) Spatial Data
11 3 (0.65%) Apache Cassandra
11 3 (0.65%) Ataccama
11 3 (0.65%) Electronic Patient Records
11 3 (0.65%) MongoDB
11 3 (0.65%) NoSQL
Development Applications
1 5 (1.09%) Hudson
1 5 (1.09%) JIRA
2 2 (0.44%) Ant
2 2 (0.44%) Jenkins
2 2 (0.44%) Subversion
2 2 (0.44%) webpack
3 1 (0.22%) Visual Studio
General
1 132 (28.76%) Social Skills
2 99 (21.57%) Analytical Skills
3 55 (11.98%) Finance
4 35 (7.63%) Public Sector
5 29 (6.32%) Police
6 28 (6.10%) Legal
7 25 (5.45%) Aerospace
7 25 (5.45%) Retail
8 19 (4.14%) Organisational Skills
9 13 (2.83%) Inclusion and Diversity
10 9 (1.96%) Manufacturing
10 9 (1.96%) Telecoms
11 7 (1.53%) Local Government
11 7 (1.53%) Presentation Skills
12 5 (1.09%) Marketing
12 5 (1.09%) Social Housing
13 3 (0.65%) Advertising
13 3 (0.65%) Electronics
13 3 (0.65%) Influencing Skills
13 3 (0.65%) Welsh Language
Job Titles
1 88 (19.17%) Senior
2 71 (15.47%) Analyst
3 61 (13.29%) Architect
4 55 (11.98%) Data Architect
5 42 (9.15%) Information Manager
6 34 (7.41%) Lead
7 33 (7.19%) Senior Analyst
8 27 (5.88%) Applications Support
8 27 (5.88%) Applications Support Analyst
8 27 (5.88%) Senior Applications Support
8 27 (5.88%) Senior Applications Support Analyst
8 27 (5.88%) Senior Support Analyst
8 27 (5.88%) Support Analyst
9 22 (4.79%) Data Analyst
9 22 (4.79%) Data Manager
9 22 (4.79%) Senior Architect
9 22 (4.79%) Senior Data Architect
10 18 (3.92%) Senior Manager
11 15 (3.27%) Software Manager
12 14 (3.05%) Technology Director
Libraries, Frameworks & Software Standards
1 28 (6.10%) Spring
2 27 (5.88%) J2EE
2 27 (5.88%) Java EE
3 10 (2.18%) .NET
4 7 (1.53%) CSS
4 7 (1.53%) HTML
5 6 (1.31%) .NET Framework
6 4 (0.87%) Java RMI
6 4 (0.87%) Web Services
7 3 (0.65%) JSON
8 2 (0.44%) .NET Core
8 2 (0.44%) ASP.NET
8 2 (0.44%) EDI
8 2 (0.44%) jQuery
8 2 (0.44%) Lightning Web Components
8 2 (0.44%) Middleware
8 2 (0.44%) React
8 2 (0.44%) SOAP
9 1 (0.22%) pyodbc
9 1 (0.22%) Tkinter
Miscellaneous
1 200 (43.57%) Management Information System
2 33 (7.19%) Taxonomies
3 30 (6.54%) Self-Motivation
4 18 (3.92%) Freedom of Information
4 18 (3.92%) Product Ownership
5 17 (3.70%) LIMS
6 14 (3.05%) Reference Data
7 12 (2.61%) IoT
8 9 (1.96%) Housing Association
9 8 (1.74%) Cloud Native
9 8 (1.74%) Distributed Systems
10 7 (1.53%) Data Centre
11 6 (1.31%) Data Structures
12 5 (1.09%) Enterprise Software
12 5 (1.09%) Onboarding
13 4 (0.87%) Algorithms
13 4 (0.87%) Driving Licence
13 4 (0.87%) Low-Code
13 4 (0.87%) NHS
14 2 (0.44%) Client/Server
Operating Systems
1 27 (5.88%) Unix
2 21 (4.58%) Windows
3 10 (2.18%) Windows Server
4 9 (1.96%) Linux
5 4 (0.87%) Windows 10
5 4 (0.87%) Windows Server 2016
6 2 (0.44%) Mac OS X
6 2 (0.44%) Windows Server 2012
6 2 (0.44%) Windows Server 2019
Processes & Methodologies
1 119 (25.93%) Problem-Solving
2 90 (19.61%) Data Management
3 89 (19.39%) Business Intelligence
4 82 (17.86%) Analytics
5 75 (16.34%) Project Management
6 68 (14.81%) Data Modelling
7 62 (13.51%) Computer Science
8 61 (13.29%) Data Governance
9 58 (12.64%) Information Security
10 56 (12.20%) ITIL
11 52 (11.33%) Data Architecture
12 49 (10.68%) Cybersecurity
13 47 (10.24%) Agile
14 45 (9.80%) Data Analysis
15 43 (9.37%) Decision-Making
15 43 (9.37%) Roadmaps
16 41 (8.93%) Actionable Insight
16 41 (8.93%) Data Strategy
16 41 (8.93%) Incident Management
17 39 (8.50%) DevOps
Programming Languages
1 52 (11.33%) SQL
2 36 (7.84%) Java
3 27 (5.88%) Shell Script
4 22 (4.79%) Python
5 14 (3.05%) JavaScript
6 7 (1.53%) VBA
7 4 (0.87%) PowerShell
7 4 (0.87%) R
8 3 (0.65%) Bash
8 3 (0.65%) C
8 3 (0.65%) C#
8 3 (0.65%) Perl
9 2 (0.44%) Apex Code
9 2 (0.44%) VB
10 1 (0.22%) Scala
Qualifications
1 114 (24.84%) Degree
2 77 (16.78%) Security Cleared
3 44 (9.59%) SC Cleared
4 31 (6.75%) DV Cleared
5 12 (2.61%) APMP
5 12 (2.61%) CISM
5 12 (2.61%) CISSP
6 8 (1.74%) BPSS Clearance
6 8 (1.74%) DBS Check
6 8 (1.74%) PMI Certification
6 8 (1.74%) PMP
7 7 (1.53%) Computer Science Degree
8 6 (1.31%) HNC
8 6 (1.31%) Postgraduate
9 5 (1.09%) CESG Certified Professional
9 5 (1.09%) Cisco Certification
9 5 (1.09%) Numerate Degree
10 4 (0.87%) ISO 27001 Lead Auditor
10 4 (0.87%) ISO 27001 Lead Implementer
10 4 (0.87%) Microsoft Certification
Quality Assurance & Compliance
1 42 (9.15%) Data Quality
2 27 (5.88%) SLA
3 14 (3.05%) GDPR
4 13 (2.83%) ISO/IEC 27001
5 12 (2.61%) QA
6 8 (1.74%) PMO
7 7 (1.53%) Cyber Essentials
7 7 (1.53%) Cyber Essentials PLUS
8 6 (1.31%) Accessibility
8 6 (1.31%) JSP 440
8 6 (1.31%) NCSC
8 6 (1.31%) NIST
8 6 (1.31%) RMADS
9 2 (0.44%) HMG Security Policy Framework
10 1 (0.22%) California Consumer Privacy Act
10 1 (0.22%) CDISC
10 1 (0.22%) COBIT
10 1 (0.22%) Government Security Classifications
10 1 (0.22%) ISO/IEC 27002 (supersedes ISO/IEC 17799)
10 1 (0.22%) MiFID
System Software
1 17 (3.70%) Active Directory
2 10 (2.18%) Hyper-V
3 8 (1.74%) VMware Infrastructure
4 6 (1.31%) Forefront TMG
4 6 (1.31%) VMware Workstation
5 2 (0.44%) Virtual Machines
5 2 (0.44%) VMware ESXi
5 2 (0.44%) vSphere
6 1 (0.22%) Docker
Systems Management
1 27 (5.88%) OpenSSO
1 27 (5.88%) Single Sign-On
2 10 (2.18%) WSUS
3 6 (1.31%) SCOM
4 3 (0.65%) Kubernetes
5 2 (0.44%) Dell DRAC
5 2 (0.44%) Microsoft Intune
5 2 (0.44%) WebSphere Cast Iron
Vendors
1 76 (16.56%) Microsoft
2 35 (7.63%) Oracle
3 27 (5.88%) Remedy
4 21 (4.58%) Cisco
5 15 (3.27%) Autodesk
6 13 (2.83%) Blue Coat
6 13 (2.83%) CheckPoint
6 13 (2.83%) Infoblox
6 13 (2.83%) Juniper
6 13 (2.83%) Palo Alto
6 13 (2.83%) Riverbed
7 11 (2.40%) SAP
8 10 (2.18%) VMware
9 6 (1.31%) Apple
10 5 (1.09%) Salesforce
11 4 (0.87%) Acronis
11 4 (0.87%) Citrix
11 4 (0.87%) Dell
11 4 (0.87%) Veeam
12 3 (0.65%) F5