XML Jobs with Work from Home Options

XML
UK > Work from Home

The table below provides summary statistics for permanent job vacancies with an option to work from home (WFH) and a requirement for XML skills. Included is a benchmarking guide to the salaries offered in vacancies that have cited XML over the 6 months to 14 May 2024 with a comparison to the same period in the previous 2 years.

6 months to
14 May 2024
Same period 2023 Same period 2022
Rank 306 240 195
Rank change year-on-year -66 -45 +11
Permanent jobs citing XML 331 590 1,449
As % of all permanent jobs with a WFH option 0.98% 1.44% 2.07%
As % of the Libraries, Frameworks & Software Standards category 3.68% 4.25% 4.58%
Number of salaries quoted 261 463 954
10th Percentile £40,000 £40,000 £34,825
25th Percentile £47,500 £50,000 £43,769
Median annual salary (50th Percentile) £60,000 £62,500 £55,000
Median % change year-on-year -4.00% +13.64% +10.00%
75th Percentile £71,250 £76,875 £72,500
90th Percentile £83,750 £90,000 £93,750
UK median annual salary £58,000 £62,500 £57,000
% change year-on-year -7.20% +9.65% +3.64%

All Software Libraries and Frameworks
Work from Home

XML is in the Software Libraries and Frameworks category. The following table is for comparison with the above and provides summary statistics for all permanent job vacancies with a WFH option and a requirement for technical specification, industry standards, software libraries and framework skills.

Permanent vacancies with a requirement for technical specification, industry standards, software libraries and framework skills 8,994 13,884 31,631
As % of all permanent jobs with a WFH option 26.71% 33.89% 45.28%
Number of salaries quoted 7,519 10,435 17,201
10th Percentile £38,750 £41,250 £38,750
25th Percentile £47,500 £51,104 £46,625
Median annual salary (50th Percentile) £60,000 £65,000 £62,500
Median % change year-on-year -7.69% +4.00% +13.64%
75th Percentile £79,500 £86,250 £81,250
90th Percentile £100,000 £102,500 £95,000
UK median annual salary £60,000 £67,500 £63,500
% change year-on-year -11.11% +6.30% +15.45%

XML
Trend for Jobs with a WFH Option

Job vacancies with a work from home option citing XML as a proportion of all IT jobs advertised.
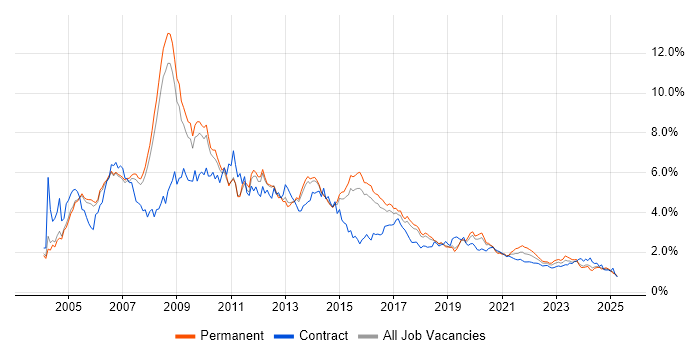
XML trend for jobs with a WFH option

XML
Salary Trend for Jobs with a WFH Option

3-month moving average salary quoted in job vacancies with a work from home option citing XML.

XML salary trend for jobs with a WFH option

XML
Salary Histogram for Jobs with a WFH Option

Salary distribution for jobs with a work from home option citing XML over the 6 months to 14 May 2024.

XML salary histogram for jobs with a WFH option

XML
Co-occurring Skills and Capabilities with WFH Options by Category

The follow tables expand on the table above by listing co-occurrences grouped by category. The same employment type, locality and period is covered with up to 20 co-occurrences shown in each of the following categories:

Application Platforms
1 46 (13.90%) IIS
2 17 (5.14%) CMS
3 15 (4.53%) OpenStack
4 9 (2.72%) Apache
5 8 (2.42%) SharePoint
6 7 (2.11%) Confluence
7 6 (1.81%) BizTalk Server
8 4 (1.21%) EPiServer
9 3 (0.91%) Drupal
10 2 (0.60%) Apache Solr
10 2 (0.60%) Apache Spark
10 2 (0.60%) CICS
10 2 (0.60%) Oracle Workflow
10 2 (0.60%) Tomcat
11 1 (0.30%) Apache Airflow
11 1 (0.30%) ArcGIS
11 1 (0.30%) Headless CMS
11 1 (0.30%) JBoss
11 1 (0.30%) Red Hat Fuse
11 1 (0.30%) WildFly
Applications
1 11 (3.32%) Microsoft Office
2 5 (1.51%) Microsoft Excel
3 1 (0.30%) Acrobat
3 1 (0.30%) FrameMaker
3 1 (0.30%) Notion
Business Applications
1 10 (3.02%) Dynamics CRM
2 6 (1.81%) Remedy ITSM
3 2 (0.60%) Magento
3 2 (0.60%) Oracle EBS
3 2 (0.60%) Oracle EBS R12
3 2 (0.60%) Oracle Receivables
3 2 (0.60%) SAP MII
3 2 (0.60%) Unit4 Business World
4 1 (0.30%) NetSuite
4 1 (0.30%) Payment Gateway
Cloud Services
1 130 (39.27%) Azure
2 76 (22.96%) Azure DevOps
3 47 (14.20%) AWS
4 23 (6.95%) Power Platform
4 23 (6.95%) SaaS
5 22 (6.65%) Amazon ECS
6 21 (6.34%) Serverless
7 17 (5.14%) Amazon EKS
8 9 (2.72%) PaaS
9 8 (2.42%) Dynamics 365
9 8 (2.42%) Power Automate
10 7 (2.11%) Azure Data Factory
10 7 (2.11%) Google Analytics
11 5 (1.51%) Amazon SQS
11 5 (1.51%) Azure Cognitive Services
11 5 (1.51%) Azure Synapse Analytics
11 5 (1.51%) OCI
12 4 (1.21%) GitHub
12 4 (1.21%) PowerApps
13 3 (0.91%) GCP
Communications & Networking
1 12 (3.63%) HTTP
2 11 (3.32%) Internet
2 11 (3.32%) SSL
3 10 (3.02%) VPN
4 5 (1.51%) FTP
5 4 (1.21%) DNS
5 4 (1.21%) TCP/IP
6 3 (0.91%) Intranet
7 2 (0.60%) HTTPS
7 2 (0.60%) iSCSI
8 1 (0.30%) Remote Desktop
8 1 (0.30%) SMTP
Database & Business Intelligence
1 94 (28.40%) SQL Server
2 39 (11.78%) PostgreSQL
3 30 (9.06%) NoSQL
4 23 (6.95%) Data Warehouse
5 22 (6.65%) MySQL
6 18 (5.44%) Relational Database
7 13 (3.93%) OLTP
8 11 (3.32%) DynamoDB
8 11 (3.32%) Power BI
9 10 (3.02%) MongoDB
10 7 (2.11%) SQL Server Integration Services
11 6 (1.81%) Data Lake
11 6 (1.81%) Tableau
12 5 (1.51%) Oracle Database
13 4 (1.21%) HDInsight
13 4 (1.21%) InfluxDB
13 4 (1.21%) Looker
13 4 (1.21%) QlikView
13 4 (1.21%) Redis
14 3 (0.91%) SQL Server Reporting Services
Development Applications
1 65 (19.64%) Git
2 39 (11.78%) Visual Studio
3 28 (8.46%) Jasmine
3 28 (8.46%) Karma Test Runner
4 27 (8.16%) Jenkins
5 18 (5.44%) JIRA
6 17 (5.14%) Eclipse
7 15 (4.53%) CMake
7 15 (4.53%) Postman
7 15 (4.53%) Subversion
8 12 (3.63%) Maven
9 11 (3.32%) GitLab
10 9 (2.72%) SoapUI
11 8 (2.42%) JUnit
12 6 (1.81%) Oracle APEX
13 5 (1.51%) Visual Studio Code
14 4 (1.21%) JMeter
14 4 (1.21%) Katalon Studio
14 4 (1.21%) Team Foundation Server
15 3 (0.91%) SQL Server Management Studio (SSMS)
General
1 73 (22.05%) Social Skills
2 35 (10.57%) Finance
3 34 (10.27%) Retail
4 25 (7.55%) Analytical Skills
4 25 (7.55%) Legal
5 19 (5.74%) Law
6 18 (5.44%) Public Sector
7 16 (4.83%) Banking
7 16 (4.83%) Inclusion and Diversity
8 15 (4.53%) Military
9 12 (3.63%) Publishing
10 7 (2.11%) Organisational Skills
11 6 (1.81%) Local Government
12 5 (1.51%) Aerospace
13 4 (1.21%) Electronics
13 4 (1.21%) Manufacturing
13 4 (1.21%) Pharmaceutical
13 4 (1.21%) Welsh Language
14 3 (0.91%) Marketing
14 3 (0.91%) Wearables
Job Titles
1 167 (50.45%) Developer
2 82 (24.77%) Senior
3 45 (13.60%) Senior Developer
4 37 (11.18%) C# Developer
5 31 (9.37%) Java Developer
6 30 (9.06%) Analyst
6 30 (9.06%) Software Engineer
7 29 (8.76%) Lead
8 21 (6.34%) .NET Developer
9 19 (5.74%) Senior Software Engineer
10 18 (5.44%) Software Developer
11 17 (5.14%) Oracle Developer
12 16 (4.83%) C++ Software Engineer
13 15 (4.53%) Senior C++ Software Engineer
13 15 (4.53%) Senior Oracle Developer
14 14 (4.23%) Consultant
14 14 (4.23%) Technical Consultant
14 14 (4.23%) Technical Leader
15 13 (3.93%) SC Cleared Java Developer
16 12 (3.63%) PL/SQL Developer
Libraries, Frameworks & Software Standards
1 178 (53.78%) JSON
2 141 (42.60%) .NET
3 133 (40.18%) Web Services
4 128 (38.67%) HTML
5 125 (37.76%) REST
6 106 (32.02%) SOAP
7 88 (26.59%) CSS
8 81 (24.47%) AngularJS
9 66 (19.94%) ASP.NET
10 40 (12.08%) .NET Framework
11 34 (10.27%) Spring
12 33 (9.97%) XML Schema
13 32 (9.67%) Node.js
14 31 (9.37%) Sass
14 31 (9.37%) Spring Boot
15 30 (9.06%) React
16 29 (8.76%) XSL
17 28 (8.46%) RxJS
18 27 (8.16%) XSLT
19 23 (6.95%) Twitter Bootstrap
Miscellaneous
1 18 (5.44%) Product Ownership
2 16 (4.83%) Algorithms
2 16 (4.83%) Distributed Systems
3 15 (4.53%) Data Structures
4 12 (3.63%) Management Information System
5 11 (3.32%) Self-Motivation
6 9 (2.72%) NHS
7 6 (1.81%) CMDB
7 6 (1.81%) Enterprise Software
7 6 (1.81%) Mobile App
8 5 (1.51%) Blog
8 5 (1.51%) Cloud Native
8 5 (1.51%) Distributed Applications
9 4 (1.21%) Digital Media
9 4 (1.21%) Onboarding
9 4 (1.21%) Private Cloud
10 3 (0.91%) Client/Server
10 3 (0.91%) Clustering
10 3 (0.91%) Greenfield Project
10 3 (0.91%) Replication
Operating Systems
1 42 (12.69%) Windows
2 31 (9.37%) Linux
3 9 (2.72%) Unix
4 5 (1.51%) Android
4 5 (1.51%) Apple iOS
5 4 (1.21%) Windows Server
6 2 (0.60%) AIX
6 2 (0.60%) Oracle Linux
6 2 (0.60%) zOS
7 1 (0.30%) Mac OS
7 1 (0.30%) VMS
Processes & Methodologies
1 131 (39.58%) Agile
2 125 (37.76%) DevOps
3 61 (18.43%) Scrum
4 52 (15.71%) Mentoring
5 48 (14.50%) Unit Testing
6 47 (14.20%) Problem-Solving
7 42 (12.69%) Software Engineering
8 41 (12.39%) Web Development
9 39 (11.78%) OO
10 38 (11.48%) CI/CD
10 38 (11.48%) Roadmaps
11 36 (10.88%) Computer Science
11 36 (10.88%) Customer Service
12 35 (10.57%) Continuous Improvement
12 35 (10.57%) Design Patterns
12 35 (10.57%) Microservices
12 35 (10.57%) MVC
13 30 (9.06%) BDD
13 30 (9.06%) SDLC
14 29 (8.76%) User Acceptance Testing
Programming Languages
1 168 (50.76%) SQL
2 146 (44.11%) JavaScript
3 126 (38.07%) C#
4 58 (17.52%) Java
5 57 (17.22%) T-SQL
6 53 (16.01%) Python
7 44 (13.29%) TypeScript
7 44 (13.29%) VB.NET
8 34 (10.27%) VB
9 28 (8.46%) VB6
10 23 (6.95%) PowerShell
11 22 (6.65%) PL/SQL
11 22 (6.65%) XPath
12 19 (5.74%) C++
13 18 (5.44%) PHP
14 11 (3.32%) Ruby
15 10 (3.02%) RPG
16 6 (1.81%) C
16 6 (1.81%) Tcl
17 4 (1.21%) ActionScript
Qualifications
1 61 (18.43%) Security Cleared
2 54 (16.31%) Degree
3 51 (15.41%) SC Cleared
4 35 (10.57%) Computer Science Degree
5 7 (2.11%) DV Cleared
6 6 (1.81%) ITIL Foundation Certificate
7 5 (1.51%) Azure Certification
7 5 (1.51%) HNC
7 5 (1.51%) ISTQB
8 4 (1.21%) AWS Certification
8 4 (1.21%) BPSS Clearance
8 4 (1.21%) CIPD
8 4 (1.21%) DBS Check
8 4 (1.21%) GIAC
9 1 (0.30%) ISEB
9 1 (0.30%) ISTQB Foundation Certification
9 1 (0.30%) Microsoft Certification
Quality Assurance & Compliance
1 62 (18.73%) QA
2 9 (2.72%) Accessibility
2 9 (2.72%) GDPR
3 5 (1.51%) Data Quality
4 4 (1.21%) California Consumer Privacy Act
5 2 (0.60%) HL7
5 2 (0.60%) SEPA
5 2 (0.60%) SLA
6 1 (0.30%) ISO 9001
System Software
1 31 (9.37%) Docker
2 17 (5.14%) Hyper-V
3 5 (1.51%) VMware Infrastructure
4 4 (1.21%) VMware ESXi
4 4 (1.21%) VMware Server
5 2 (0.60%) RACF
5 2 (0.60%) Time Sharing Option
5 2 (0.60%) Virtual Machines
5 2 (0.60%) vSphere
6 1 (0.30%) Firmware
Systems Management
1 28 (8.46%) Ansible
2 25 (7.55%) Kubernetes
3 23 (6.95%) Terraform
4 6 (1.81%) HP UCMDB
5 4 (1.21%) Grafana
5 4 (1.21%) Progress Chef
5 4 (1.21%) Puppet
5 4 (1.21%) vRealize
6 2 (0.60%) MAINVIEW
6 2 (0.60%) Microsoft Clustering
7 1 (0.30%) Kibana
7 1 (0.30%) Plesk
Vendors
1 99 (29.91%) Microsoft
2 37 (11.18%) Oracle
3 21 (6.34%) ServiceNow
4 15 (4.53%) WSO2
5 11 (3.32%) Google
6 9 (2.72%) VMware
7 8 (2.42%) BMC
8 7 (2.11%) Salesforce
9 6 (1.81%) HP
9 6 (1.81%) Remedy
10 5 (1.51%) Databricks
10 5 (1.51%) Northgate
10 5 (1.51%) SAP
11 4 (1.21%) Automation Anywhere
11 4 (1.21%) Blue Prism
11 4 (1.21%) Cisco
11 4 (1.21%) IBM
11 4 (1.21%) SaltStack
11 4 (1.21%) UiPath
12 3 (0.91%) Sybase