Ansible Jobs with Hybrid/Remote/WFH Options

Ansible
UK > Work from Home

The table below provides summary statistics for permanent remote or hybrid work requiring Ansible skills. It includes a benchmarking guide to the annual salaries offered in vacancies that cited Ansible over the 6 months leading up to 5 May 2025, comparing them to the same period in the previous two years.

6 months to
5 May 2025
Same period 2024 Same period 2023
Rank 172 156 108
Rank change year-on-year -16 -48 +2
Permanent jobs citing Ansible 301 725 1,312
As % of all permanent jobs with a WFH option 1.95% 2.15% 3.10%
As % of the Systems Management category 16.81% 18.51% 19.39%
Number of salaries quoted 168 491 761
10th Percentile £52,125 £41,500 £47,250
25th Percentile £64,688 £53,063 £57,500
Median annual salary (50th Percentile) £75,000 £70,000 £75,000
Median % change year-on-year +7.14% -6.67% +7.14%
75th Percentile £87,500 £85,000 £92,500
90th Percentile £98,474 £102,500 £105,000
UK median annual salary £75,000 £70,000 £72,500
% change year-on-year +7.14% -3.45% +3.57%

All Systems Management Skills
Work from Home

Ansible falls under the Systems Management category. For comparison with the information above, the following table provides summary statistics for all permanent job vacancies with remote or hybrid options requiring systems management skills.

Permanent vacancies with a requirement for systems management skills 1,791 3,917 6,767
As % of all permanent jobs with a WFH option 11.62% 11.59% 15.97%
Number of salaries quoted 1,332 2,973 4,789
10th Percentile £41,000 £37,101 £41,250
25th Percentile £51,831 £47,500 £52,500
Median annual salary (50th Percentile) £70,000 £65,000 £69,447
Median % change year-on-year +7.69% -6.40% -0.79%
75th Percentile £90,000 £83,750 £88,750
90th Percentile £115,000 £102,500 £105,000
UK median annual salary £67,813 £60,000 £67,500
% change year-on-year +13.02% -11.11% -3.57%

Ansible
Trend for Jobs with a WFH Option

Job vacancies with remote working options citing Ansible as a proportion of all IT jobs advertised.
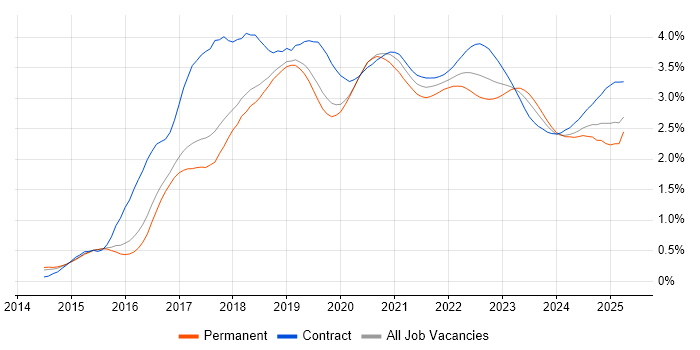
Ansible trend for jobs with Hybrid/Remote/WFH options

Ansible
Salary Trend for Jobs with a WFH Option

3-month moving average salary quoted in job vacancies with remote working options citing Ansible.

Ansible salary trend for jobs with a WFH option

Ansible
Salary Histogram for Jobs with a WFH Option

Salary distribution for jobs with remote working options citing Ansible over the 6 months to 5 May 2025.

Ansible salary histogram for jobs with a WFH option

Ansible
Co-occurring Skills and Capabilities with WFH Options by Category

The follow tables expand on the table above by listing co-occurrences grouped by category. The same employment type, locality and period is covered with up to 20 co-occurrences shown in each of the following categories:

Application Platforms
1 11 (3.65%) Confluence
1 11 (3.65%) nginx
2 9 (2.99%) Apache
2 9 (2.99%) Apache Solr
3 6 (1.99%) IIS
4 5 (1.66%) Apache Airflow
4 5 (1.66%) Tomcat
5 2 (0.66%) Microsoft Exchange
5 2 (0.66%) WebSphere
5 2 (0.66%) WebSphere Application Server
6 1 (0.33%) Apache Spark
6 1 (0.33%) OpenStack
Business Applications
1 3 (1.00%) Remedy ITSM
2 2 (0.66%) Oracle EBS
2 2 (0.66%) Oracle ERP
2 2 (0.66%) PeopleSoft HCM
Cloud Services
1 184 (61.13%) AWS
2 152 (50.50%) Azure
3 67 (22.26%) Amazon EKS
4 55 (18.27%) AWS CloudFormation
5 52 (17.28%) GCP
6 36 (11.96%) GitHub
7 34 (11.30%) SaaS
8 33 (10.96%) PaaS
9 26 (8.64%) Serverless
10 23 (7.64%) AWS Lambda
11 20 (6.64%) Amazon EC2
11 20 (6.64%) Amazon S3
12 18 (5.98%) Azure DevOps
13 15 (4.98%) IaaS
14 14 (4.65%) Datadog
15 12 (3.99%) GitHub Actions
16 11 (3.65%) Microsoft 365
17 9 (2.99%) Cloud Computing
18 6 (1.99%) Entra ID
18 6 (1.99%) Nutanix
Communications & Networking
1 26 (8.64%) DNS
1 26 (8.64%) TCP/IP
2 25 (8.31%) Firewall
3 21 (6.98%) WAN
4 19 (6.31%) LAN
5 16 (5.32%) VPN
6 11 (3.65%) DHCP
6 11 (3.65%) IPsec
7 10 (3.32%) Network Security
8 9 (2.99%) HTTPS
9 8 (2.66%) OSPF
10 7 (2.33%) BGP
10 7 (2.33%) SAN
10 7 (2.33%) VLAN
10 7 (2.33%) WLAN
11 6 (1.99%) Cisco Nexus
11 6 (1.99%) SD-WAN
11 6 (1.99%) Wireless
12 5 (1.66%) Cisco IOS
13 4 (1.33%) BIG-IP
Database & Business Intelligence
1 54 (17.94%) Elasticsearch
2 17 (5.65%) MySQL
3 12 (3.99%) NoSQL
4 10 (3.32%) SQL Server
5 9 (2.99%) Couchbase
5 9 (2.99%) MongoDB
6 7 (2.33%) PostgreSQL
7 3 (1.00%) Relational Database
8 2 (0.66%) ClickHouse
8 2 (0.66%) Data Warehouse
8 2 (0.66%) Oracle Database
8 2 (0.66%) Oracle Exadata
8 2 (0.66%) Power BI
9 1 (0.33%) Amazon Athena
9 1 (0.33%) Apache Cassandra
9 1 (0.33%) Azure SQL Database
9 1 (0.33%) Big Data
9 1 (0.33%) Redis
9 1 (0.33%) SQL Server Integration Services
9 1 (0.33%) SQL Server Reporting Services
Development Applications
1 86 (28.57%) Jenkins
2 57 (18.94%) Git
3 41 (13.62%) GitLab
4 28 (9.30%) SonarQube
5 22 (7.31%) Sonatype Nexus
6 20 (6.64%) JIRA
7 16 (5.32%) Cucumber
8 13 (4.32%) IntelliJ
8 13 (4.32%) JUnit
8 13 (4.32%) Maven
8 13 (4.32%) Mockito
9 7 (2.33%) TeamCity
10 5 (1.66%) Artifactory
10 5 (1.66%) Atlassian Bamboo
11 4 (1.33%) Bitbucket
12 3 (1.00%) AppScan
12 3 (1.00%) IBM UrbanCode
12 3 (1.00%) Selenium
13 1 (0.33%) CircleCI
13 1 (0.33%) TestRail
General
1 75 (24.92%) Finance
2 63 (20.93%) Analytical Skills
2 63 (20.93%) Inclusion and Diversity
3 43 (14.29%) Social Skills
4 23 (7.64%) Telecoms
5 22 (7.31%) Law
6 20 (6.64%) Banking
7 13 (4.32%) Public Sector
8 5 (1.66%) Games
9 4 (1.33%) Marketing
9 4 (1.33%) Retail
10 3 (1.00%) Military
11 2 (0.66%) Electronics
11 2 (0.66%) Investment Banking
11 2 (0.66%) Manufacturing
11 2 (0.66%) Presentation Skills
11 2 (0.66%) Retail Banking
12 1 (0.33%) Financial Institution
12 1 (0.33%) Front Office
12 1 (0.33%) Legal
Job Titles
1 86 (28.57%) Senior
2 66 (21.93%) Developer
3 57 (18.94%) DevOps Engineer
4 49 (16.28%) Software Developer
5 37 (12.29%) Cloud Engineer
5 37 (12.29%) Lead
6 28 (9.30%) AWS DevOps
6 28 (9.30%) Senior DevOps
7 27 (8.97%) Platform Engineer
7 27 (8.97%) Senior Cloud Engineer
8 20 (6.64%) Azure Engineer
9 16 (5.32%) Automation Engineer
9 16 (5.32%) Infrastructure Engineer
9 16 (5.32%) Python Engineer
10 15 (4.98%) AWS DevOps Engineer
10 15 (4.98%) AWS Engineer
10 15 (4.98%) Senior DevOps Engineer
11 13 (4.32%) AWS Developer
11 13 (4.32%) Java Developer
11 13 (4.32%) Senior Java Developer
Libraries, Frameworks & Software Standards
1 72 (23.92%) Node.js
2 51 (16.94%) .NET
3 49 (16.28%) Pandas
4 30 (9.97%) REST
5 15 (4.98%) ARM Templates
5 15 (4.98%) Spring
5 15 (4.98%) Spring Boot
6 14 (4.65%) RabbitMQ
7 13 (4.32%) ActiveMQ
7 13 (4.32%) Elastic Stack
7 13 (4.32%) JMS
8 11 (3.65%) SailPoint
9 9 (2.99%) GraphQL
10 8 (2.66%) Azure Blueprints
11 7 (2.33%) Middleware
12 6 (1.99%) AngularJS
13 5 (1.66%) ADO
14 4 (1.33%) 802.1X
14 4 (1.33%) JSON
14 4 (1.33%) YAML
Miscellaneous
1 50 (16.61%) Management Information System
2 49 (16.28%) Cyberattack
3 28 (9.30%) Hybrid Cloud
4 23 (7.64%) Public Cloud
5 19 (6.31%) Enterprise Software
6 16 (5.32%) Clustering
7 13 (4.32%) Credit Derivative
8 12 (3.99%) Cloud Native
9 11 (3.65%) Data Centre
10 9 (2.99%) Replication
11 8 (2.66%) Onboarding
12 5 (1.66%) Distributed Computing
12 5 (1.66%) Self-Motivation
13 4 (1.33%) Distributed Systems
13 4 (1.33%) Security Posture
14 3 (1.00%) Embedded Systems
14 3 (1.00%) Enterprise Cloud
14 3 (1.00%) Mainframe
15 2 (0.66%) Data Protection Act
15 2 (0.66%) IoT
Operating Systems
1 164 (54.49%) Linux
2 74 (24.58%) Windows
3 52 (17.28%) Android
4 27 (8.97%) Windows Server
5 21 (6.98%) Red Hat Enterprise Linux
6 20 (6.64%) Unix
7 6 (1.99%) Windows Server 2019
8 5 (1.66%) Solaris
8 5 (1.66%) Windows Server 2016
9 4 (1.33%) CentOS
9 4 (1.33%) Oracle Linux
9 4 (1.33%) Windows Server 2008
10 3 (1.00%) Windows Server 2012
11 2 (0.66%) CoreOS
11 2 (0.66%) Debian
11 2 (0.66%) Rocky
11 2 (0.66%) VMS
11 2 (0.66%) Windows 10
11 2 (0.66%) zOS
12 1 (0.33%) Ubuntu
Processes & Methodologies
1 190 (63.12%) CI/CD
2 150 (49.83%) DevOps
3 113 (37.54%) Infrastructure as Code
4 96 (31.89%) Containerisation
5 81 (26.91%) Software Engineering
6 74 (24.58%) Agile
7 57 (18.94%) Collaborative Working
8 52 (17.28%) Design Patterns
9 51 (16.94%) Line Management
10 50 (16.61%) Kanban
11 49 (16.28%) Android Development
11 49 (16.28%) Mathematics
11 49 (16.28%) OO
11 49 (16.28%) OOP
11 49 (16.28%) OWASP
11 49 (16.28%) Secure Coding
11 49 (16.28%) Statistics
12 43 (14.29%) High Availability
13 42 (13.95%) Platform Engineering
14 39 (12.96%) Mentoring
Programming Languages
1 185 (61.46%) Python
2 79 (26.25%) Java
3 68 (22.59%) C++
4 61 (20.27%) JavaScript
5 60 (19.93%) Go
6 51 (16.94%) Rust
7 49 (16.28%) Bash
8 48 (15.95%) PowerShell
9 12 (3.99%) Bicep
10 11 (3.65%) Perl
10 11 (3.65%) SQL
11 10 (3.32%) PHP
12 8 (2.66%) Groovy
12 8 (2.66%) Ruby
12 8 (2.66%) Shell Script
12 8 (2.66%) TypeScript
13 4 (1.33%) R
14 3 (1.00%) C
14 3 (1.00%) C#
15 2 (0.66%) Scala
Qualifications
1 81 (26.91%) Security Cleared
2 57 (18.94%) DV Cleared
3 24 (7.97%) Degree
4 16 (5.32%) AWS Certification
5 13 (4.32%) SC Cleared
6 11 (3.65%) Cisco Certification
7 10 (3.32%) Azure Certification
7 10 (3.32%) CCNP
8 8 (2.66%) BPSS Clearance
9 6 (1.99%) CCNA
9 6 (1.99%) Microsoft Certification
10 5 (1.66%) CCIE
10 5 (1.66%) ITIL Certification
11 3 (1.00%) AWS Certified Solutions Architect
11 3 (1.00%) OCP
11 3 (1.00%) Oracle Certification
12 2 (0.66%) AWS Certified DevOps Engineer
12 2 (0.66%) CITP
12 2 (0.66%) Computer Science Degree
12 2 (0.66%) JNCIS
Quality Assurance & Compliance
1 13 (4.32%) QA
2 10 (3.32%) SLA
3 9 (2.99%) GDPR
3 9 (2.99%) NCSC
4 6 (1.99%) Sarbanes-Oxley
5 4 (1.33%) ISO/IEC 27001
6 3 (1.00%) HIPAA
7 1 (0.33%) Cyber Essentials
7 1 (0.33%) Cyber Essentials PLUS
7 1 (0.33%) Government Security Classifications
7 1 (0.33%) NIST
7 1 (0.33%) PCI DSS
7 1 (0.33%) SOC 2
System Software
1 109 (36.21%) Docker
2 30 (9.97%) Active Directory
3 23 (7.64%) VMware Infrastructure
4 9 (2.99%) VMware ESXi
5 8 (2.66%) Hyper-V
6 7 (2.33%) Veritas Cluster Server
7 3 (1.00%) vSphere
8 2 (0.66%) Firmware
8 2 (0.66%) KVM
8 2 (0.66%) NFS
8 2 (0.66%) SRDF
8 2 (0.66%) Xen
9 1 (0.33%) Virtual Desktop
9 1 (0.33%) Virtual Machines
9 1 (0.33%) Virtual Servers
9 1 (0.33%) VMware NSX
Systems Management
1 217 (72.09%) Terraform
2 156 (51.83%) Kubernetes
3 36 (11.96%) Puppet
4 27 (8.97%) Progress Chef
5 17 (5.65%) Grafana
5 17 (5.65%) Prometheus
6 7 (2.33%) SCCM
7 6 (1.99%) Red Hat Satellite
8 5 (1.66%) Nagios
9 4 (1.33%) Argo
9 4 (1.33%) Microsoft Intune
9 4 (1.33%) Packer
9 4 (1.33%) SCOM
10 3 (1.00%) Istio
10 3 (1.00%) Rundeck
10 3 (1.00%) Single Sign-On
10 3 (1.00%) vCenter Server
10 3 (1.00%) WSUS
11 2 (0.66%) CA Endevor
11 2 (0.66%) NetBackup
Vendors
1 38 (12.62%) VMware
2 33 (10.96%) Microsoft
3 30 (9.97%) Cisco
4 28 (9.30%) Red Hat
5 23 (7.64%) IBM
6 17 (5.65%) Palo Alto
7 13 (4.32%) Oracle
8 11 (3.65%) EMC
9 10 (3.32%) Atlassian
10 9 (2.99%) F5
10 9 (2.99%) SolarWinds
11 8 (2.66%) Aruba
11 8 (2.66%) Fortinet
11 8 (2.66%) Mellanox
11 8 (2.66%) NVIDIA
11 8 (2.66%) Splunk
12 7 (2.33%) Google
12 7 (2.33%) ServiceNow
12 7 (2.33%) Symantec
13 5 (1.66%) Veritas