Microsoft Exchange Jobs with Hybrid/Remote/WFH Options

Microsoft Exchange Server
UK > Work from Home

The table below provides summary statistics for permanent remote or hybrid work requiring Microsoft Exchange skills. It includes a benchmarking guide to the annual salaries offered in vacancies that cited Microsoft Exchange over the 6 months leading up to 8 May 2025, comparing them to the same period in the previous two years.

6 months to
8 May 2025
Same period 2024 Same period 2023
Rank 161 159 160
Rank change year-on-year -2 +1 +102
Permanent jobs citing Microsoft Exchange 343 716 949
As % of all permanent jobs with a WFH option 2.09% 2.12% 2.25%
As % of the Application Platforms category 17.60% 17.98% 18.19%
Number of salaries quoted 277 566 802
10th Percentile £29,750 £28,000 £25,800
25th Percentile £31,250 £34,000 £32,813
Median annual salary (50th Percentile) £42,500 £45,000 £50,000
Median % change year-on-year -5.56% -10.00% +11.11%
75th Percentile £57,500 £56,000 £62,500
90th Percentile £73,886 £71,875 £77,500
UK median annual salary £42,500 £40,000 £42,250
% change year-on-year +6.25% -5.33% +5.63%

All Application Platform Skills
Work from Home

Microsoft Exchange falls under the Application Platforms category. For comparison with the information above, the following table provides summary statistics for all permanent job vacancies with remote or hybrid options requiring application platform skills.

Permanent vacancies with a requirement for application platform skills 1,949 3,983 5,218
As % of all permanent jobs with a WFH option 11.86% 11.79% 12.40%
Number of salaries quoted 1,291 2,840 3,758
10th Percentile £31,250 £31,250 £32,500
25th Percentile £41,250 £40,000 £44,000
Median annual salary (50th Percentile) £60,000 £55,000 £60,000
Median % change year-on-year +9.09% -8.33% +9.09%
75th Percentile £90,000 £75,772 £78,750
90th Percentile £115,000 £110,000 £100,000
UK median annual salary £55,000 £50,000 £55,000
% change year-on-year +10.00% -9.09% +0.42%

Microsoft Exchange
Trend for Jobs with a WFH Option

Job vacancies with remote working options citing Microsoft Exchange as a proportion of all IT jobs advertised.
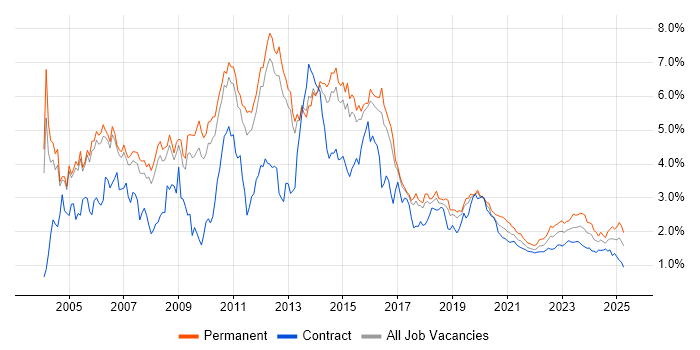
Microsoft Exchange trend for jobs with Hybrid/Remote/WFH options

Microsoft Exchange
Salary Trend for Jobs with a WFH Option

3-month moving average salary quoted in job vacancies with remote working options citing Microsoft Exchange.

Microsoft Exchange salary trend for jobs with a WFH option

Microsoft Exchange
Salary Histogram for Jobs with a WFH Option

Salary distribution for jobs with remote working options citing Microsoft Exchange over the 6 months to 8 May 2025.

Microsoft Exchange salary histogram for jobs with a WFH option

Microsoft Exchange
Co-occurring Skills and Capabilities with WFH Options by Category

The follow tables expand on the table above by listing co-occurrences grouped by category. The same employment type, locality and period is covered with up to 20 co-occurrences shown in each of the following categories:

Application Platforms
1 112 (32.65%) SharePoint
2 15 (4.37%) IIS
3 12 (3.50%) Skype for Business
4 8 (2.33%) Exchange Server 2013
5 7 (2.04%) Blackberry Enterprise Server
6 1 (0.29%) Exchange Server 2010
6 1 (0.29%) NetWeaver
Applications
1 36 (10.50%) Microsoft Office
2 9 (2.62%) Microsoft Excel
3 1 (0.29%) 1Password
Business Applications
1 8 (2.33%) Sage 50
2 5 (1.46%) Sage 200
3 4 (1.17%) Elite 3E
4 2 (0.58%) Carpe Diem
4 2 (0.58%) Dynamics CRM
5 1 (0.29%) SAP HCM
Cloud Services
1 215 (62.68%) Microsoft 365
2 175 (51.02%) Azure
3 75 (21.87%) Entra ID
4 55 (16.03%) OneDrive
5 30 (8.75%) SaaS
6 23 (6.71%) Power Platform
7 22 (6.41%) Microsoft Copilot
8 19 (5.54%) Cloud Computing
9 18 (5.25%) Microsoft Purview
10 13 (3.79%) PowerApps
11 12 (3.50%) Power Automate
12 9 (2.62%) AWS
13 8 (2.33%) IaaS
14 7 (2.04%) Cohesity
15 6 (1.75%) Mimecast
15 6 (1.75%) PaaS
16 5 (1.46%) GitHub
17 4 (1.17%) Azure Monitor
18 3 (0.87%) Google Workspace
19 2 (0.58%) Azure AKS
Communications & Networking
1 84 (24.49%) Firewall
2 69 (20.12%) DNS
3 53 (15.45%) DHCP
4 43 (12.54%) LAN
5 42 (12.24%) WAN
6 37 (10.79%) SAN
6 37 (10.79%) VPN
7 22 (6.41%) TCP/IP
8 17 (4.96%) Internet
9 16 (4.66%) Remote Desktop
9 16 (4.66%) Wireless
10 15 (4.37%) SMTP
11 13 (3.79%) VoIP
12 12 (3.50%) Skype
12 12 (3.50%) Wi-Fi
13 10 (2.92%) NAS
13 10 (2.92%) Network Security
13 10 (2.92%) VLAN
14 8 (2.33%) DKIM
14 8 (2.33%) DMARC
Database & Business Intelligence
1 43 (12.54%) SQL Server
2 14 (4.08%) Data Hub
2 14 (4.08%) SQL CLR
3 13 (3.79%) Power BI
4 11 (3.21%) SQL Server Reporting Services
5 9 (2.62%) Metadata
5 9 (2.62%) SQL Server Analysis Services
6 3 (0.87%) Azure SQL Data Warehouse
6 3 (0.87%) Data Warehouse
6 3 (0.87%) Relational Database
7 2 (0.58%) EDMS
8 1 (0.29%) Amazon RDS
8 1 (0.29%) Azure SQL Database
8 1 (0.29%) DB2
8 1 (0.29%) MS Access
8 1 (0.29%) QlikView
8 1 (0.29%) Sybase ASE
Development Applications
1 5 (1.46%) JIRA
2 2 (0.58%) Git
3 1 (0.29%) Hudson
General
1 111 (32.36%) Social Skills
2 73 (21.28%) Finance
3 35 (10.20%) Legal
4 32 (9.33%) Law
5 25 (7.29%) Analytical Skills
6 23 (6.71%) Manufacturing
7 22 (6.41%) Retail
8 21 (6.12%) German Language
9 15 (4.37%) Inclusion and Diversity
10 14 (4.08%) Back Office
11 11 (3.21%) Automotive
11 11 (3.21%) Banking
12 7 (2.04%) Presentation Skills
13 6 (1.75%) Public Sector
13 6 (1.75%) Telecoms
14 5 (1.46%) Advertising
14 5 (1.46%) Aerospace
14 5 (1.46%) Games
15 3 (0.87%) Local Government
15 3 (0.87%) Organisational Skills
Job Titles
1 71 (20.70%) IT Support
2 68 (19.83%) Support Engineer
3 56 (16.33%) Analyst
4 54 (15.74%) 2nd Line Support
5 42 (12.24%) Infrastructure Engineer
6 40 (11.66%) Senior
7 35 (10.20%) Support Analyst
8 31 (9.04%) 3rd Line Engineer
8 31 (9.04%) 3rd Line Support
9 28 (8.16%) IT Engineer
10 27 (7.87%) IT Analyst
11 26 (7.58%) 3rd Line Support Engineer
12 25 (7.29%) IT Support Analyst
13 22 (6.41%) IT Support Engineer
14 21 (6.12%) Information Security Specialist
14 21 (6.12%) Information Specialist
14 21 (6.12%) Security Specialist
14 21 (6.12%) Support Technician
15 20 (5.83%) Cloud Engineer
15 20 (5.83%) IT Technician
Libraries, Frameworks & Software Standards
1 21 (6.12%) SailPoint
2 9 (2.62%) .NET
3 5 (1.46%) .NET Core
3 5 (1.46%) .NET Framework
3 5 (1.46%) Dapper ORM
3 5 (1.46%) Entity Framework
4 3 (0.87%) SAML
5 2 (0.58%) EDI
5 2 (0.58%) FIX Protocol
6 1 (0.29%) ARM Templates
6 1 (0.29%) JDBC
6 1 (0.29%) LDAP
6 1 (0.29%) WSH
Miscellaneous
1 36 (10.50%) Onboarding
2 29 (8.45%) Management Information System
3 22 (6.41%) Virtual Team
4 15 (4.37%) Driving Licence
4 15 (4.37%) Self-Motivation
5 14 (4.08%) Private Cloud
6 12 (3.50%) FMCG
7 8 (2.33%) Cloud Native
8 7 (2.04%) Blackberry
9 6 (1.75%) Product Ownership
9 6 (1.75%) Video Conferencing
10 5 (1.46%) Clustering
10 5 (1.46%) Team-Oriented Environment
11 4 (1.17%) PKI
12 3 (0.87%) e-Learning
12 3 (0.87%) Fat Client
12 3 (0.87%) iPhone
12 3 (0.87%) Replication
12 3 (0.87%) Security Operations Centre
12 3 (0.87%) Security Posture
Operating Systems
1 219 (63.85%) Windows
2 141 (41.11%) Windows Server
3 39 (11.37%) Windows Server 2019
4 33 (9.62%) Windows Server 2016
5 32 (9.33%) Windows 10
6 20 (5.83%) Android
7 19 (5.54%) Linux
8 17 (4.96%) Mac OS
9 9 (2.62%) Windows Server 2012
10 7 (2.04%) Windows Server 2008
11 6 (1.75%) Apple iOS
12 3 (0.87%) CentOS
12 3 (0.87%) Ubuntu
12 3 (0.87%) Windows 7
13 2 (0.58%) SUSE
13 2 (0.58%) Unix
13 2 (0.58%) Windows Server 2003
14 1 (0.29%) Debian
14 1 (0.29%) Mac OS X
Processes & Methodologies
1 80 (23.32%) Problem-Solving
2 65 (18.95%) Infrastructure Engineering
3 57 (16.62%) ITIL
4 55 (16.03%) Customer Service
5 44 (12.83%) Mentoring
6 37 (10.79%) Identity Management
7 36 (10.50%) Migration
8 30 (8.75%) Disaster Recovery
9 28 (8.16%) High Availability
10 26 (7.58%) Collaborative Working
10 26 (7.58%) Cybersecurity
10 26 (7.58%) Identity Access Management
10 26 (7.58%) Information Security
11 24 (7.00%) Risk Management
12 22 (6.41%) Project Management
13 21 (6.12%) Problem Management
13 21 (6.12%) Risk Assessment
14 20 (5.83%) Infrastructure Management
14 20 (5.83%) Mobile Device Management
15 18 (5.25%) Change Management
Programming Languages
1 88 (25.66%) PowerShell
2 35 (10.20%) SQL
3 10 (2.92%) T-SQL
4 9 (2.62%) Python
5 7 (2.04%) C#
6 5 (1.46%) Bash
7 3 (0.87%) Perl
7 3 (0.87%) PHP
8 2 (0.58%) Progress 4GL
8 2 (0.58%) VB
9 1 (0.29%) ABAP
9 1 (0.29%) Bicep
9 1 (0.29%) JavaScript
9 1 (0.29%) RPG
9 1 (0.29%) RPG IV
9 1 (0.29%) VBScript
Qualifications
1 66 (19.24%) Degree
2 20 (5.83%) Security Cleared
3 19 (5.54%) Microsoft Certification
4 16 (4.66%) Azure Certification
4 16 (4.66%) CCNA
4 16 (4.66%) Cisco Certification
5 10 (2.92%) SC Cleared
6 9 (2.62%) DV Cleared
6 9 (2.62%) ITIL Foundation Certificate
7 8 (2.33%) MCSA
8 7 (2.04%) MCP
9 6 (1.75%) A+ Certification
9 6 (1.75%) CCNP
9 6 (1.75%) ITIL Certification
9 6 (1.75%) MCSE
10 4 (1.17%) BPSS Clearance
10 4 (1.17%) DBS Check
11 3 (0.87%) AWS Certification
11 3 (0.87%) Computer Science Degree
11 3 (0.87%) Network+ Certification
Quality Assurance & Compliance
1 31 (9.04%) SLA
2 9 (2.62%) GDPR
3 4 (1.17%) HIPAA
4 1 (0.29%) Actionable Recommendations
4 1 (0.29%) COBIT
System Software
1 263 (76.68%) Active Directory
2 89 (25.95%) VMware Infrastructure
3 43 (12.54%) Hyper-V
4 17 (4.96%) Virtual Machines
5 16 (4.66%) XenApp
6 12 (3.50%) vSphere
7 11 (3.21%) Terminal Services
8 7 (2.04%) Virtual Desktop
8 7 (2.04%) VMware ESXi
9 4 (1.17%) Docker
10 3 (0.87%) Dovecot
10 3 (0.87%) Postfix
10 3 (0.87%) Terminal Server
11 2 (0.58%) XenDesktop
12 1 (0.29%) Firmware
12 1 (0.29%) VMware Server
Systems Management
1 81 (23.62%) Microsoft Intune
2 21 (6.12%) SCCM
3 13 (3.79%) Single Sign-On
4 9 (2.62%) Failover Clustering
5 6 (1.75%) Active Directory Federation Services
5 6 (1.75%) Kubernetes
6 5 (1.46%) AirWatch
6 5 (1.46%) Terraform
7 4 (1.17%) SCOM
8 2 (0.58%) Ansible
8 2 (0.58%) Backup Exec
8 2 (0.58%) Forefront Identity Manager
8 2 (0.58%) NetBackup
8 2 (0.58%) SCOrch
8 2 (0.58%) SCSM
8 2 (0.58%) Symantec Endpoint Protection
8 2 (0.58%) vCenter Server
9 1 (0.29%) Autotask
9 1 (0.29%) Norton AntiVirus
9 1 (0.29%) SmoothWall
Vendors
1 220 (64.14%) Microsoft
2 118 (34.40%) VMware
3 52 (15.16%) Cisco
4 36 (10.50%) Citrix
5 28 (8.16%) Meraki
6 24 (7.00%) Okta
7 21 (6.12%) Salesforce
8 20 (5.83%) Apple
8 20 (5.83%) SonicWALL
9 16 (4.66%) CheckPoint
9 16 (4.66%) NetApp
10 13 (3.79%) Dell
11 11 (3.21%) iManage
12 10 (2.92%) Veritas
13 9 (2.62%) Fortinet
13 9 (2.62%) Google
13 9 (2.62%) HP
13 9 (2.62%) Sage
14 8 (2.33%) IronPort
15 7 (2.04%) Veeam